AN EXPLORATION OF THE RELATIONSHIP
BETWEEN INDICATORS OF THE COMMUNITY
OF INQUIRY FRAMEWORK AND RETENTION IN
ONLINE PROGRAMS
Wally Boston Phil Ice
American Public University System American Public University System
Sebastián R. Díaz Jennifer Richardson
West Virginia University Purdue University
Angela M. Gibson Karen Swan
American Public University System University of Illinois Springfield *Authors listed in alphabetical order to denote equal contributions.
ABSTRACT
As the growth of online programs continues to rapidly accelerate, concern over retention is increasing. Models for understanding student persistence in the face-to-face environment are well established, however, the many of the variables in these constructs are not present in the online environment or they manifest in significantly different ways. With attrition rates significantly higher than in face-to-face programs, the development of models to explain online retention is considered imperative. This study moves in that direction by exploring the relationship between indicators of the Community of Inquiry Framework and student persistence. Analysis of over 28,000 student records and survey data demonstrates a significant amount of variance in re-enrollment can be accounted for by indicators of Social Presence.
KEYWORDS
Community of Inquiry, Retention, Online Programs
I.
INTRODUCTION
With almost four million students enrolled in online courses in the United States alone, and a 12.9% growth rate in online enrollments, program growth is considered a priority at over 80% of major US institutions of higher education [1]. While compelling, this accelerated growth has raised significant questions related to the quality of online instruction in terms of outcomes. One measure of outcomes is student learning and perceived efficacy. In their 2009 study, the US Department of education isolated 51 common factors across thousands of studies and concluded that, in general, online learning is more effective than face-to-face learning [2]. However, despite this highly positive finding, the question of retention remains problematic for online programs, with several studies and anecdotal evidence indicating attrition rates for online courses frequently being much higher than for their campus-based counterparts
[3, 4, 5, 6]. In more recent work, Patterson and McFadden [7] found dropout rates to be six to seven times higher in online programs.
In the traditional campus setting, student persistence and retention have been a documented issue in higher education in the United States since the late 1800’s [8]. Formal research studies on the topic of retention began as early as 1926 [9] but publications of research on retention escalated in the 1970’s with academics such as Spady [10], Astin [11], Tinto [12, 13], Pascarella [14], and Braxton [15] publishing influential research on the topic of student retention.
A number of researchers have found that the higher the high school GPA and the higher the SAT or ACT score of a college student, the stronger the chance that the student will persist in college and graduate [11]. However, this is only one set of positive indicators of retention. Researchers have also identified the importance of social integration in the student retention rates of colleges [10, 12, 11]. Tinto’s model of student persistence theorized that the greater the level of academic and social integration, the greater the student’s chances at persisting until graduation [12].
While the social integration process is well documented in traditional higher education settings, similar research in the online environment is in its infancy. However, the Community of Inquiry Framework provides a widely recognized model for understanding interactions in the online environment and insight into how social integration may occur in online environments.
Developed by Garrison, Anderson, and Archer [16], the Community of Inquiry (CoI) model is a theoretical framework that explains the online learning experience in terms of interactions between three overlapping presences: Teaching, Social and Cognitive. Since its inception, the CoI framework has been the most frequently cited model for explaining the online learning experience, with extensive research undertaken on each of the individual presences [17, 18]. In 2007, the framework was operationalized as survey instrument and validated through multi-institutional data collection and analysis [19].
The first of the three presences, social presence, is the basis of collaborative learning and the foundation for meaningful, constructivist learning online [20]. In the context of online learning, social presence is described as the ability of learners to project themselves socially and emotionally as well as their ability to perceive other learners as “real people” [21]. The three main factors that allow for the effective projection and establishment of social presence are affective expression, open communication and group cohesion [22, 21].
Affective expression is the ability of online learners to project themselves through such text-based verbal behaviors as the use of para-language, self-disclosure, humor, and other expressions of emotion and values. Open communication refers to the provision of a risk-free learning climate in which participants trust one another enough to reveal themselves. Group cohesion refers to the development of a group identity and the ability of participants in the learning community to collaborate meaningfully. Research has shown a link between perceived social presence and perceived learning and satisfaction in online courses [22, 21]. There is also some indication that social presence has a direct [23] and/or mediating [24] effect on learning and learning processes. However, it has also been shown that there are differences in the effects of the social presence of instructors and peers on learning and interactions online [21] and it may be that it is hard to tease apart the social presence of instructors from teaching presence.
Cognitive presence is the extent to which learners are able to construct and confirm meaning through reflection and discourse and is defined as a four stage process of practical inquiry. First is a triggering event, where an issue or problem is identified for further inquiry. Next is exploration, where students explore the issue both individually and as a community, through reflection and discourse. The third stage is integration, where learners construct meaning from ideas developed during exploration. Finally, the process culminates in resolution, where learners apply the new knowledge [16, 18].
Teaching presence, the third component of the CoI framework, is described by Garrison and colleagues (2001) as having a three-part structure consisting of: instructional design and organization, facilitation of discourse, and direct instruction.
Instructional design and organization involves the planning and design of the structure, processes, interaction and evaluation aspects of an online course [16]. Some activities within this category might include building curriculum materials, such as creating presentations and lecture notes on the course site, and providing audio/video mini-lectures, offering a mix of individual and group activities along with a clear schedule for their completion, and providing guidelines on how to use the medium effectively, including netiquette [16, 18].
Facilitation of discourse is described as the means by which students engage in interacting about and building upon the information provided in the instructional materials [16]. In order to facilitate discourse, the instructor may review and comment upon student posts, raise questions and make observations to direct discussions as desired, keep discussions moving efficiently, draw out inactive students and limit the activities of dominant students if detrimental to the group [25, 26].
Direct instruction is described as providing intellectual and scholarly leadership from a subject matter expert in order to diagnose comments for accurate understanding, inject sources of information, direct useful discussions, and scaffold learner knowledge to a higher level [27]. Within this role, the instructor uses various means of assessment and feedback that should be delivered in a timely fashion.
II.
METHOD
The problem addressed in this study is whether CoI survey indicators can be used to predict students’ likelihood to remain enrolled in an online educational program of study. The following research question is used to examine this problem:
• RQ 1: Is there a statistically significant predictive relationship between CoI survey indicators and a students’ likelihood to remain enrolled in an online educational program of study?
Linear regression was utilized to analyze the relationship between a linear combination of the 34 independent variables (i.e. Likert scale responses to each of the 34 CoI survey items) and the binary dependent variable measuring whether or not a student enrolled in the subsequent semester. A binary dependent variable typically demands logistic, as opposed to linear regression. This study’s use of a binary dependent variable with linear regression is supported in the literature even though it compromises the assumption that residuals are normally distributed about the predicted DV scores (Cohen, Cohen, West & Aiken, 2002). The number of subjects included in this study (n = 28,877) ensures adequate statistical power by far exceeding the minimally adequate sample sizes suggested by Green (1991). Multicollinearity is a limitation inherent in this study given the instances of high correlations among the predictor variables.
A. Instructional Setting
American Public University System (APUS) is an online, for-profit university. Founded in 1991, it was originally known as American Military University (AMU) and offered graduate degrees for officers in the United States Armed Forces. In 2002, AMU reorganized as APUS and created two virtual universities operating under APUS’ accreditation, American Military University and American Public University. Shortly after reorganizing, APUS applied for accreditation with the Higher Learning Commission of the North Central Association and achieved candidacy status in 2004 and initial accreditation in 2006.
Founded as an institution devoted to serving the needs of military students, APUS’ top priority has always been engaging dispersed learners in high quality, collaborative learning experiences; a philosophy that extends to the civilian market served by APU. Since 2000, APUS has experienced a compound annual growth rate in student enrollment of 66.9% and expanded to 51 certificates, 19 Associates degrees, 32 Bachelor degrees and 23 Masters degrees. As of June 30, 2009, APUS served 53,600 students in all 50 states and 109 countries. Courses are offered every month, with a semester being either eight or 16 weeks in duration. Over 90% of courses are currently offered in the eight week semester format.
B. Participants
Students (n = 28,877) who completed the CoI survey were all enrolled in bachelors or associates level courses. The survey was administered to all students, taking classes, at the end of each semester; this sample constitutes a response rate of 38.91%. Age of participants ranged from 18 to 62 years old, with a mean of 28.2 years. Males comprised 68% of the sample and females comprised 32%.
C. Design
CoI survey (Appendix A) is administered to students at APUS at the end of every semester as part of a large-scale institutional, continuous quality improvement initiative [28]. Data used in this study were collected over a period of six semesters. Descriptive statistics were used to assess the means and standard deviations for each item. Principal axis factor analysis, with direct oblimin rotation, was used to insure the conceptual integrity of the data by inspection of alignment with the findings of Swan et al. [27].
Following confirmation of the expected factor pattern, linear regression was applied to the data. The dependent variable was established as students’ enrollment status in the semester following the completion of the CoI survey. As enrollment status is a categorical variable, a dummy variable was created to represent the criterion variable using suggestions by Cohen, Cohen, West and Aiken [29]. The predictor variables were student responses to each of the 34 CoI survey items, measured on a 5 point Likert scale, with Strongly Disagree = 1 and Strongly Disagree = 5. For this linear regression, the Forward method was used in the SPSS version 17. This means that the order which variables are listed in this table indicates their relative statistical significance in the predictive model.
III.
RESULTS OF THE STUDY AND DISCUSSION
The following table depicts the means and standard deviations for each the 34 indicators: Standard
Mean Deviation N
4.46 0.806 28877 4.48 0.785 28877 1.The instructor clearly communicated important course topics.
3. The instructor provided clear instructions on how to participate in course learning activities.
4. The instructor clearly communicated important due dates/time frames for learning activities.
5. The instructor was helpful in identifying areas of agreement and disagreement on course topics that helped me to learn. 6. The instructor was helpful in guiding the class towards understanding course topics in a way that helped me clarify my thinking.
7. The instructor helped to keep course participants engaged and participating in productive dialogue.
8. The instructor helped keep the course participants on task in a way that helped me to learn.
9. The instructor encouraged course participants to explore new concepts in this course.
10. Instructor actions reinforced the development of a sense of community among course participants.
11. The instructor helped to focus discussion on relevant issues in a way that helped me to learn.
12. The instructor provided feedback that helped me understand my strengths and weaknesses.
13. The instructor provided feedback in a timely fashion. 14. Getting to know other course participants gave me a sense of belonging in the course.
15. I was able to form distinct impressions of some course participants.
16. Online or web-based communication is an excellent medium for social interaction.
17. I felt comfortable conversing through the online medium. 18. I felt comfortable participating in the course discussions. 19. I felt comfortable interacting with other course participants. 20. I felt comfortable disagreeing with other course participants while still maintaining a sense of trust.
21. I felt that my point of view was acknowledged by other course participants.
22. Online discussions help me to develop a sense of collaboration.
23. Problems posed increased my interest in course issues. 24. Course activities piqued my curiosity.
25. I felt motivated to explore content related questions. 26. I utilized a variety of information sources to explore problems posed in this course.
27. Brainstorming and finding relevant information helped me resolve content related questions.
28. Discussing course content with my classmates was valuable in helping me appreciate different perspectives. 29. Combining new information helped me answer questions raised in course activities.
30. Learning activities helped me construct explanations/solutions.
31. Reflection on course content and discussions helped me understand fundamental concepts in this class.
4.45 0.830 28877 4.54 0.749 28877 4.30 0.927 28877
4.31 0.941 28877 4.30 0.952 28877 4.30 0.931 28877 4.36 0.888 28877 4.27 0.955 28877 4.32 0.921 28877 4.27 1.036 28877 4.30 1.032 28877 3.94 0.958 28877 4.01 0.934 28877 4.03 0.942 28877 4.37 0.741 28877 4.40 0.743 28877 4.37 0.755 28877 4.30 0.786 28877 4.30 0.793 28877 4.18 0.887 28877 4.13 0.911 28877 4.21 0.903 28877 4.25 0.905 28877 4.37 0.768 28877 4.28 0.803 28877 4.11 0.927 28877 4.28 0.785 28877 4.27 0.815 28877 4.30 0.815 28877
1. The instructor clearly
communicated important course topics.
2. The instructor clearly
communicated important course goals.
3. The instructor provided clear instructions on how to participate in course learning activities.
4. The instructor clearly communicated important due dates/time frames for learning activities.
5. The instructor was helpful in identifying areas of agreement and disagreement on course topics that helped me to learn.
6. The instructor was helpful in guiding the class towards
understanding course topics in a way that helped me clarify my thinking. 7. The instructor helped to keep course participants engaged and participating in productive dialogue. 8. The instructor helped keep the course participants on task in a way that helped me to learn.
9. The instructor encouraged course participants to explore new concepts in this course.
10. Instructor actions reinforced the development of a sense of
community among course participants.
11. The instructor helped to focus discussion on relevant issues in a way that helped me to learn.
4.30 4.26 4.33
0.806 28877 0.824 28877 0.820 28877 32. I can describe ways to test and apply the knowledge
created in this course.
33. I have developed solutions to course problems that can be applied in practice.
34. I can apply the knowledge created in this course to my work or other non-class related activities.
Table 1. Descriptive Statistics
The means show a generally high level of satisfaction, with relatively large standard deviations indicating a significant clustering of replies around the mean. The three lowest means are clustered on the indicators of affective expression (questions 14, 15, and 16).
The following table depicts the results of the principal axis factor analysis: Factor 1 Teaching Presence 0.881 0.877 0.867 0.767 0.900 0.926 0.904 0.904 0.843 0.871 0.833
Factor 2 Factor 3 Social Cognitive
Presence Presence Eignevalue % Variance
-0.019 -0.016
-0.008 -0.003
0.015 0.034
0.038 0.021
-0.012 -0.018
-0.021 -0.020
0.044 0.031
20.920 0.015 -0.020
0.006 -0.058
0.084 0.023
0.004 -0.094
0.844 -0.039 -0.052 0.831 -0.022 0.032
0.043 0.626 -0.154
0.029 0.593 -0.169
-0.063 0.678 -0.128 0.039 0.846 0.013 0.084 0.870 0.051 0.027 0.974 0.107
3.277 9.638 0.010 0.895 0.049
0.047 0.859 0.022 -0.026 0.827 -0.077 0.041 0.052 -0.736 0.079 -0.019 -0.801 0.069 -0.024 -0.821
-0.027 0.048 -0.770
-0.044 0.047 -0.822
1.649 4.849 -0.043 0.406 -0.483
-0.031 0.097 -0.833
0.078 0.002 -0.834
0.089 0.026 -0.804 12. The instructor provided feedback
that helped me understand my strengths and weaknesses.
13. The instructor provided feedback in a timely fashion.
14. Getting to know other course participants gave me a sense of belonging in the course. 15. I was able to form distinct impressions of some course participants.
16. Online or web-based communication is an excellent medium for social interaction. 17. I felt comfortable conversing through the online medium. 18. I felt comfortable participating in the course discussions.
19. I felt comfortable interacting with other course participants.
20. I felt comfortable disagreeing with other course participants while still maintaining a sense of trust. 21. I felt that my point of view was acknowledged by other course participants.
22. Online discussions help me to develop a sense of collaboration. 23. Problems posed increased my interest in course issues.
24. Course activities piqued my curiosity.
25. I felt motivated to explore content related questions.
26. I utilized a variety of information sources to explore problems posed in this course.
27. Brainstorming and finding relevant information helped me resolve content related questions. 28. Discussing course content with my classmates was valuable in helping me appreciate different perspectives.
29. Combining new information helped me answer questions raised in course activities.
30. Learning activities helped me construct explanations/solutions. 31. Reflection on course content and discussions helped me understand fundamental concepts in this class.
32. I can describe ways to test and apply the knowledge created in this
course. 0.026 -0.035 -0.889 33. I have developed solutions to
course problems that can be applied
in practice. -0.014 -0.033 -0.914 34. I can apply the knowledge
created in this course to my work or
other non-class related activities. 0.032 -0.048 -0.867
Cumulative Variance Accounted for = 76.017
Table 2. Principal Axis Factor Analysis
Visual inspection confirms the expected three factor solution, with 76% of the cumulative variance accounted for. These findings validated the conceptual alignment of the survey data, allowing for linear regression analysis to proceed with a high degree of confidence in the validity of the construct measured by predictor variables.
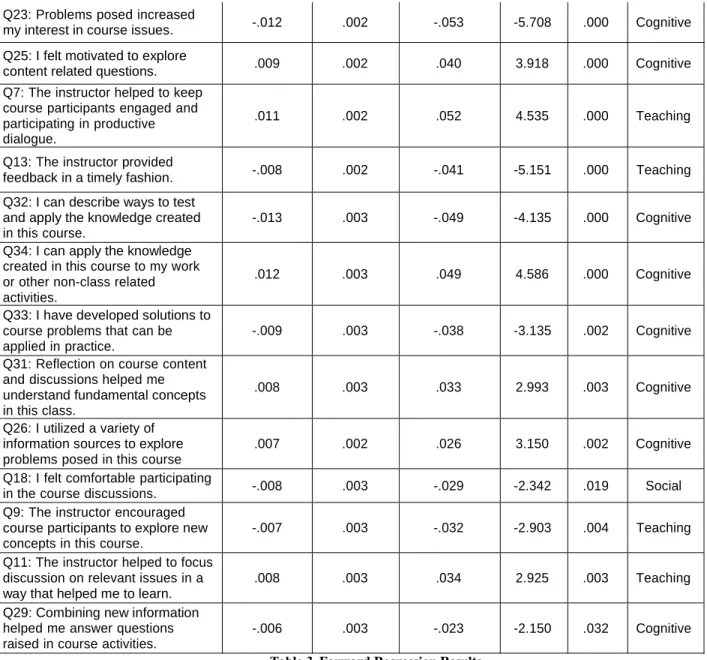
Forward method linear regression, illustrated in the following table, resulted in 21 of the 34 CoI items serving as statistically significant predictors. In addition to denoting the particular item number (Q1 = Item 1 of the CoI), the table indicates the respective type of presence the item measures.
Unstandardized Coefficients Standardized Coefficients Beta .290 .223 .051 -.089 .061 -.049 .074 -.035 Std. Error .008 .002 .002 .002 .002 .002 .003 .004 .003 (Constant)
Q16: Online or web-based communication is an excellent medium for social interaction. Q15: I was able to form distinct impressions of some course participants.
Q28: Online discussions were valuable in helping me appreciate different perspectives.
Q14: Getting to know other course participants gave me a sense of belonging in the course.
Q22: Online discussions help me to develop a sense of
collaboration.
Q21: I felt that my point of view was acknowledged by other course participants.
Q19: I felt comfortable interacting with other course participants. Q20: I felt comfortable disagreeing with other course participants while still maintaining a sense of trust.
t 67.040 35.518 23.993 5.581 -8.710 5.810 -4.685 5.411 -3.317 B .509 .064 .049 .011 -.019 .014 -.013 .020 -.009 Type of Sig. Presence
.000 n/a .000 Social
.000 Social
.000 Cognitive
.000 Social
.000 Social
.000 Social
.000 Social
-.012 .002 -.053 -5.708 .000 Cognitive .009 .002 .040 3.918 .000 Cognitive
.011 .002 .052 4.535 .000 Teaching
-.008 .002 -.041 -5.151 .000 Teaching
-.013 .003 -.049 -4.135 .000 Cognitive
.012 .003 .049 4.586 .000 Cognitive
-.009 .003 -.038 -3.135 .002 Cognitive
.008 .003 .033 2.993 .003 Cognitive
.007 .002 .026 3.150 .002 Cognitive -.008 .003 -.029 -2.342 .019 Social -.007 .003 -.032 -2.903 .004 Teaching
.008 .003 .034 2.925 .003 Teaching
-.006 .003 -.023 -2.150 .032 Cognitive
Table 3. Forward Regression Results
Q23: Problems posed increased my interest in course issues. Q25: I felt motivated to explore content related questions. Q7: The instructor helped to keep course participants engaged and participating in productive dialogue.
Q13: The instructor provided feedback in a timely fashion. Q32: I can describe ways to test and apply the knowledge created in this course.
Q34: I can apply the knowledge created in this course to my work or other non-class related activities.
Q33: I have developed solutions to course problems that can be applied in practice.
Q31: Reflection on course content and discussions helped me understand fundamental concepts in this class.
Q26: I utilized a variety of information sources to explore problems posed in this course Q18: I felt comfortable participating in the course discussions.
Q9: The instructor encouraged course participants to explore new concepts in this course.
Q11: The instructor helped to focus discussion on relevant issues in a way that helped me to learn. Q29: Combining new information helped me answer questions raised in course activities.
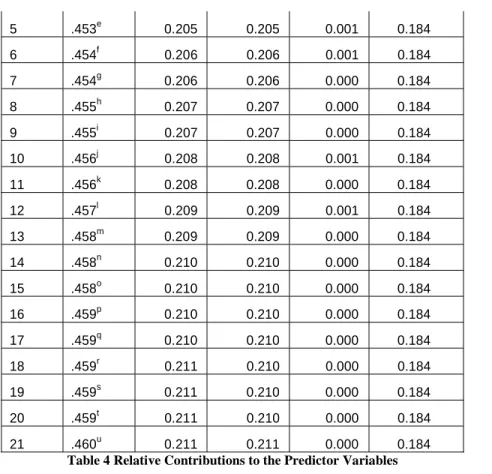
The following table illustrates the relative contributions of each of the predictor variables to the significant predictive model. The Forward method in SPSS enters predictor variables one by one in order of decreasing significance. This table, therefore, illustrates the changes in Adjusted R2 as each variable is entered:
Std. Error
R Adjusted R Square of the
Model R Square R Square Change Estimate
1 .424a 0.180 0.180 0.180 0.187 2 .450b 0.202 0.202 0.022 0.185 3 .451c 0.203 0.203 0.001 0.185 4 .453d 0.205 0.205 0.002 0.184
5 .453e 0.205 0.205 0.001 0.184 6 .454f 0.206 0.206 0.001 0.184 7 .454g 0.206 0.206 0.000 0.184 8 .455h 0.207 0.207 0.000 0.184 9 .455i 0.207 0.207 0.000 0.184 10 .456j 0.208 0.208 0.001 0.184 11 .456k 0.208 0.208 0.000 0.184 12 .457l 0.209 0.209 0.001 0.184 13 .458m 0.209 0.209 0.000 0.184 14 .458n 0.210 0.210 0.000 0.184 15 .458o 0.210 0.210 0.000 0.184 16 .459p 0.210 0.210 0.000 0.184 17 .459q 0.210 0.210 0.000 0.184 18 .459r 0.211 0.210 0.000 0.184 19 .459s 0.211 0.210 0.000 0.184 20 .459t 0.211 0.210 0.000 0.184 21 .460u 0.211 0.211 0.000 0.184
Table 4 Relative Contributions to the Predictor Variables
The analysis shows that a total of 21.1% of the variance in student re-enrollment is accounted for by 19 of the CoI indicators. However, all but 0.9% of that variance can be accounted for by two indicators:
SP 16. Online or web-based communication is an excellent medium for social interaction. And
SP 15. I was able to form distinct impressions of some course participants.
These two items are two of the three affective expression indicators. The former item accounts for 18% (i.e. almost all) of the total variance and the latter accounts for 2.2%. This suggests that projections of social presence in general and affective expression in particular are important determinants for persistence in online education. Social presence, the degree to which a person is perceived as a ‘real person’ in mediated communication” [30] has been found in research studies to have an impact on students’ satisfaction with a course [30, 31, 32, 22, 33, 21] perceived learning [22, 34] and actual learning [23, 33]. In addition, a recent study by Liu, Gomez, and Yen [35] suggests that social presence as a construct is a significant predictor of course retention and final grade in the community college online environment. Perhaps more to the point for these findings, Tu & McIssac found that “students who feel more like insiders in the learning community were more likely to achieve success. In a computer-mediated environment, feelings of community and social presence may be considered to be strongly connected to each other and to online interaction” [32].
Rodriguez, Plax, and Kearney (1996) claimed that teacher immediacy behaviors influenced students’ affective learning, which in turn influenced students’ cognitive learning and similarly, the CoI “posits that the ability to construct knowledge in online environments is contingent on the capacity of teachers and
teaching and social presence represent the processes needed to create paths to and cognitive presence for online learners” [24]. In other words, students who positively perceive online learning environments, which is potentially increased by their perception that they are part of a larger (social) learning community are more likely to have increased retention.
Of the remaining 17 significant indicators, it is notable that six are from the social presence category. As such, all but one of the social presence indicators was a significant predictor of re-enrollment; or 88% of all social presence indicators were significant predictors of student re-enrollment. Of the remaining significant indicators, four were from teaching presence (33% of all teaching presence indicators) and nine were from cognitive presence (75% of all cognitive presence indicators).
IV.
CONCLUSIONS
Although statistical results in social science should never be deemed definitively causal, the sample size in this study warrants further and closer inspection of the impact of two Social Presence items on retention. Responses to CoI item # 16 (Online or web-based communication is an excellent medium for social interaction.) account for over 18% of the variance associated with whether a student returned to studies in the semester subsequent to completing the survey. This is, simply stated, a remarkable finding, especially in light of the sample size obtained.
One may reason that students attending fully online universities seek social interaction primarily online. However, future research can also examine whether similar results would be obtained in a blended setting. The extent to which students at any university seek social interaction via the Web has profound implications for both academic and student affairs. In the academic realm, faculty may need to redesign their curriculum to allow students opportunities to engage with one another online, even in traditional face-to-face courses. In the student affairs realm, programming designed to enhance student engagement (and in turn retention) may need to provide today’s students opportunities for such interaction online. Although residential campuses are designed to promote face-to-face interaction, students on these campuses are often seen texting friends while walking to and from class, and their participation on social networking sites such as Facebook continues to grow.
Caution is needed when attempting to generalize the results of this study, conducted at a fully online university, to more conventional postsecondary settings. Regardless, the results of this study may help explain why the retention models of Astin [11] and others, developed almost 20 years ago, do not fill well with current enrollment trends. Social interaction remains a crucial factor for student retention. How college students interact with one another, has changed dramatically in a relatively short time. As educators continue to develop interventions to promote retention, they should pay particular attention to how the institution encourages interaction among its students. In our current wired world, traditional residential postsecondary institutions may need to look to the online institution to better understand how to promote student interaction and increase college retention.
V.
LIMITATIONS AND DIRECTION FOR FUTURE RESEARCH
As with all research conducted at a single institution, the results may not be generalizable to other institutions. As such, this study should be duplicated to assess potential difference between various student populations. Similarly, this study only examined the relationship between the CoI indicators and retention patterns for undergraduate students. In a student of the value students place on the importance of teaching presence indicators, Kupczynski, Ice, Weisenmayer and McCluskey [30], found significant
differences between learners at the associates, undergraduate and graduate levels. It is possible that similar differences could apply to social presence indicators and, in turn, impact retention in a fashion other than was detected in this study.
Though this study demonstrates the significance of social presence indicators on retention, other studies [37, 24] demonstrate the importance of the teaching presence construct on student success, vis-à-vis the establishment of both social and cognitive presence. Research exploring potential indirect influences of teaching presence on retention should be considered to form a better understanding these complex interactions.
In work exploring the impact of technology on student satisfaction, the impact of rich media on student perceptions of increased social presence have been noted [38, 39]. Future research should also explore the influence of media rich programs on retention. From a methodological perspective, there are three limitations that should be considered when reviewing this study. First, though high for online surveys, the response rate for this study (38.91%) may not be representative of all students. Future research should examine whether any inherent self-selection bias occurs based on the type of student who chooses to complete the CoI survey.
Second, this study only examined the influence of CoI indicators on retention. Future studies that include other variables such as age, gender, ethnicity, economic indicators, etc. should be conducted to create more exhaustive models, such as those that exist for face-to-face courses. As the use of dummy variables in regression analysis can produce an exaggerated effect, such research would be important in reinforcing or contextualizing the findings of this study.
VI.
REFERENCES
1. Allen, I. E. and J. Seaman. Online nation: Five years of growth in online learning. Needham, MA: Sloan C, 2008. http://www.sloan-c.org/publications/survey/pdf/online_nation.pdf.
2. U.S. Department of Education. Evaluation of Evidence-Based Practices in Online Learning: A Meta-Analysis and Review of Online Learning Studies. Washington, D.C., 2009.
http://www.ed.gov/rschstat/eval/tech/evidence-based-practices/finalreport.pdf.
3. Bos, N. and N. S. Shami. Adapting a face-to-face role-playing simulation for online play. Educational Technology Research and Development 54(5): 493–521, 2006.
4. Diaz, D. and R. Cartnal. Term length as an indicator of attrition in online learning. Innovate: Journal of Online Education 5(6): 2006.
http://www.innovateonline.info/index.php?view:article&id=196.
5. Rovai, A. P. In search of higher persistence rates in distance education online programs. The Internet and Higher Education 6(1): 1–16, 2003.
6. Willging, P. A. and S. D. Johnson. Factors that influence students’ decision to dropout of online courses. Journal of Asynchronous Learning Networks 8(4): 2–15, 2004.
http://www.sloanconsortium.org/publications/jaln/v8n4/v8n4_willging_member.asp.
7. Patterson, B. and C. McFadden. Attrition in online and campus degree programs. Online Journal of Distance Learning Administration 12(2): 2009.
http://www.westga.edu/~distance/ojdla/summer122/patterson112.html.
8. Thelin, J. R. A history of American higher education. Baltimore: The Johns Hopkins University Press, 2004
9. Braxton, J. M. Reworking the student departure puzzle. Ed. John Braxton. Nashville: Vanderbilt University Press, 2000.
10. Spady, W. Dropouts from higher education: An interdisciplinary review and synthesis. Interchange 1(1): 64–85, 1970.
11. Astin, A. What matters in college: Four critical years revisited. San Francisco: Jossey Bass, 1993. 12. Tinto, V. Dropout from higher education: A theoretical synthesis of recent research. Review of
Educational Research 45(1):89–125, 1975.
13. Tinto, V. Leaving college: Rethinking the causes and cures of student attrition, 2nd ed. Chicago: The University of Chicago Press, 1993.
14. Pascarella, E. College environmental influences on learning and cognitive development: A critical review and synthesis. In Higher Education: Handbook of theory and research, ed. J. Smart, 1–64. New York: Agathon, 1985.
15. Braxton, J. M., A. S. Hirschy and S. A. McClendon. Understanding and reducing college student departure. ASHE-ERIC Higher Education Report 30(3). San Francisco: Jossey-Bass, 2004.
16. Garrison, D. R., T. Anderson and W. Archer. Critical thinking, cognitive presence, and computer conferencing in distance education. American Journal of Distance Education 15(1): 7–23, 2001. 17. Arbaugh, J. B. An empirical verification of the community of inquiry framework. Journal of
Asynchronous Learning Networks 11(1): 73–85, 2007.
18. Garrison, D. R., and J. B. Arbaugh. Researching the community of inquiry framework: Review, issues, and future directions. The Internet and Higher Education 10(3): 157–172, 2007.
19. Arbaugh, J. B., M. Cleveland-Innes, S. R. Diaz, D. R. Garrison, P. Ice, J. C. Richardson and K. P. Swan. Developing a community of inquiry instrument: Testing a measure of the community of inquiry framework using a multi-institutional sample. Internet and Higher Education 11(3–4): 133– 136, 2008.
20. Akyol, Z., B. Arbaugh, M. Cleveland-Innes, R. Garrison, P. Ice, J. Richardson and K. Swan. A response to the review of the Community of Inquiry Framework. Journal of Distance Education 23(2): 123–136, 2009. http://www.jofde.ca/index.php/jde/article/view/630/885.
21. Swan, K. and L. F. Shih. On the nature and development of social presence in online course discussions. Journal of Asynchronous Learning Networks 9(3): 115–136, 2005.
22. Richardson, J. C. and K. Swan. Examining social presence in online courses in relation to students’ perceived learning and satisfaction. Journal of Asynchronous Learning Networks 7(1): 68–88, 2003. 23. Picciano, A. G. Beyond student perceptions: Issues of interaction, presence and performance in an
online course. Journal of Asynchronous Learning Networks 6(1): 2002.
http://www.aln.org/publications/jaln/v6n1/pdf/v6n1_picciano.pdf.
24. Shea, P. and T. Bidjerano. Community of inquiry as a theoretical framework to foster “epistemic engagement” and “cognitive presence” in online education. Computers and Education 52(3): 543– 553, 2009.
25. Coppola, N. W., S. R. Hiltz and N. G. Rotter. Becoming a virtual professor: Pedagogical roles and asynchronous learning networks. Journal of Management Information Systems 18(4): 169–189, 2002. 26. Shea, P., K. Swan, C. S. Li and A. Pickett. Developing learning community in online asynchronous college courses: The role of teaching presence. Journal of Asynchronous Learning Networks 9(4): 59–82, 2005.
27. Swan, K., J. C. Richardson, P. Ice, D. R. Garrison, M. Cleveland-Innes and J. B. Arbaugh. Validating a measurement tool of presence in online communities of inquiry. eMentor 24I(2): 2008. http://www.e-mentor.edu.pl/artykul_v2.php?numer=24&id=543.
28. Ice, P. and J. Richardson. Using the Community of Inquiry Framework survey for multi-level institutional evaluation and continuous quality improvement. http://www.sloan-c.org/node/1931. 29. Cohen, J., P. Cohen, S. West and L. Aiken. Applied multiple regression/correlation analysis for the
behavioral sciences 3rd ed. Mahwah, NJ: Lawrence Erlbaum, 2002.
30. Gunawardena, C. N. Social presence theory and implications for interaction and collaborative learning in computer conferences. International Journal of Educational Telecommunications 1(2/3): 147–166, 1995.
31. Gunawardena, C. N. and F. J. Zittle. Social presence as a predictor of satisfaction within a computer-mediated conferencing environment. The American Journal of Distance Education 11(3): 8–26, 1997.
32. Hostetter, C. and M. Busch. Measuring up online: The relationship between social presence and student learning satisfaction. Journal of Scholarship of Teaching and Learning 6(4): 1–12, 2006. 33. Russo, T. and S. Benson. Learning with invisible others: Perceptions of online presence and
their relationship to cognitive and affective learning. Educational Technology & Society, 8(1): 54–62, 2005.
34. Christophel, D. The relationships among teacher immediacy behaviors, student motivation, and learning. Communication Education 39:323–340, 1990.
35. Liu, S., J. Gomez and C. Yen. Community college online course retention and final grade: Predictability of social presence. Journal of Interactive Online Learning 8(2): 165–182, 2009.
36. Kupczynski, L., P. Ice, R. Weisenmayer and F. McCluskey. Student perceptions of the relationship between indicators of teaching presence and success in online courses. (In Review) 2009.
37. Akyol, Z. and D. R. Garrison. The development of a community of inquiry over time in an online course: Understanding the progression and integration of social, cognitive and teaching presence. Journal of Asynchronous Learning Networks 12(3): 3–22, 2008.
38. Ice. P. The impact of asynchronous audio feedback on teaching, social and cognitive presence. Paper presented at the first international conference of the Canadian Network for Innovation in Education, April 27–30, in Banff, Alberta, Canada, 2008.
39. Ice., P., R. Curtis, P. Phillips and J. Wells. Using asynchronous audio feedback to enhance teaching presence and student sense of community. Journal of Asynchronous Learning Networks 11(2): 3–25, 2007.
VII.
AUTHOR BIOGRAPHIES
Wallace Boston, Jr. was appointed as President and Chief Executive Officer of American Public University System (APUS) and its parent company, American Public Education, Inc. (APEI) in July 2004. He joined APUS in 2002 as its Executive Vice President and Chief Financial Officer. Mr. Boston guided APUS through its successful accreditation with the Higher Learning Commission of the North Central Association in 2006. In 2006, he initiated the institution’s application to be the first totally distance learning university to receive Federal Student Aid after the repeal of the 50/50 rule. In November 2007, Mr. Boston led APEI to an initial public offering on the NASDAQ Exchange and led successful secondary offerings in February and December of 2008. In 2008, the Board of Trustees of APUS awarded him a Doctorate in Business Administration, honoris causa. In his spare time, he is enrolled in a doctoral program in Higher Education Management at the University of Pennsylvania’s Graduate School of Education.
Sebastián R. Díaz, Ph.D., J.D. serves as Assistant Professor in the Department of Technology, Learning & Culture at West Virginia University's College of Human Resources and Education. His research interests include developing measures germane to Intellectual Capital and applying Knowledge Management perspectives to program evaluation. He also serves as President of Diaz Consulting, LLC, a firm that assists organizations in healthcare and education to utilize data-driven methods to guide decision-making, strategic planning, and curriculum development. Sebastián also serves as Mayor of Brandonville, WV.
Angela M. Gibson, Ed.D. is the Instructional Design Project Leader at American Public University System. Her research interests focus on student engagement and retention, the role of technology in
course design and instruction, online learning environments, and adult education. Specific areas of research include instructional and collaborative methods to enhance online transparency and learning, effective characteristics of K-12 teachers, Hispanic student performance on Advanced Placement tests, engagement of first-year and at-risk populations at community colleges and universities, and student success at online institutions.
Phil Ice, Ed.D. is the Director of Course Design, Research and Development at American Public University System. His research is focused on the impact of new and emerging technologies on cognition in online learning environments. Work in this area has brought Dr. Ice international recognition in the form of two Sloan-C effective practices, a Sloan-C Effective Practice of the Year Award – 2007, application of his work at over 50 institutions of higher education in 5 countries, membership in Adobe's Higher Education Leader's Advisory Committee and multiple invited presentations, workshops and book chapters related to the integration of emerging technologies in online courses and the impact on teaching, social and cognitive presence. Examples of his research include the use of embedded asynchronous audio feedback mechanisms, using web 2.0 tools for collaborative construction of knowledge through integration of RIA’s and remote observation of student teaching experiences using asynchronous, flash- based environments.
Jennifer Richardson, Ph.D. is an Associate Professor in the College of Education at Purdue University. Jennifer’s research, which focuses on distance learning, includes social presence, developing a professional development framework for mentoring graduate students to teach online, instructional strategies, and the Community of Inquiry. She has been teaching and doing research in distance education for the past nine years and was a recipient of the Excellence in Distance Teaching Award at Purdue University. Jennifer is the past Chair for the AERA SIG Instructional Technology and past Program Chair for the SIG Media, Culture & Curriculum. Dr. Richardson is currently the PI on a USDOE FIPSE grant that is examining how peer feedback can be utilized to maintain quality online discussions while increasing students' higher-order thinking.
Karen Swan, Ed.D. is the Stukel Distinguished Professor of Educational Leadership at the University of Illinois Springfield. Her research is in the area of media and learning on which she has published and presented extensively. She has authored over 100 publications as well as several hypermedia programs, and co-edited two books on educational technology topics. Her current interests include online learning, ubiquitous computing and data literacy. Dr. Swan has been involved with online teaching and learning for over a decade, both as an instructor and as a researcher. She helped develop one of the first fully online Masters degrees while she was at the University of Albany, is active in the online learning community, and is well known for her research on learning effectiveness in online environments. In 2006, Dr. Swan received the Sloan-C award for Outstanding Achievement in Online Learning by an Individual for her work in this area.
VIII.
APPENDIX A
Community of Inquiry Survey Instrument (draft v15)
Developed by Ben Arbaugh, Marti Cleveland-Innes, Sebastian Diaz, Randy Garrison, Phil Ice, Jennifer Richardson, Peter Shea & Karen Swan
Teaching Presence Design & Organization
2. The instructor clearly communicated important course goals.
3. The instructor provided clear instructions on how to participate in course learning activities. 4. The instructor clearly communicated important due dates/time frames for learning activities. Facilitation
5. The instructor was helpful in identifying areas of agreement and disagreement on course topics that helped me to learn.
6. The instructor was helpful in guiding the class towards understanding course topics in a way that helped me clarify my thinking.
7. The instructor helped to keep course participants engaged and participating in productive dialogue.
8. The instructor helped keep the course participants on task in a way that helped me to learn. 9. The instructor encouraged course participants to explore new concepts in this course.
10. Instructor actions reinforced the development of a sense of community among course participants.
Direct Instruction
11. The instructor helped to focus discussion on relevant issues in a way that helped me to learn. 12. The instructor provided feedback that helped me understand my strengths and weaknesses. 13. The instructor provided feedback in a timely fashion.
Social Presence Affective expression
14. Getting to know other course participants gave me a sense of belonging in the course. 15. I was able to form distinct impressions of some course participants.
16. Online or web-based communication is an excellent medium for social interaction. Open communication
17. I felt comfortable conversing through the online medium. 18. I felt comfortable participating in the course discussions. 19. I felt comfortable interacting with other course participants. Group cohesion
20. I felt comfortable disagreeing with other course participants while still maintaining a sense of trust.
21. I felt that my point of view was acknowledged by other course participants. 22. Online discussions help me to develop a sense of collaboration.
Cognitive Presence Triggering event
23. Problems posed increased my interest in course issues. 24. Course activities piqued my curiosity.
25. I felt motivated to explore content related questions. Exploration
26. I utilized a variety of information sources to explore problems posed in this course.
27. Brainstorming and finding relevant information helped me resolve content related questions. 28. Discussing course content with my classmates was valuable in helping me appreciate
different perspectives. Integration
30. Learning activities helped me construct explanations/solutions.
31. Reflection on course content and discussions helped me understand fundamental concepts in this class.
Resolution
32. I can describe ways to test and apply the knowledge created in this course. 33. I have developed solutions to course problems that can be applied in practice.
34. I can apply the knowledge created in this course to my work or other non-class related activities.
5 point Likert-type scale