1
What can indicators of Good Environmental Status tell us about ecosystem services?: Reducing 1
efforts and increasing cost-effectiveness by reapplying biodiversity indicator data 2
Stefanie Broszeit1, Nicola J. Beaumont1, Maria C. Uyarra2, Anna-Stiina Heiskanen3, Matthew Frost4, 3
Paul J. Somerfield1, Axel G. Rossberg5, Heliana Teixeira6, Melanie C. Austen1 4
1
Plymouth Marine Laboratory, Plymouth, UK 5
2
AZTI, Marine Research Division, Pasaia, Spain 6
3
Finnish Environment Institute, Helsinki, Finland 7
4
Marine Biological Association, Plymouth, UK 8
5
School of Biological and Chemical Sciences, Queen Mary University of London, London, UK 9
6
Department of Biology and CESAM, University of Aveiro, Aveiro, Portugal 10
Keywords: marine ecosystem services, Marine Strategy Framework Directive, marine biodiversity 11
assessment, Biodiversity Strategy, indicators 12
Abbreviations 13
ES: ecosystem services, MSFD: Marine Strategy Framework Directive, GES: good environmental 14
status, EU: European Union, NIS: Non-indigenous species 15
ABSTRACT 16
The EU Marine Strategy Framework Directive (MSFD) requires member states to manage their 17
marine ecosystems with the goal of achieving Good Environmental Status (GES) of all European Seas 18
by 2020. Member states assess GES according to 11 descriptors set out in the MSFD, and their 19
associated indicators. 20
An ecosystem service approach is increasingly being advocated to ensure sustainable use of the 21
environment, and sets of indicators have been defined for ecosystem service assessments. We 22
considered whether a selection of GES indicators related to biological descriptors, D1 Biodiversity, 23
D2 Non-indigenous species, D4 Food webs and D6 Seafloor integrity, may provide information 24
relevant to ecosystem services, potentially allowing use of collected environmental data for more 25
than one purpose. Published lists of indicators for seven selected marine ecosystem services were 26
compared to 296 biodiversity-related indicators included within the DEVOTOOL catalogue, 27
established for screening marine biodiversity indicators for the MSFD. We concluded that 64 of 28
these biodiversity indicators are directly comparable to the ecosystem service indicators under 29
consideration. All 296 biodiversity indicators were then reassessed objectively to decide which of 30
them could be useful as ecosystem service indicators. To carry out this step in a consistent and 31
transparent manner, guidelines were developed among the co-authors that helped the decision 32
2
making process for each individual indicator. 247 biodiversity indicators were identified as 33
potentially useful ecosystem service indicators. By highlighting the comparability between 34
ecosystem service and biodiversity indicators it is hoped that future monitoring effort can be used 35
not only to ensure that GES is attained, but also that ecosystem service provision is maximised. It is 36
recommended that these indicators should be tested across EU regional seas to see if they are useful 37
in practice, and if ecosystem service assessments are comparable across regional seas. 38
39
1.1 INTRODUCTION 40
Biodiversity is closely linked to ecosystem functioning, which in turn underpins the provision of 41
ecosystem services on which humanity depends, such as Food provision and Climate regulation 42
(Heiskanen et al., 2016; Liquete et al., 2016). According to the Convention on Biological Diversity 43
(CBD, 1992), biodiversity is defined as “the variability among living organisms from all sources 44
including, inter alia, terrestrial, marine and other aquatic ecosystems and the ecological complexes 45
of which they are part; this includes diversity within species, between species and of ecosystems”. 46
Yet, biodiversity is threatened worldwide by pressures such as habitat loss, overexploitation and 47
pollution (Halpern et al., 2008; Knights et al., 2013). International environmental agreements, such 48
as the Aichi Biodiversity Targets for 2020 in the Convention of Biological Diversity (CBD, 1992), the 49
EU Biodiversity Strategy 2020 (BD; COM/2011/0244), and recent European Union legislation (e.g. the 50
EU Marine Strategy Framework Directive (MSFD; 2008/56/EC)) are placing increasing emphasis on 51
halting biodiversity loss (Laurila-Pant et al., 2015; Liquete et al., 2016). 52
The MSFD “establishes a framework for community action in the field of marine environmental 53
policy”, which promotes the preservation and protection of marine waters in European member 54
states (European Commission, 2008). One aim of the MSFD is for each member state to take 55
measures to achieve and maintain Good Environmental Status (GES) in all four European Seas (i.e. 56
Baltic Sea, Black Sea, Mediterranean and North East Atlantic) by the year 2020, through country-57
specific programmes of measures (Börger et al., 2016). The MSFD defines GES as: “the 58
environmental status of marine waters where these provide ecologically diverse and dynamic oceans 59
and seas which are clean, healthy and productive within their intrinsic conditions, and the use of the 60
marine environment is at a level that is sustainable, thus safeguarding the potential for uses and 61
activities by current and future generations.” This definition implies that ecosystem services and 62
societal benefits should be taken into consideration when measuring GES but at the same time these 63
aspects are not mentioned in either the descriptors or associated criteria (Borja et al., 2013). 64
Recently, changes were suggested to some elements of the MSFD, including criteria and Annex III, 65
these are now awaiting acceptance. Among these changes is the acknowledgement that member 66
states may also assess ecosystem services under MSFD. These changes demonstrate the importance 67
3
of comparing ecosystem service indicators and biodiversity-related indicators (from now on 68
biodiversity indicators). 69
To assess the status of the seas and to be able to monitor changes in environmental status, each 70
member state has to carry out regular assessments addressing 11 descriptors that describe a state, 71
or a pressure, or both. These are: Descriptor (D) D1 – Biological diversity, D2 – Non-indigenous 72
species (NIS), D3 – Commercial fish and shellfish, D4 – Food webs, D5 – Eutrophication, D6 –Sea floor 73
integrity, D7 – Hydrological conditions, D8 – Concentration of contaminants, D9 – Contaminants in 74
fish and other seafood, D10 – Litter, D11 – Energy and noise. These 11 descriptors are further 75
defined by a set of 29 criteria and 56 indicators. Indicators are variables that provide information on 76
complex phenomena and if properly selected can show changes of such phenomena (Kandziora et 77
al., 2013; Hattam et al., 2015). A requirement of the MSFD is that indicators focus on essential 78
biological components of the ecosystem, from taxonomic groups through habitats to ecosystems 79
(Borja et al., 2014; Berg et al., 2015). Member states considered the different criteria and indicators, 80
and for those of relevance to their seas they defined a series of indicators to be used to describe a 81
baseline, and then in regular monitoring programmes to assess the success of their programmes of 82
measures. 83
The biological components relevant for biodiversity assessments are described by Cochrane et al. 84
(2010), and specifically listed in the Table 1 of the Annex III of the MSFD. The biodiversity 85
components include predominant seabed and water column habitat types, as well as specific 86
habitats that have biodiversity conservation importance. Biological communities associated with 87
those seabed and water column habitats, such as phytoplankton and zooplankton communities, 88
angiosperms, macro‐algae and invertebrate bottom fauna, or species belonging to groups such as 89
fish, marine mammals and reptiles, and seabirds are also included in the biodiversity components. 90
Currently there are a number of operational indicators available for the assessment of GES (Teixeira 91
et al. 2016), and more are being developed to be used in robust and cost-efficient monitoring and 92
assessments (Heiskanen et al., 2016). 93
Besides monitoring the status of marine waters, the MSFD dictates that member states shall adopt 94
an ecosystem-based management approach in their programmes of measures to “enable the 95
sustainable use of marine goods and services” (Paragraph 8 of the MSFD preamble). Ecosystem-96
based management is focused on ecosystems and human interactions within these systems, and 97
thus necessitates an understanding of the linkages within and between the biological components of 98
the ecosystems as well as with social and economic systems (McLeod et al., 2005; Atkins et al., 99
2011). Furthermore, it is stated in the MSFD Article 1, Paragraph 3.: “Marine strategies shall apply an 100
4
ecosystem-based approach to the management of human activities, ensuring that the collective 101
pressure of such activities is kept within levels compatible with the achievement of good 102
environmental status and that the capacity of marine ecosystems to respond to human-induced 103
changes is not compromised, while enabling the sustainable use of marine goods and services by 104
present and future generation”. This anticipates that there is a link between GES and the sustainable 105
use of ecosystem goods and services. Although many of the GES indicators are well described and 106
used by EU member states, there is no operational example describing how these could also be used 107
in the assessment of ecosystem services, although some regional (Hasler et al., 2016) and EU-level 108
(Maes et al., 2016) suggestions have been made. Here we conceptualise ‘sustainable use’ in the 109
sense of ‘weakly sustainable use’ (sensu Rossberg et al., 2017) i.e. usage that can be continued 110
indefinitely in its current form. The key concept to assess status and trends of potential uses of an 111
ecosystem, particularly relevant in local and regional settings, is that of ecosystem services (Maes et 112
al., 2012; O'Higgins and Gilbert, 2014). Ecosystem services are the direct and indirect contributions 113
of ecosystems to human well-being (TEEB, 2010) and are increasingly being considered in marine 114
policy and planning (Fisher et al., 2009; Börger et al., 2014; Pendleton et al., 2016). 115
In the Millennium Ecosystem Assessment (MEA, 2005) ecosystem services were split into four 116
groups: i. provisioning, such as food and timber; ii. regulating, for example regulating climate or 117
water flows; iii. cultural, such as aesthetic experience derived from being in nature; and iv. 118
supporting, for example supply of larval fish (in this example supporting the service of Food 119
provision). This approach was criticised as it did not differentiate between processes and services or 120
services and benefits, potentially leading to double counting (Fisher et al., 2008). Since then several 121
alternative classifications have been proposed (Liquete et al., 2013), including a more hierarchical 122
approach as defined by Fisher et al. (2009) which renamed the supporting services as intermediate 123
services or processes. CICES (Common International Classification of Ecosystem Services) is another 124
classification example, which merges regulating and supporting ecosystem services into a new 125
category of “regulating and maintenance” ecosystem services and also includes a separate 126
framework for abiotic services (Haines-Yong and Potschin, 2013). Within this study, seven ecosystem 127
services (Table 1) were chosen that included examples from the MEA ecosystem service groups. 128
While the scientific literature on ecosystem services continues to grow it is still a challenge to apply 129
this concept in practice (Kandziora et al., 2013). To assess ecosystem services, it is important to 130
understand and quantify the link between biodiversity; i.e. species or communities or traits of 131
species and the flow of services they supply or to which they contribute. However, this challenging 132
task is hampered because biodiversity-ecosystem function relationships are still subject of ongoing 133
5
research, particularly in the marine environment (Liquete et al., 2013; Gamfeldt et al., 2015; Strong 134
et al., 2015). Yet, some biological components of the ecosystem do play clear roles in the provision 135
of ecosystem services (Kandziora et al., 2013). For example, charismatic species attract visitors for 136
ecotourism and therefore contribute to the service of Leisure and Recreation (Uyarra and Côté, 137
2007). In this way ecosystem services can be linked to MSFD biological components. Another 138
example is the invasive macrozoobenthic polychaete genus Marenzelleria which, in the Baltic Sea, 139
enhances retention of phosphorus in sediments and so promotes the Bioremediation of waste 140
service (Norkko et al., 2012). Effects of biodiversity on ecosystem services may be explained by 141
functional traits of species, so identification of “key functional traits,” that have the capacity to 142
influence the provision of multiple ecosystem services, is promising (Hevia et al., 2017). Table 2 lists 143
examples of how each component contributes to the provision of particular ecosystem services. 144
Links between ecosystem components and ecosystem services can help to identify suitable 145
ecosystem service indicators. The biodiversity indicators used to monitor GES could then also be 146
used to assess ecosystem services, providing a cost-effective approach to support the management 147
of regional seas and the services they provide. Several ecosystem service indicator lists have been 148
published although none claims to be complete (Böhnke-Henrichs et al., 2013; Liquete et al., 2013; 149
European Commission, 2014; Atkins et al., 2015; Hattam et al., 2015). Currently there are no 150
accepted operational practise nor guidelines for the development or selection of useful marine 151
ecosystem service indicators (Hattam et al., 2015; Hasler et al., 2016). Therefore, in this study, we 152
have considered the applicability of biodiversity indicators for assessing the seven selected marine 153
ecosystem services, to support the practical application of ecosystem services as a management tool 154
within the framework of the MSFD implementation or other biodiversity assessments. 155
2.1 METHODS 156
2.1.1 Marine ecosystem service indic ators 157
It was deemed efficient to concentrate on a broad selection of ecosystem services rather than all 158
services, because each service indicator had to be cross checked against each biodiversity indicator, 159
which is more manageable with a smaller number of services. This approach resulted in seven 160
ecosystem services being selected for this study (MEA category in brackets): Food provision 161
(provisioning), Climate regulation (regulating), Disturbance prevention and moderation (regulating), 162
Bioremediation of waste (regulating), Biological control (supporting), Leisure and Recreation 163
(cultural) and Aesthetic experience (cultural). Several studies have classified ecosystem services and 164
prepared indicators for marine ecosystem services (Böhnke-Henrichs et al., 2013; Liquete et al., 165
2013; European Commission, 2014; Atkins et al., 2015; Hattam et al., 2015). We selected the three 166
6
most comprehensive descriptions of marine ecosystem services (European Commission, 2014; Atkins 167
et al., 2015; Hattam et al., 2015), and then used these to revise the descriptions of the seven 168
services (Table 1). Published definitions of the Biological control service were particularly difficult to 169
reconcile. Some encompass the concept of resilience, for example through food web dynamics, but 170
also as disease and pest control, but we lack understanding of the connections between resilience 171
and biodiversity, and how such knowledge can be used to inform management (Oliver et al., 2015). 172
Our narrower description of this service therefore focused on pest, disease-bearing and harmful 173
species. The terms nuisance species and pest species are currently used interchangeably in the 174
ecological literature and are mostly aimed at invasive species. Here, by combining definitions of pest 175
(Daily (2003) and nuisance (Hall-Spencer and Allen, 2015) species, we consider pest species to 176
include humanity’s competitors for food and other natural products and any other organisms that 177
have undesirable effects from a human perspective, including invasive and native organisms, 178
harmful algal blooms, opportunistic macro-algal blooms, and jellyfish swarms. We collated the three 179
indicator lists into one, as examples of published ecosystem service indicators (Appendix 1). This 180
provided a concise selection of published indicators that were well described in the respective 181
sources, giving us information on metrics and units for each. 182
2.1.2 Comparability of biodiversity and ecosystem service indicators 183
The MSFD-relevant biodiversity indicators were taken from the freely available software DEVOTOOL 184
(Version 0.64, http://www.devotes-project.eu/devotool/). DEVOTOOL provides a catalogue of 185
biodiversity indicators from a wide range of countries, including some non-EU countries. The 186
database focuses on indicators of the following descriptors: D1 Biodiversity, D2 Non-Indigenous 187
Species, D4 Food webs and D6 Seafloor integrity (Teixeira et al., 2016). For each indicator, 188
information is provided on data requirements, geographical coverage, relevance to habitats and 189
biodiversity components as well as human pressures (Teixeira et al., 2016). At the time of access 190
(09/06/2015, database version 6), 558 indicators were catalogued, of which 292 were operational, 191
200 under development, 46 conceptual and for 30 no status was given. Only the operational 192
indicators for the biodiversity descriptors (D1, D2, D4 and D6) were included in this analysis. 193
Firstly, the published ecosystem service indicators were compared to the biodiversity indicators, to 194
assess which of the latter are suitable for ecosystem service assessment. Biodiversity indicators had 195
to fit the descriptions and metrics as well as units of published ecosystem service indicators to be 196
selected. This assessment revealed that there is only a small overlap between the biodiversity and 197
ecosystem services indicators and, as a result, information that is collected in biodiversity 198
assessment may be not be directly used for ecosystem service assessment using published 199
7
indicators. Yet, the biodiversity indicators may provide useful information on ecosystem services in 200
addition to biodiversity status. For example, biodiversity indicators of distributional ranges of fish 201
and top predators can also provide information on the ecosystem services of Food provision and 202
Leisure and recreation. 203
2.1.3 Evaluation of biodiversity indicators for ecosystem service indicators 204
Further investigation was undertaken to determine whether biodiversity indicators could be useful 205
for ecosystem service assessment. To be useful as an ecosystem service indicator, a biodiversity 206
indicator has to link to a service in a direct and plausible manner. For example, phytoplankton 207
biomass is not deemed suitable as an indicator for Food provision because, while phytoplankton is at 208
the base of the food chain, and therefore important for Food provision, humans do not consume 209
phytoplankton directly rendering it less useful in direct ecosystem service assessment. According to 210
the MEA (2005), primary production would be a supporting service and phytoplankton biomass 211
could be deemed in the same way as it has only an indirect impact on people (Liquete et al., 2016). 212
Guidelines were developed to evaluate if biodiversity indicators are useful for ecosystem service 213
assessment (Table 3). Using these rationales, we considered each of the biodiversity indicators to 214
assess its potential in ecosystem service assessments. 215
216
3.1 RESULTS 217
3.1.1 Comparability of biodiversity and ecosystem service indicators 218
In total, of the 296 operational DEVOTOOL indicators, 64 were directly comparable to published 219
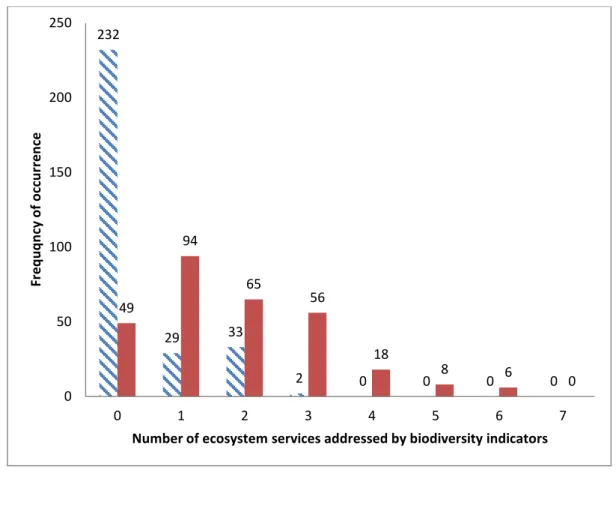
ecosystem service indicators while 232 indicators were not (Figure 1). Twenty indicators were useful 220
for Food provision. Climate regulation could be measured with two indicators, Disturbance 221
prevention with one, Bioremediation with eight and Biological control with eleven. Biodiversity 222
indicators were most applicable for cultural services Leisure and recreation (35) and Aesthetic 223
experience (30). Of those indicators that were directly comparable to ecosystem service indicators, 224
29 could be used for one ecosystem service only, 33 could provide information for two ecosystem 225
services owing to similar data requirements, while two biodiversity indicators provided information 226
on three different ecosystem services (Figure 1, Appendix 2). 227
3.1.2 Evaluation of all biodiversity indicators for ecosystem service assessments 228
Rationales were established to assess the relevance of biodiversity indicators for ecosystem service 229
assessments in a consistent and plausible manner (Table 3). For example, while there is agreement 230
8
in the ecological literature that zooplankton and fauna in general take up carbon, there is not 231
enough evidence to show that this take-up leads to improved Climate regulation because organisms 232
also respire carbon dioxide and may not remove any of it from the system (Legendre and Michaud, 233
1998; Turley et al., 2010). Therefore, indicators such as biomass of zooplankton or other faunal 234
groups were rejected as indicators for Climate regulation. 235
Of the 296 GES indicators assessed using these rationales, 49 were found not to be useful for 236
ecosystem services assessment, while 247 were considered suitable. Of these, 18 indicators 237
additional to those already published could be used for Food provision, 36 for Climate regulation, 27 238
for Disturbance prevention, 35 for Bioremediation of waste, 12 for Biological checks and balances, 239
66 for Leisure and recreation as well as 50 for Aesthetic experience. Ninety-four biodiversity 240
indicators were useful for one ecosystem service while 163 could be useful for two or more 241
ecosystem services (Figure 1, Appendix 2). Multimetric indicators were often rejected as the 242
integration of several types or sources of information made their interpretation in relation to 243
ecosystem services rather complex; nevertheless, it is recognized that the datasets necessary to 244
calculate these could contain useful information for ecosystem services assessment. 245
246
4.1 Discussion 247
This paper identifies potential indicators for seven selected ecosystem services from a list of 248
biodiversity indicators prepared for the GES assessment of the MSFD. Ecosystem services are 249
generated from many interactions in complex systems and not all links between ecosystem 250
components and ecosystem services are fully understood (Balvanera et al., 2013; Liquete et al., 251
2016). For some services the role of the contributing components is clear. For others, relationships 252
between ecosystem components and services (examples provided in Table 2) can help to 253
conceptualise the links and to identify indicators for such services. This can also help with defining 254
rationales for accepting or rejecting indicators as being useful for ecosystem service assessment. 255
Combining three lists of published ecosystem service indicators showed that they complemented 256
each other well in terms of information on indicators. It also showed that each ecosystem service 257
needs several indicators to be measured effectively, as has also been demonstrated by Atkins et al. 258
(2015). For instance, for Food provision, abundance or biomass of edible species is important but so 259
is the quality of fish and shellfish stocks, and so indicators such as the length profile of a fish 260
community (abundance/biomass of large fish versus small fish) are insufficient on their own to 261
measure service provision. 262
9
The comparison of biodiversity indicators for MSFD GES assessment with published indicators for 263
ecosystem service assessment showed that there was little overlap of the conceptual approaches 264
underpinning these assessments (Figure 1). However, biodiversity indicators do provide valuable 265
information on ecosystem services, and the indicator lists could be updated to include biodiversity 266
indicators identified as useful in this study. For the taxa and components for which links between 267
their environmental status and ecosystem services are clear, the indicators used to assess GES of 268
such components could also be used as ecosystem service indicators. For example, the abundance 269
and distribution of marine mammals could be a useful indicator of the ecosystem service of Leisure 270
and Recreation but further information such as proximity to the shore would be needed to assess if 271
marine mammals could be watched from the shore or from small boats. Further ecological and 272
ecosystem service research could advance our understanding of relationships between components 273
and ecosystem services. For instance, a better comprehension of the key species, and functional 274
traits, and habitats involved in services such as Bioremediation of waste or Biological control would 275
improve the choices of indicators as well as management measures to keep this service sustainable. 276
Such species and habitats will differ regionally. For example, one ecosystem service indicator for 277
Biological control is ‘Quality of pest control species’, but pest species and the species that control 278
them will differ regionally and this should be taken into consideration in each study area. 279
The application of functional traits in ecosystem services assessment may be a promising way 280
forward, linking biodiversity to ecosystem services (Hevia et al., 2017 and references therein). This 281
would enable connection between ecosystem structure and functioning and ecosystem services. 282
However, there is lack of biological trait data to derive ecological indicators, as those are not 283
currently included in marine monitoring (Beauchard et al., 2017). To date trait-based indicators are 284
rarely used in marine systems (Teixeira et al., 2016) and were thus excluded from this analysis. 285
Other biodiversity indicators are only useful if target species (or functional trait) data are measured 286
and can be extracted from available data sets. ‘Biomass of zooplankton’ may be useful for Leisure 287
and Recreation if data on jellyfish blooms can be extracted, as jellyfish blooms may have a negative 288
effect on beach goers. Some biodiversity indicators may inform us of potential declines in services. 289
For example ‘Areal extent of opportunistic macroalgae’ can indicate a reduction in the Leisure and 290
recreation service if rotting mats of macroalgae cover beaches. Similarly, ’Extent of dead seagrass 291
beds’ is an indicator of reduced Climate regulation as dead or degraded seagrass beds no longer 292
sequester carbon at the same rate or, even worse, can turn from a carbon sink to a carbon source 293
(Pendleton et al., 2012; Macreadie et al., 2014). 294
10
Several multimetric indices are listed in DEVOTOOL. Many of these have been developed for the 295
Water Framework Directive and some are applied to derive Ecological Quality Ratios for the 296
assessment of the ecological status of surface waters. The principles of the development of 297
multimetric indices and their use in the ecological assessments are summarized by Hering et al. 298
(2006). They are also proposed, and in some cases adapted, for use in assessing GES. Some 299
multimetric indices integrate several ecological and biological parameters reflecting the status of a 300
biological community or Water Framework Directive ‘quality element’. They are used to assess of 301
the current status of the biological community addressing different stressors or different ecological 302
or biological components (Hering et al., 2006). The combination of several parameters or several 303
functional groups into a single index or series of indices using simple to complex statistics hinders 304
the assessment of the link between ecosystem processes or components and the services they 305
provide, particularly if the index is unit-less and/or a ratio. These indices were therefore largely 306
rejected as being unsuitable for assessment of ecosystem services. An exception was made for 307
benthic diversity indices which can be useful for Bioremediation of waste regarding diversity as an 308
index and this is in agreement with Atkins et al. (2015) and Hattam et al. (2015). Higher diversity may 309
indicate that functioning Bioremediation of waste is taking place although further studies are 310
needed to confirm this. There may also be potential for their usefulness for ecosystem service 311
bundles (sets of ecosystem services that repeatedly appear together across time and space 312
(Raudsepp-Hearne et al., 2010), though to assess this was beyond the scope of this study. 313
For two services, Bioremediation of waste and Biological control, it was difficult to identify suitable 314
indicators. For both services, the absence of pollutants or nuisance species can indicate a functioning 315
service but it can also simply indicate the lack of pollutants or nuisance species in the first place, 316
making these services difficult to define. Also, in the case of Bioremediation of waste, it is difficult to 317
assess at which level the service fails if there is a lot of pollution. The service may still be there and 318
functioning but be overwhelmed by the amount of pollutants in the environment (for example in an 319
industrial harbour). In that case, pollution levels would be high even though the ecosystem service is 320
functioning and working at high level and rate. The same problem can occur in Biological control and 321
the indicator “Trends in arrival of non-indigenous species (NIS)” is a good example of this problem. If 322
there are no pathways for NIS to arrive then this indicator would appear to demonstrate a 323
functioning service while, in reality, there simply are no NIS arriving but if NIS do arrive, the 324
ecosystem may not be able to cope with their numbers if the service was so far not “used”. 325
Therefore, an additional indicator that would show the degree of pressure from a particular NIS 326
would be necessary to then demonstrate that the service is working. 327
11 4.2 Limitations of this assessment
328
Here, a list of new ecosystem service indicators based on biodiversity indicators is suggested. Our 329
assessment was based on expert judgement rather than quantifiable criteria. To help overcome this 330
limitation, rationales were created to reduce the subjectivity of the expert judgement approach. 331
The practical application of these indicators for ecosystem services assessment now needs to be 332
tested using actual data. Ideally, this could be done in regional studies comparing ecosystem service 333
assessment results across regional seas based on these indicators. It should be combined with 334
evaluation of the general applicability of the rationales for selecting indicators for ecosystem service 335
assessment. Indicators should be gauged as being useful if they show policy-relevance and sensitivity 336
to changes within policy-relevant time frames. Additionally, this study did not look for appropriate 337
target ranges for each indicator that would provide useful information on potential changes to the 338
ecosystem. Target setting for ecosystem service indicators should be related to the sustainability 339
definition of the resource in questions taking ecological, economic and social sustainability into 340
account (e.g. Rossberg et al., 2017). 341
This study concentrated on biodiversity indicators for D1, D2, D4 and D6, which were the focus of 342
the DEVOTOOL catalogue, on which we based our research. Indicators for other descriptors could 343
also provide information on ecosystem services and should be considered for ecosystem service 344
assessments. For instance, D3 (Commercial fish and shellfish stocks) is solely concerned with 345
commercial species and therefore D3 indicators would clearly provide much information that is 346
useful to assess Food provision and other services such as Biological control and Leisure and 347
Recreation. Other examples are indicators for D8 (Concentration of contaminants) and D9 348
(Contaminants in fish and other seafood) which may be more informative for Bioremediation of 349
waste and Food provision than the indicators addressed here, but such indicators were not included 350
in this study. 351
A large number of contributors added indicators to DEVOTOOL and this led to some limitations in 352
the catalogue (Teixeira et al., 2016). Chiefly these were: heterogeneity in the amount and type of 353
information reported for each indicator, some indicator titles occur multiple times, not all fields 354
were filled in correctly and some were left with gaps. Although they were addressed as far as 355
possible by Teixeira et al. (2016), these limitations also led to issues in this assessment of indicators 356
for ecosystem services. One problem was that not enough information was given on all indicators 357
found in DEVOTOOL to be able to readily understand the information that would be collected and 358
hence its relevance to ecosystem services. Although some indicators have a similar or even the same 359
12
title, the underlying data requirements may differ amongst indicators, therefore all indicators were 360
assessed in this study. 361
4.3 Recommendations and conclusion 362
Managing the marine environment of the European Union in a sustainable manner is a key aim of 363
the MSFD (Borja et al., 2013). Ecosystem services are a useful management tool to complement 364
traditional conservation measures (Luck et al., 2009; Maes et al., 2012). Therefore applying data 365
which were originally collected to carry out biodiversity assessments for ecosystem service 366
assessments would be a cost-effective way to facilitate management of the EU seas within an 367
ecosystem service framework. Data for further ecosystem service indicators would be needed 368
because not all biodiversity indicators can be connected with ecosystem service indicators. This 369
study demonstrates that the majority of biodiversity indicators could also be useful for ecosystem 370
service assessment. To help member states identify which biodiversity indicators are useful for the 371
selected seven ecosystem services, appendix 2 of this study has been incorporated into DEVOTOOL 372
Version 8 (http://www.devotes-project.eu/devotool/). 373
Although acknowledging the value that information on GES has for the assessment of ecosystem 374
services, this study also highlights the need to refine available biodiversity indicators for the 375
measurement of ecosystem services, recognising they are often too imprecise. This is in line with 376
other authors that have shown the importance of the specificity of indicators, particularly within 377
complex causal-link frameworks with many stages (e.g. Böhnke-Henrichs et al., 2013; Hattam et al., 378
2015). Furthermore, the choice of indicators should attend to the context of the assessment, 379
including whether there is a requirement for both, GES and ecosystem service assessment (Hooper 380
et al., 2014; Liquete et al., 2016). 381
Internationally, it is up to individual EU member states and other countries to choose biodiversity 382
and ecosystem service indicators as needed. However, a systematic approach to assess biodiversity 383
and how that relates to the status of ecosystem services would support coherent mapping and 384
assessment of ecosystem services , as required by e.g. the EU Biodiversity Strategy 2020 (Maes et al., 385
2016). That way, across a regional sea, data can be compared and management aligned more 386
effectively. This would also help fulfil the requirement of the MSFD for member states to “ensure 387
the coordinated development of marine strategies for each marine region or subregion” due to the 388
transboundary nature of the marine environment (MSFD, Article 13). Using these indicators for 389
ecosystem services where appropriate on a global scale will also allow development of robust and 390
comparable ecosystem service assessments worldwide which would also help achieve a convergence 391
13
of theoretical and practical approaches to ecosystem service management. The approach 392
demonstrated here could now be extended to all ecosystem services because we have shown in this 393
study that an objective approach can be used. 394
395
Acknowledgements 396
Torsten Berg helped with some data extraction from DEVOTOOL and advised on technical issues and 397
Susanna Jernberg helped to evaluate linkages of some Baltic Sea indicators with ecosystem services. 398
The authors would also like to acknowledge DEVOTES (DEVelopment Of innovative Tools for under-399
standing marine biodiversity and assessing good Environmental Status) project funded by the 400
European Union under the 7th Framework Program, ‘The Ocean for Tomorrow’ Theme (grant 401
agreement no. 308392, www.devotes-project.eu). This work was supported by the Natural 402
Environment Research Council and Department for Environment, Food and Rural Affairs [grant 403
number NE/L003279/1, Marine Ecosystems Research Programme]. María C. Uyarra is partially 404
funded through the Spanish programme for Talent and Employability in R+D+I “Torres Quevedo”, 405
and Anna-Stiina Heiskanen received partial funding from the BONUS COCOA (Nutrient COcktails in 406
COAstal zones of the Baltic Sea) project, funded jointly by the EU and the Academy of Finland. 407
References 408
409
Atkins, J.P., Burdon, D., Elliott, M., 2015. Chapter 5: Identification of a practicable set of indicators 410
for coastal and marine ecosystem services. , in: Turner, R.K., Schaafsma, M. (Eds.), Coastal 411
zones ecosystem services: from science to values and decision making. Springer, 412
Switzerland. 413
Atkins, J.P., Burdon, D., Elliott, M., Gregory, A.J., 2011. Management of the marine environment: 414
Integrating ecosystem services and societal benefits with the DPSIR framework in a systems 415
approach. Marine Pollution Bulletin 62, 215-226. 416
Balvanera, P., Siddique, I., Dee, L., Paquette, A., Isbell, F., Gonzalez, A., Byrnes, J., O’Connor, M.I., 417
Hungate, B.A., Griffin, J.N., 2013. Linking biodiversity and ecosystem services: current 418
uncertainties and the necessary next steps. BioScience, bit003. 419
Beauchard, O., Veríssimo, H., Queirós, A.M., Herman, P.M.J., 2017. The use of multiple biological 420
traits in marine community ecology and its potential in ecological indicator development. 421
Ecological Indicators 76, 81-96. 422
Beaugrand, G., Edwards, M., Legendre, L., 2010. Marine biodiversity, ecosystem functioning, and 423
carbon cycles. Proceedings of the National Academy of Sciences 107, 10120-10124. 424
Berg, T., Fürhaupter, K., Teixeira, H., Uusitalo, L., Zampoukas, N., 2015. The Marine Strategy 425
Framework Directive and the ecosystem-based approach – pitfalls and solutions. Marine 426
Pollution Bulletin. 427
Böhnke-Henrichs, A., Baulcomb, C., Koss, R., Hussain, S.S., de Groot, R.S., 2013. Typology and 428
indicators of ecosystem services for marine spatial planning and management. J. Environ. 429
Manage. 130, 135-145. 430
14
Börger, T., Beaumont, N.J., Pendleton, L., Boyle, K.J., Cooper, P., Fletcher, S., Haab, T., Hanemann, 431
M., Hooper, T.L., Hussain, S.S., Portela, R., Stithou, M., Stockill, J., Taylor, T., Austen, M.C., 432
2014. Incorporating ecosystem services in marine planning: The role of valuation. Marine 433
Policy 46, 161-170. 434
Börger, T., Broszeit, S., Ahtiainen, H., Atkins, J., Burdon, D., Luisetti, T., Murillas, A., Oinonen, S., 435
Paltriguera, L., Roberts, L., Uyarra, M., Austen, M., 2016. Assessing costs and benefits of 436
measures to achieve Good Environmental Status in European regional seas: Challenges, 437
opportunities and lessons learnt. Frontiers in Marine Science 3. 438
Borja, A., Elliott, M., Andersen, J.H., Cardoso, A.C., Carstensen, J., Ferreira, J.G., Heiskanen, A.-S., 439
Marques, J.C., Neto, J.M., Teixeira, H., 2013. Good Environmental Status of marine 440
ecosystems: What is it and how do we know when we have attained it? Marine Pollution 441
Bulletin 76, 16-27. 442
Borja, A., Prins, T., Simboura, N., Andersen, J.H., Berg, T., Marques, J.C., Neto, J.M., Papadopoulou, 443
N., Reker, J., Teixeira, H., Uusitalo, L., 2014. Tales from a thousand and one ways to integrate 444
marine ecosystem components when assessing the environmental status. Frontiers in 445
Marine Science 1. 446
Cochrane, S., Connor, D., Nilsson, P., Mitchell, I., Reker, J., Franco, J., Valavanis, V., Moncheva, S., 447
Ekebom, J., Nygaard, K., 2010. Marine Strategy Framework Directive–Task Group 1 Report 448
Biological Diversity, Office for Official Publications of the European Communities, EUR, p. 449
110. 450
Daily, G., 2003. What are ecosystem services? Rowman & Littlefield Publishers. 451
Davenport, J., Davenport, J.L., 2006. The impact of tourism and personal leisure transport on coastal 452
environments: a review. Estuarine, Coastal and Shelf Science 67, 280-292. 453
European Commission, 2008. Marine Strategy Framework Directive: Directive 2008/56/EC of the 454
European Parliament and of the Council of 17 June 2008 establishing a framework for 455
community action in the field of marine environmental policy, MSFD, pp. 19-40. 456
European Commission, 2014. Mapping and Assessment of Ecosystems and their Services. 457
Fisher, B., Turner, K., Zylstra, M., Brouwer, R., Groot, R.d., Farber, S., Ferraro, P., Green, R., Hadley, 458
D., Harlow, J., 2008. Ecosystem services and economic theory: integration for policy-relevant 459
research. Ecological Applications 18, 2050-2067. 460
Fisher, B., Turner, R.K., Morling, P., 2009. Defining and classifying ecosystem services for decision 461
making. Ecological Economics 68, 643-653. 462
Gamfeldt, L., Lefcheck, J.S., Byrnes, J.E., Cardinale, B.J., Duffy, J.E., Griffin, J.N., 2015. Marine 463
biodiversity and ecosystem functioning: what's known and what's next? Oikos 124, 252-265. 464
Haines-Yong, R., Potschin, M., 2013. CICES V4.3 – Revised report prepared following consultation on 465
CICES Version 4, August-December 2012. EAA. 466
Hall-Spencer, J., Allen, R., 2015. The impact of CO2 emissions on “nuisance” marine species. Res. Rep. 467
Biodivers. Stud 33, 33-46. 468
Hall, S.J., Collie, J.S., Duplisea, D.E., Jennings, S., Bravington, M., Link, J., 2006. A length-based 469
multispecies model for evaluating community responses to fishing. Can. J. Fish. Aquat. Sci. 470
63, 1344-1359. 471
Halpern, B.S., Walbridge, S., Selkoe, K.A., Kappel, C.V., Micheli, F., D'Agrosa, C., Bruno, J.F., Casey, 472
K.S., Ebert, C., Fox, H.E., 2008. A global map of human impact on marine ecosystems. Science 473
319, 948-952. 474
Hasler, B., Ahtiainen, H., Hasselström, L., Heiskanen, A.-S., Soutukorva, Å., Martinsen, L., 2016. 475
Marine Ecosystem Services: Marine ecosystem services in Nordic marine waters and the 476
Baltic Sea–possibilities for valuation. Nordic Council of Ministers. 477
Hattam, C., Atkins, J.P., Beaumont, N., Bӧrger, T., Bӧhnke-Henrichs, A., Burdon, D., de Groot, R., 478
Hoefnagel, E., Nunes, P.A., Piwowarczyk, J., 2015. Marine ecosystem services: Linking 479
indicators to their classification. Ecological Indicators 49, 61-75. 480
15
Heiskanen, A.-S., Berg, T., Uusitalo, L., Teixeira, H., Bruhn, A., Krause-Jensen, D., Lynam, C.P., 481
Rossberg, A.G., Korpinen, S., Uyarra, M.C., Borja, A., 2016. Biodiversity in Marine 482
Ecosystems—European Developments toward Robust Assessments. Frontiers in Marine 483
Science 3. 484
Hering, D., Feld, C.K., Moog, O., Ofenböck, T., 2006. Cook book for the development of a Multimetric 485
Index for biological condition of aquatic ecosystems: experiences from the European AQEM 486
and STAR projects and related initiatives. Hydrobiologia 566, 311-324. 487
Hevia, V., Martín‐López, B., Palomo, S., García‐Llorente, M., Bello, F., González, J.A., 2017. Trait‐ 488
based approaches to analyze links between the drivers of change and ecosystem services: 489
Synthesizing existing evidence and future challenges. Ecology and Evolution. 490
Hooper, T., Cooper, P., Hunt, A., Austen, M., 2014. A methodology for the assessment of local-scale 491
changes in marine environmental benefits and its application. Ecosystem Services 8, 65-74. 492
Kandziora, M., Burkhard, B., Müller, F., 2013. Interactions of ecosystem properties, ecosystem 493
integrity and ecosystem service indicators—A theoretical matrix exercise. Ecological 494
Indicators 28, 54-78. 495
Knights, A.M., Koss, R.S., Robinson, L.A., 2013. Identifying common pressure pathways from a 496
complex network of human activities to support ecosystem-based management. Ecological 497
Applications 23, 755-765. 498
Laurila-Pant, M., Lehikoinen, A., Uusitalo, L., Venesjärvi, R., 2015. How to value biodiversity in 499
environmental management? Ecological Indicators 55, 1-11. 500
Legendre, L., Michaud, J., 1998. Flux of biogenic carbon in oceans: size-dependent regulation by 501
pelagic food webs. Marine Ecology Progress Series 164, 1-11. 502
Liquete, C., Cid, N., Lanzanova, D., Grizzetti, B., Reynaud, A., 2016. Perspectives on the link between 503
ecosystem services and biodiversity: The assessment of the nursery function. Ecological 504
Indicators 63, 249-257. 505
Liquete, C., Piroddi, C., Drakou, E.G., Gurney, L., Katsanevakis, S., Charef, A., Egoh, B., 2013. Current 506
status and future prospects for the assessment of marine and coastal ecosystem services: a 507
systematic review. PloS one 8, e67737. 508
Luck, G.W., Harrington, R., Harrison, P.A., Kremen, C., Berry, P.M., Bugter, R., Dawson, T.P., de Bello, 509
F., Díaz, S., Feld, C.K., Haslett, J.R., Hering, D., Kontogianni, A., Lavorel, S., Rounsevell, M., 510
Samways, M.J., Sandin, L., Settele, J., Sykes, M.T., van den Hove, S., Vandewalle, M., Zobel, 511
M., 2009. Quantifying the Contribution of Organisms to the Provision of Ecosystem Services. 512
Bioscience 59, 223-235. 513
Macreadie, P.I., Baird, M.E., Trevathan-Tackett, S.M., Larkum, A.W.D., Ralph, P.J., 2014. Quantifying 514
and modelling the carbon sequestration capacity of seagrass meadows – A critical 515
assessment. Marine Pollution Bulletin 83, 430-439. 516
Maes, J., Liquete, C., Teller, A., Erhard, M., Paracchini, M.L., Barredo, J.I., Grizzetti, B., Cardoso, A., 517
Somma, F., Petersen, J.-E., Meiner, A., Gelabert, E.R., Zal, N., Kristensen, P., Bastrup-Birk, A., 518
Biala, K., Piroddi, C., Egoh, B., Degeorges, P., Fiorina, C., Santos-Martín, F., Naruševičius, V., 519
Verboven, J., Pereira, H.M., Bengtsson, J., Gocheva, K., Marta-Pedroso, C., Snäll, T., Estreguil, 520
C., San-Miguel-Ayanz, J., Pérez-Soba, M., Grêt-Regamey, A., Lillebø, A.I., Malak, D.A., Condé, 521
S., Moen, J., Czúcz, B., Drakou, E.G., Zulian, G., Lavalle, C., 2016. An indicator framework for 522
assessing ecosystem services in support of the EU Biodiversity Strategy to 2020. Ecosystem 523
Services 17, 14-23. 524
Maes, J., Paracchini, M.L., Zulian, G., Dunbar, M.B., Alkemade, R., 2012. Synergies and trade-offs 525
between ecosystem service supply, biodiversity, and habitat conservation status in Europe. 526
Biological Conservation 155, 1-12. 527
McLeod, K., Lubchenco, J., Palumbi, S., Rosenberg, A., 2005. Scientific consensus statement on 528
marine ecosystem-based management, Signed by 221, pp. 1-21. 529
MEA, 2005. Millennium Ecosystem Assessment - Ecosystems and human well-being. Island Press 530
Washington, DC. 531
16
Norkko, J., Reed, D.C., Timmermann, K., Norkko, A., Gustafsson, B.G., Bonsdorff, E., Slomp, C.P., 532
Carstensen, J., Conley, D.J., 2012. A welcome can of worms? Hypoxia mitigation by an 533
invasive species. Global Change Biology 18, 422-434. 534
O'Higgins, T.G., Gilbert, A.J., 2014. Embedding ecosystem services into the Marine Strategy 535
Framework Directive: Illustrated by eutrophication in the North Sea. Estuarine, Coastal and 536
Shelf Science 140, 146-152. 537
Oliver, T.H., Heard, M.S., Isaac, N.J.B., Roy, D.B., Procter, D., Eigenbrod, F., Freckleton, R., Hector, A., 538
Orme, C.D.L., Petchey, O.L., Proença, V., Raffaelli, D., Suttle, K.B., Mace, G.M., Martín-López, 539
B., Woodcock, B.A., Bullock, J.M., 2015. Biodiversity and Resilience of Ecosystem Functions. 540
Trends in ecology and evolution. 541
Pendleton, L., Donato, D.C., Murray, B.C., Crooks, S., Jenkins, W.A., Sifleet, S., Craft, C., Fourqurean, 542
J.W., Kauffman, J.B., Marbà, N., 2012. Estimating global “blue carbon” emissions from 543
conversion and degradation of vegetated coastal ecosystems. PloS one 7, e43542. 544
Pendleton, L.H., Thébaud, O., Mongruel, R.C., Levrel, H., 2016. Has the value of global marine and 545
coastal ecosystem services changed? Marine Policy 64, 156-158. 546
Raudsepp-Hearne, C., Peterson, G.D., Bennett, E.M., 2010. Ecosystem service bundles for analyzing 547
tradeoffs in diverse landscapes. Proceedings of the National Academy of Sciences 107, 5242-548
5247. 549
Rossberg, A.G., Uusitalo, L., Berg, T., Zaiko, A., Chenuil, A., Uyarra, M.C., Borja, A., Lynam, C.P., 2017. 550
Quantitative criteria for choosing targets and indicators for sustainable use of ecosystems. 551
Ecological Indicators 72, 215-224. 552
Strong, J.A., Andonegi, E., Bizsel, K.C., Danovaro, R., Elliott, M., Franco, A., Garces, E., Little, S., Mazik, 553
K., Moncheva, S., 2015. Marine biodiversity and ecosystem function relationships: The 554
potential for practical monitoring applications. Estuarine, Coastal and Shelf Science. 555
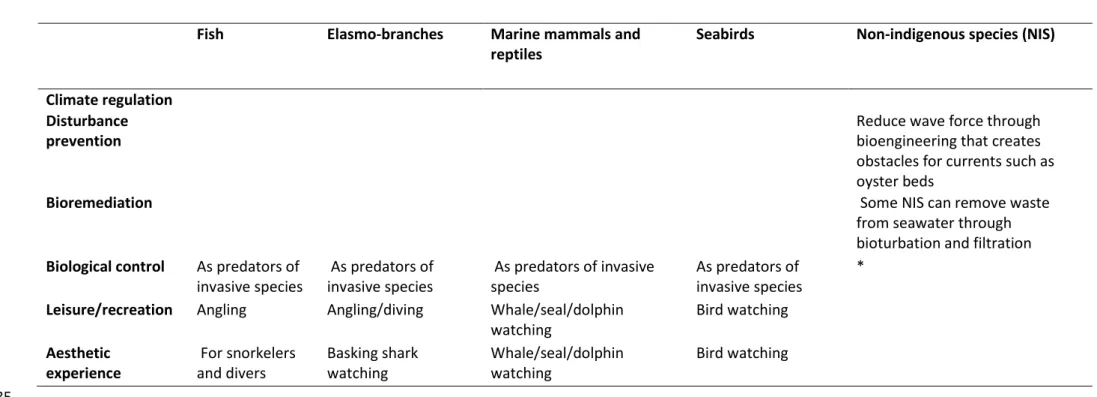
TEEB, 2010. The Economics of Ecosystems and Biodiversity Ecological and Economic Foundations. 556
Earthscan, London and Washington. 557
Teixeira, H., Berg, T., Uusitalo, L., Fürhaupter, K., Heiskanen, A.-S., Mazik, K., Lynam, C., Neville, S., 558
Rodriguez, J.G., Papadopoulou, N., Moncheva, S., Churilova, T., Krivenko, O., Krause-Jensen, 559
D., Zaiko, A., Verissimo, H., PANTAZI, M., Carvalho, S., Patrício, J., Uyarra, M., Borja, A., 2016. 560
A Catalogue of marine biodiversity indicators. Frontiers in Marine Science 3. 561
Turley, C., Blackford, J., Hardman-Mountford, N., Litt, E., Llewellyn, C., Lowe, D., Miller, P., 562
Nightingale, P., Rees, A., Smyth, T., 2010. Carbon uptake, transport and storage by oceans 563
and the consequences of change. Issues in Environmental Science and Technology 29, 240. 564
Uyarra, M.C., Côté, I.M., 2007. The quest for cryptic creatures: impacts of species-focused 565
recreational diving on corals. Biological Conservation 136, 77-84. 566
Watson, S.C.L., Paterson, D.M., Queirós, A.M., Rees, A.P., Stephens, N., Widdicombe, S., Beaumont, 567
N.J., 2016. A conceptual framework for assessing the ecosystem service of waste 568
remediation: In the marine environment. Ecosystem Services 20, 69-81. 569
570
Tables, Figures and Appendices - Headings 571
Table 1: Descriptions of the seven ecosystem services addressed in this study, adapted from: 572
Böhnke-Henrichs et al. (2013), European Commission (2014), Atkins et al. (2015) and Hattam et al. 573
(2015) 574
Table 2: 575
17 service
Food provision The availability of marine flora and fauna for human consumption that can be caught from the wild
Climate regulation
The contribution of the marine environment to the maintenance of a favourable climate
Disturbance prevention or moderation
The dampening of the intensity of environmental disturbances such as storm floods, tsunamis and hurricanes and including the prevention of coastal erosion
Bioremediation of waste
The removal of waste input from humans into the marine environment, e.g. excess nutrients, and chemicals, as well as hazardous substances
Biological control
Control of pest species such as sea lice, invasive species, harmful algal blooms, blooming macro-algae, disease bearers such as Escherichia coli
Leisure, recreation
The provision of opportunities for tourism, recreation and leisure that depend on a particular state of marine ecosystems, in particular abundance of charismatic species, species targeted by anglers, species and habitats visited by snorkelers and divers, also water is of sufficient quality to serve as bathing water
Aesthetic experience
The contribution of the marine environment to the existence of a seascape that generates a noticeable emotional response within an individual observer 576
Table 2: Biodiversity components (species and taxonomic groups; Cochrane et al. (2010)) listed in 577
Table 1 of Annex III of the MSFD as indicative biological features. For each component an example of 578
their contribution to a particular service is given. Table is split to increase legibility. 579
580 581
18 Table 2a
582
Ecosystem services
Biodiversity components (species and taxonomic groups) listed in Table 1 of Annex III of the MSFD
Phytoplankton Zooplankton Angiosperms Benthic
macroalgae
Benthic invertebrate fauna
Food provision Agar production
for gelatine
Shellfish for human consumption
Climate regulation Removal of carbon dioxide from the water column
Removal of carbon dioxide from the water column
Burial of carbon during bioturbation
Disturbance prevention
Reduce erosion by providing root structures in the sediments and reduce wave force and current strength
Reduce erosion by reducing wave force and current strength
Reduce wave force through bioengineering that creates obstacles for currents such as oyster beds and reefs
Bioremediation Take up of nutrients from the water column for growth
Remove wastes from seawater
Remove wastes from seawater
Take up of nutrients from the water column for growth
Remove wastes from seawater through filter feeding
Biological control By feeding on phytoplankton
blooms
Remove bacteria from seawater
As predators of invasive species
19 Ecosystem
services
Biodiversity components (species and taxonomic groups) listed in Table 1 of Annex III of the MSFD
Phytoplankton Zooplankton Angiosperms Benthic
macroalgae
Benthic invertebrate fauna
Food provision Agar production
for gelatine
Shellfish for human consumption
Climate regulation Removal of carbon dioxide from the water column
Removal of carbon dioxide from the water column
Burial of carbon during bioturbation
Leisure/recreation Diving/swimming/kayaking in bioluminescent water
Diving/swimming/kayaking in bioluminescent water
Snorkelling, diving Snorkelling, diving Angling bait,
snorkelling, diving, crab catching
Aesthetic experience
Diving/swimming/kayaking in bioluminescent water
Diving/swimming/kayaking in bioluminescent water
For snorkelers, divers For snorkelers and divers
For snorkelers and divers
583
Table 2b 584
Ecosystem services Biodiversity components (species and taxonomic groups) listed in Table 1 of Annex III of the MSFD
Fish Elasmo-branches Marine mammals and
reptiles
Seabirds Non-indigenous species (NIS)
Food provision Wild fish catches and aquaculture
Sharks and rays caught for human consumption
Grey seals are hunted in the Northern Baltic Sea, Finland
Common eiders are hunted in Denmark, Sweden and Finland
NIS can be introduced for their aquaculture qualities for example Pacific oysters or Manila clams
20
Ecosystem services Biodiversity components (species and taxonomic groups) listed in Table 1 of Annex III of the MSFD
Fish Elasmo-branches Marine mammals and
reptiles
Seabirds Non-indigenous species (NIS)
Climate regulation Disturbance prevention
Reduce wave force through bioengineering that creates obstacles for currents such as oyster beds
Bioremediation Some NIS can remove waste
from seawater through bioturbation and filtration Biological control As predators of
invasive species
As predators of invasive species
As predators of invasive species
As predators of invasive species
* Leisure/recreation Angling Angling/diving Whale/seal/dolphin
watching
Bird watching Aesthetic
experience
For snorkelers and divers
Basking shark watching
Whale/seal/dolphin watching
Bird watching 585
Table 3: Guidelines developed in this study to help deciding which biodiversity indicators may be useful for ecosystem service assessments 586
Indicator type Example Rationale Decision Example reference
General criteria
Distributional range of a component
Distributional range of cephalopods
Useful to know where a particular service may be found but further information needed, such as abundance to give complete information. Also useful to show trends over time.
Accept, but not useful on it's own
21
Indicator type Example Rationale Decision Example reference
Ratios Biomass ratio of
opportunistic macroalgae
Useful but further information needed, such as abundance to give complete information. Useful to show trends over time.
Accept, but not useful on it's own
NIS related indicators Trends in arrival of new NIS Depending on the particular species, NIS may change services for example reduce bioremediation by reducing filter feeder abundance but this link is indirect
Reject as too vague, need to know the species and how they affect a particular service Management indicators Bag size of hunted species Such indicators show a management
measure set in response to other ecosystem indicators and are therefore too indirect
Reject
Pressure indicators Ratio of area affected by dredging proposal
Can indicate a reduction in a service, for example carbon sequestration may be reduced through dredging, but it is human made pressure rather than the effect of the pressure on the ecosystem that is measured here
Reject
Multimetric indicators Cymoskew Data required to calculate the majority of multimetric indicators is useful but most multimetric indicators, particularly EQR indicators which are unitless do not provide direct information about service provision
Reject, but some might be useful if simple to interpret (for example species diversity for leisure and recreation)
Food provision
Biomass/abundance of groups that contain edible species
Biomass of cephalopods Useful, if edible species are measured and data for these species can be extracted from available data
Accept
Size ratios LFI - Large Fish indicator Useful to assess status of fish communities containing commercial species
22
Indicator type Example Rationale Decision Example reference
Reproduction indicators Fecundity rate of fish, Sex ratio of fish
This is a group of indicators that is classed into process indicators by Hattam et al. (2015) and Atkins et al. (2014) for Food provision. However, for top predators such as white tailed eagle reproduction is a useful indicator for the state of the ecosystem (Biological control in the wider sense)
Reject for food provision but accept if top predator health status can be used as an indicator of
Biological control
Climate regulation
Abundance or biomass of phytoplankton or macrophytes
Biomass of phytoplankton Autotrophs take up carbon, which is good for climate regulation but the carbon needs to be removd from the system (e.g. through burial or export to the deep ocean) for it to be effectively a climate regulating service
Accept, but further information needed such as export rates
Depth limits of photic habitats such as seagrass beds
Depth limit of macrophytes Greater depth range of a seagrass bed or of macroalgae potentially leads to larger area covered with such species which allows more uptake of carbon
Accept, but should be revisited in ecology
Zooplankton
biomass/abundance etc
Biomass of selected zooplankton species and taxa groups
Heterotrophs do take up carbon, for
example by eating phytoplankton, and some do move it down through the water column, particularly during dial vertical migration. They also excrete cells in faecal pellets which allows faster sinking rates, enhancing the organic pump
Reject as too indirect, further information on faecal matter and feeding rates needed to measure the service
Turley et al. 2010
Fish and other fauna biomass
Biomass of demersal fish Fish store carbon but also respire it, it does not lead to burial and removal of carbon
Reject as too indirect, further ecological study needed
Beaugrand et al. 2010
Opportunistic macroalgae
Abundance of
opportunistic macroalgae
Rafts of opportunistic macroalgae can wash up on shores, particularly after storms but are not buried, therefore carbon is not removed from the system
23
Indicator type Example Rationale Decision Example reference
Distributional range of phytoplankton
Distributional range of phytoplankton
Indicator does not inform on how much carbon the phytoplankton take up or how much of that carbon is taken out of the system by burial or export therefore the link between the ecosystem service and the indicator is tenuous
Reject
Seagrass abundance, depth, biomass
Biomass of seagrass Seagrass sequesters carbon and through the root system aids burial of carbon
Accept Macreadie et al.
2014 Bioengineering species Biomass (per unit of
surface) of
structuring/engineering species (per habitat)
Species dependent: certain bioturbators aid the removal of carbon and nutrients from the system while others recirculate carbon and nutrients back through the system. Also, macrophytes can aid the removal of carbon (but see above indicators on macrophyte distribution and abundance) and biogenic reefs can aid carbon sequestration
Accept if bioturbators or macrophytes such as seagrass are measured
Norkko et al. 2012
Disturbanc e
prevention
Extent of rocky habitat or sandy habitat
Areal extent of rocky habitats
Abiotic feature which does not inform on an ecosystem service
Reject
Macrophytes: biomass Biomass of Cystoseira barbata
Species dependent and also dependent on where the species are in relation to the coast, a small-growing species of seaweed such as Cystoseira spp. may not reduce wave energy enough to provide a significant service, but large kelps may
Reject, further research needed
Depth limit of macrophytes
Depth limit of macrophytes Distribution relative to coastline may be more important; greater depth will potentially reduce the service as it will not reduce wave and tidal strength
Reject, further research needed, but may be useful if seagrass is measured as seagrass roots hold substrate in place, reducing erosion
24
Indicator type Example Rationale Decision Example reference
Bioengineering species Biomass (per unit of surface) of
structuring/engineering species (per habitat)
Species and biological trait dependent Accept if species or biological trait that aid sedimentation, reduce erosion, reduce wave strength
Bioremedia tion
Depth distribution of habitats
Depth distribution of Posidonia oceanica meadows
This indicator can inform on where habitats are that aid bioremediation but it does not provide enough information to assess the service
Reject, as it does not provide enough informatio on the function of the service Depth limit of
macrophytes
Depth limit of Fucus vesiculosus
Can inform on the water clarity (similar to Secci depth) but is a very indirect indicator, as water clarity also depends on physical and hydrological factors such as currents and waves
Reject
Distributional range of habitats, areal extent of habitats
Distributional range of circalittoral and bathial soft bottom habitats
Informs on where the service may take place Accept
Benthic invertebrates Abundance of selected benthic invertebrate species
Abundance of bioturbators may be useful to assess this service but further information would be needed
Accept Watson et al. 2016
Abundance, composition of functional groups
Abundance and
composition of functional groups in selected habitats
May inform on different types of organisms that can contribute to Bioremediation of waste
![Genetic variability, correlation and path analysis inAshwagandha [Withania somnifera (L.) Dunal]](data:image/gif;base64,R0lGODlhAQABAIAAAP///wAAACH5BAEAAAAALAAAAAABAAEAAAICRAEAOw==)