AENSI Journals
Australian Journal of Basic and Applied Sciences
ISSN:1991-8178
Journal home page: www.ajbasweb.com
Corresponding Author: M. Azhan Anuar, Department of Mechanical Engineering, Universiti Teknologi MARA, UiTM Shah Alam, 40450 Selangor, Malaysia.
E-mail: [email protected]
Comparison of Parametric and Non-Parametric Operational Modal Analysis Methods
on Crack Aluminum Beam
1
M. Azhan Anuar, 2A.A.Mat Isa and 3 R. Brincker
1Department of Mechanical Engineering, Universiti Teknologi MARA, UiTM Shah Alam, 40450 Selangor, Malaysia 2Department of Mechanical Engineering, Universiti Teknologi MARA, UiTM Shah Alam, 40450 Selangor, Malaysia 3Department of Engineering, Aarhus University, Denmark
A R T I C L E I N F O A B S T R A C T
Article history:
Received 30 September 2014 Received in revised form 17 November 2014 Accepted 25 November 2014 Available online 13 December 2014
Keywords:
Operational Modal Analysis, Modal Analysis, Parametric and Non-Parametric
Background: It is essential to recognise modal parameters of any system in order to avoid failure and provide any necessary prevention measure. In this paper, an attempt to investigate the dynamic characteristics of crack aluminum beam using various identification algorithms of Operational Modal Analysis methods (OMA) such as Frequency Domain Decomposition (FDD), Enhanced Frequency Domain Decomposition (EFDD) and Stochastic Subspace Identification (Time parameterization technique) are applied to evaluate the accuracy of each method. Free-free end beam condition is used. Comparison of the results of these techniques will be shown based on practical issues in using each technique.
© 2014 AENSI Publisher All rights reserved. To Cite This Article: M. Azhan Anuar, A.A.Mat Isa and R. Brincker., Comparison of Parametric and Non-Parametric Operational Modal Analysis Methods on Crack Aluminum Beam. Aust. J. Basic & Appl. Sci., 8(24): 296-300, 2014
INTRODUCTION
Traditional experimental modal analysis (EMA) makes use of input (excitation) and output (response) measurements to estimate modal parameters i.e. natural frequencies, damping ratios and mode shapes. However, EMA has several limitations such as it is difficult to artificially excite many civil engineering structures and mechanical components due to their physical sizes, shapes or locations and therefore EMA is usually carried out in the lab environment (D.J.Ewins, 1986).
The OMA technique or often called Ambient Analysis is used instead to overcome these limitations in EMA. OMA technique is an alternative valuable tool for determination of the dynamic characteristics of a structure (modal parameters) especially when the input force cannot be controlled or measured.
The basis of this technique is measurement of the output signals only from a structure which is naturally excited by ambient and its operating forces as unmeasured input (R Brincker, Ventura, & Anderson, 2003; Mehdi Batel, 2002; R. Brincker, L.Zhang, & P.Andersen, 2000). In OMA, one fundamental assumption is the unknown input is relatively broad band in nature. If the loading has narrow banded components, then non-physical “modes” might be estimated. This means modes that are estimated might not be related to the structure, but instead related to the loading. This problem can be identified by testing the structure under different operation conditions in order to see changes in the fake modes related to the loading, but a better approach is to have techniques available that allow estimation of the structural modes in cases of narrow band loading (Rune Brincker & Kirkegaard, 2010; Zhang, 2004).
This study presents Operational Modal Analysis (OMA) techniques used to investigate the dynamic characteristics of a crack aluminum beam as a case study. The dynamic characteristics (modal frequencies and mode shapes) are extracted under free-free end condition. The measurements were taken using Bruel & Kjaer PULSETM Multi-Analyzer System, MTCTM software and Operational Modal Analysis ProTM software.
MATERIALS AND METHODS
Operational Modal Analysis:
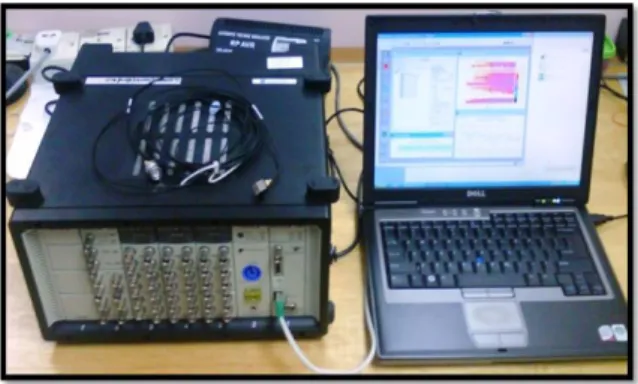
software where signal processing and modal extraction were performed (Fig.1). The specimen used is an aluminum beam (1200mm x 50mm x 25mm) made of aluminium material with with crack in the middle (Fig.2).
Fig. 1: The Bruel&Kjaer PULSETM Multi-Analyzer System connect to a computer with MTCTM software and Operational Modal AnalysisProTM software.
Fig. 2: Aluminum beam and crack position.
In this case, twenty (20) accelerometers (20 DOF’s) were used with single measurement. No reference accelerometer is needed as only one data set was captured from the beam. A trial pre-test indicate that the lowest frequency of interest was around 70Hz and hence 120 seconds of data capture would be sufficient to represent more than 8000 cycles of the lowest frequency of interest.
The beam was excited by continuous scrubbing of the structure with relatively enough energy and the excitation frequency must be broadband enough to define all modes. MTC software was used to set up the hardware, create the geometry, assign measurement points and performs the test. The raw data which consists of geometrical values and series of measurements are then directly exported to the Operational Modal Analysis ProTM software for signal processing calculation and modal extraction. Frequency Domain Decomposition (FDD), Enhanced Frequency Domain Decomposition (EFDD) and Stochastic Subspace Identification (SSI) techniques are performed after all data is exported.
Frequency Domain Decomposition (FDD):
This technique also known as non-parametric method is an extension of the Basic Frequency Domain (BFD) technique (Batel, S., N., & Herlufsen, 2003). In this technique, the modes can be estimated from spectral densities calculated where the modal parameters are estimated directly from the signal processing calculations. The modes are estimated using Singular Value Decomposition (SVD) of each Power Spectral Density (PSD) matrix.
Enhanced Frequency Domain Decomposition (EFDD):
Stochastic Subspace Identification (SSI):
This is another parametric method where modal parameters are estimated by utilizing a parametric model fitted to the signal processed data. In this method, output-only covariance-driven and data-driven SSI are used to identify modal parameters (Goursat, Döhler, Mevel, & Andersen, 2011). Raw time data is used in data-driven SSI method while correlation function is used in covariance-driven SSI method. There are three identification classes for SSI method namely Unweighted Principle Components (UPC), Principle Components (PC) and Canonical Variate Analysis (CVA). However in this paper, only result from PC and CVA will be presented.
RESULTS AND DISCUSSION
The major challenge of using OMA technique is to differentiate natural frequencies of real physical deformations from forcing components and its harmonics, to the uncorrelated noise presents in the analysis. From all the peaks exhibited using FDD and EFDD techniques (SVD Plot), only several points are the real natural frequencies. Thus to ensure that the natural frequencies are genuine than these values are confirmed by its corresponding mode shapes and SVD plot.
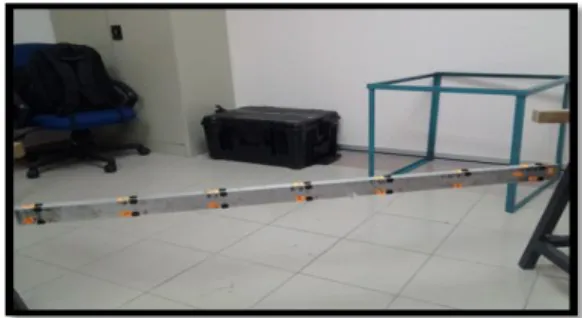
In this test, Operational Modal Analysis is carried out under “free” condition to extract the modal parameters. Practically, it is impossible to achieve a truly free support condition however it is generally acceptable to obtain close approximation to this condition. This is achieved by hanging the structure on very soft 'springs' support such as light elastic bands (see Fig. 3). However, unlike theoretical approach, the rigid body modes no longer having zero natural frequencies but values which are relatively very low as compared to the flexible modes. Random signal from excitation source was required in order to excite large range of modes in the structure and hence to have significant modal contribution at all frequencies.
Fig. 3: Operational Modal Analysis experimental set-up.
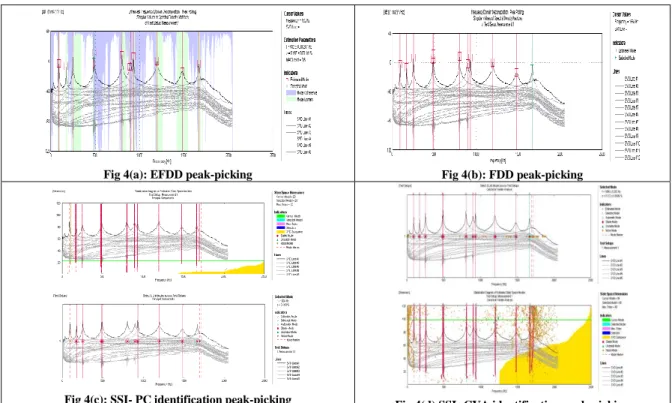
The SVD plot (see Fig 4(a) and 4(b)) shows the peak-peaking were performed on the average values of singular values for FDD and EFDD methods. There are a number of peaks clearly visible in the plots for frequency range below 1700Hz and 11 peaks seen to represent 11 modes that are detected which are to be caused by structural resonances. Using SDOF in a user-definable frequency band around the peak, the frequency and damping value are determined while the mode shapes are determined from singular vectors weighted by the singular values in the frequency band. It can be seen that all the resonances are well separated in the plot.
As for SSI techniques, the stability diagram was obtained and depicted in Fig 4(c) and 4(d). The analyses were performed without projection channels with a frequency range up to 2048Hz. For both algorithms, the stabilization diagrams are shown up to a maximum state space dimension of 120. PC algorithm identified the first mode as noise mode and not stable with 100% damping value (Table 2). On the other hand, CVA algorithm identified all the modes as stable including the first mode.
The natural frequencies results are presented in Table 1 showing the comparison of natural frequencies for both parametric and non-parametric OMA techniques (FDD, EFDD and SSI). It can be seen that the results are reasonably close and in good agreement for each method with FDD is considered as a reference method. The analysis has been focused on the lower identified modes since for most structures, the lower vibration modes will correspond to dominant structural vibration behavior under typical dynamic loading condition.
A good estimation of modal parameters (frequency, damping ratio and mode shape) is performed using EFDD and SSI techniques. As for the damping values both techniques give the estimated damping values except the FDD method. The corresponding damping values for each mode are illustrated in Table 2.
Fig 4(a): EFDD peak-picking Fig 4(b): FDD peak-picking
Fig 4(c): SSI- PC identification peak-picking Fig 4(d) SSI- CVA identification peak-picking
Fig. 4: FDD and EFDD peak-picking and stochastic stability diagram.
Table 1: Natural frequencies for OMA techniques. Mode Non-Parametric Method
FDD (Hz)
Parametric method
EFDD (Hz) SSI – PC Identification(Hz) SSI – CVA Identification (Hz)
1 91 91.29 102.4 90.56
2 171 171.4 171.6 170.8
3 251 250.8 250.7 250.7
4 483 482.5 482.4 482.4
5 490 489.7 489.7 489.8
6 801 801.2 801.2 801.2
7 898 896.6 896.9 896.9
8 931 931.2 931.2 931.2
9 1194 1195 1195 1195
10 1479 1479 1480 1479
11 1666 1666 1666 1666
Table 2: Damping ratio for each mode from EFDD and SSI.
Mode Damping - EFDD
(%)
Damping - SSI- PC
(%) Damping - SSI- CVA (%)
1 0.7921 100 0.3976
2 0.4897 0.2997 0.8485
3 0.2941 0.2128 0.2508
4 0.1668 0.0869 0.09691
5 0.1564 0.08951 0.1495
6 0.1925 0.1598 0.168
7 0.5395 0.5696 0.5635
8 0.1023 0.07178 0.07175
9 0.4211 0.4158 0.4344
10 0.8746 0.7598 0.7854
11 0.1348 0.1032 0.1122
Conclusion:
estimated from FDD. In addition, standard deviation of frequency and damping are estimated from EFDD and SSI methods.
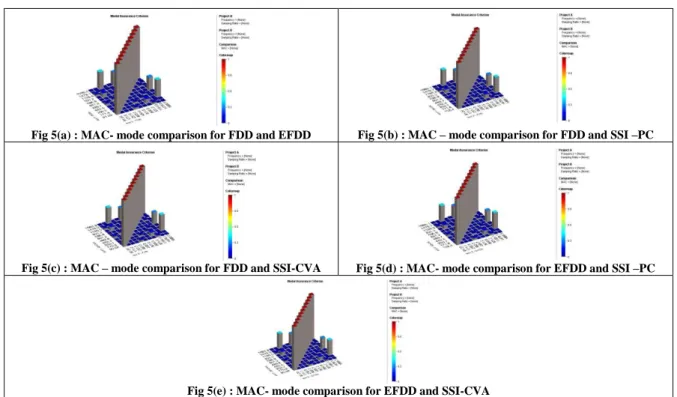
Fig 5(a) : MAC- mode comparison for FDD and EFDD Fig 5(b) : MAC – mode comparison for FDD and SSI –PC
Fig 5(c) : MAC – mode comparison for FDD and SSI-CVA Fig 5(d) : MAC- mode comparison for EFDD and SSI –PC
Fig 5(e) : MAC- mode comparison for EFDD and SSI-CVA
Fig. 5: Modes comparison between each method.
ACKNOWLEDGEMENT
The authors are pleased to acknowledge the Malaysian Ministry of Higher Education (MOHE) and Research Management Institute (RMI) of Universiti Teknologi MARA (UiTM) for providing financial support for this study through a research grant FRGS
REFERENCES
Batel, M.S.G.N.M., H. Herlufsen, 2003. Ambient Response Modal Analysis on a Plate Structure. In
Proceedings of 21st International Modal Analysis Conference (IMAC-XXI). Kissimmee, Florida.
Brincker, R., P.H. Kirkegaard, 2010. Special issue on Operational Modal Analysis. Mechanical Systems and Signal Processing, 24(5): 1209-1212. doi:10.1016/j.ymssp.2010.03.005
Brincker, R., C.E. Ventura, P. Anderson, 2003. Why Output-Only Modal Testing is a Desirable Tool for a Wide Range of Practical Applications. In Proceedings of the 21st International Modal Analysis Conference onStructural Dynamics (pp: 1-8). Kissimmee, Fla, USA.
Ewins, D.J., 1986. Modal Testing: Theory and Practice. , 2nd Ed. Letchworth, Hertfordshire, England: Research Studies Press LTD.
Goursat, M., M. Döhler, L. Mevel, P. Andersen, 2011. Crystal Clear SSI for Operational Modal Analysis of Aerospace Vehicles. In T. Proulx (Ed.), Structural Dynamics, Volume 3 SE - 125 (pp: 1421-1430). Springer New York. doi:10.1007/978-1-4419-9834-7_125
Mehdi Batel, 2002. Operational Modal Analysis – Another Way of Doing Modal Testing. Sound and Vibration Magazine.
Pastor, M., M. Binda, T. Harčarik, 2012. Modal Assurance Criterion. Procedia Engineering, 48: 543-548. doi:10.1016/j.proeng.2012.09.551
Brincker, R., L. Zhang, P. Andersen, 2000. Modal Identification from Ambient responses using Frequency Domain Decomposition. In International Modal Analysis Conference (IMAC), San Antonio, Texas.