Research Article
Using environmental DNA analyses to assess the
occurrence and abundance of the endangered
amphidromous fish
Plecoglossus altivelis
ryukyuensis
Yoshihisa Akamatsu, Gen Kume, Masuji Gotou, Takanori Kono, Takuma Fujii, Ryutei Inui , Yoshihisa Kurita
‡ Yamaguchi University, Ube, Japan § Kagoshima University, Kagoshima, Japan | Kagoshima University, Amami, Japan
¶ Fukuoka Institute of Technology, Fukuoka, Japan # Kyushu University, Fukutsu, Japan
Corresponding author: Yoshihisa Kurita ([email protected])
Academic editor: Rupert Collins
Received: 03 Sep 2019 | Accepted: 21 Nov 2019 | Published: 14 Jan 2020
Citation: Akamatsu Y, Kume G, Gotou M, Kono T, Fujii T, Inui R, Kurita Y (2020) Using environmental DNA analyses to assess the occurrence and abundance of the endangered amphidromous fish Plecoglossus altivelis ryukyuensis. Biodiversity Data Journal 8: e39679. https://doi.org/10.3897/BDJ.8.e39679
Abstract
The Ryukyu ayu Plecoglossus altivelis ryukyuensis is an endangered amphidromous fish that inhabits rivers in the Ryukyu Archipelago (Japan). Populations of the species have declined dramatically. Consequently, the Ryukyu ayu has been registered as a natural monument in Japan and monitoring surveys with direct catching are restricted legally. This restriction, unfortunately, makes monitoring of population abundances difficult and creates a barrier to both advancing understanding of the species’ status and the development of appropriate conservation plans.
We developed a non-invasive monitoring methodology using eDNA analyses. We designed a specific quantitative PCR assay for the Ryukyu ayu using the mitochondrial ND4 region. Using this primer/probe set, we conducted eDNA analyses in three rivers on Amami-Ohshima Island. The DNA fragments were amplified from the eDNA extracted from natural
‡ § ‡ ‡ | ‡,¶
#
water in each river. The numbers of DNA fragments detected were positively correlated with individual counts of fish obtained by visual snorkelling surveys. Our method does not contravene restrictions and facilitates abundance monitoring of this endangered fish species.
Keywords
Monitoring methods, threatened species, stock management, conservation, qPCR
Introduction
Monitoring the density and distributions of populations is an essential component of the conservation of endangered species (Cobos and Alonso Bosch 2018, Boon et al. 2019). Fish monitoring is usually based on data obtained from direct catches, electrofishing, trapping and visual observation. However, legal restrictions promulgated for the protection of endangered fishes often constrain investigations that use conventional ‘invasive’ methods, thereby reducing confidence in estimates of abundance and distribution. In these cases, less damaging methods should be investigated to improve ecological monitoring of protected species and evaluate the current state of populations.
The Ryukyu ayu Plecoglossus altivelis ryukyuensis is an endangered amphidromous fish that inhabits rivers in the Ryukyu Archipelago. The Ryukyu ayu has diverged genetically and morphologically from the related subspecies Plecoglossus altivelis altivelis, which occurs in more northern sections of the Japanese archipelago (other than Hokkaido; Ikeda et al. 2003). The Ryukyu ayu was originally found in the waters of Okinawa Island and Amami-Oshima Island. The Okinawa Island population became extinct in 1978. Thus, the Amami-Oshima Island population, which is the last wild population of Ryukyu ayu, is now classified as critically endangered (CR) in the Red List published by the Japanese Ministry of the Environment, Japan (2018). The local and national governments prohibit collection or injury of these fish.
procedure using only small volumes of water may be able to monitor the abundance and distribution of protected organisms without the difficulties of a visual survey (i.e. high turbidity and many hidden structures) or contravening legal regulations.
In this study, we developed species-specific primers and a probe for detecting the eDNA of the Ryukyu ayu via quantitative PCR (qPCR). We ground-truthed the relationship between eDNA concentrations and fish abundance through visual snorkelling surveys in the rivers studied. We were also able to investigate the spatial distribution of the Ryukyu ayu along the lengths of the rivers.
Materials and method
Field surveys
Field surveys were conducted in three rivers (the Yakugachi, Sumiyou and Kawauchi rivers) on Amami-Oshima Island, Japan (Fig. 1). The catchment areas and river lengths were as follows: Yakugachi River, 47.8 km and 15.1 km; Sumiyou River, 48.5 km and 15.5 km; Kawauchi River, 28.3 km and 12.3 km. All rivers drain into the sea on the east coast of Amami-Oshima Island. Ryukyu ayu individuals swim up these rivers every year to grow (February–May) and spawn (December–February). The hatching larvae flow down to sea.
Visual surveys by snorkelling
We counted the numbers of individual Ryukyu ayu in the Yakugachi River on 16 November 2017; numbers were counted in the Sumiyou and Kawauchi Rivers on 17 November 2017.
2 2
2
Figure 1.
The survey areas extended from the seaward end of the freshwater zone upstream to the uppermost reach of Ryukyu ayu distribution area in each of the rivers. We divided the survey areas in each river into segments of ca. 1 km length; thus, the Yakugachi River was divided into 12 segments and the other two rivers into four segments each (Fig. 1). Visual counts of the fish were made by snorkelling downstream through the length of each segment. The methodology of the visual survey followed Watanabe and Ito (1999). The visual surveys were started at 13:00 h on 16 November and at 10:00 h on 17 November. Each survey lasted 60–120 min.
Field sampling for eDNA
We collected 1 litre surface water samples for eDNA analyses in the shallows near the downstream end of each survey segment just after each snorkelling survey. Snorkelling survey and water sampling were conducted by different personnel. Each water sample was packed in a plastic bag containing benzalkonium chloride (eDNA preservative) at a final concentration of 0.01% and transported to the laboratory. Then, the water samples were filtered through GF/F glass fibre filters (pore size 0.7 µm, GE Healthcare, Japan) on the day of sampling and stored at –20°C. We incorporated an ‘equipment blank’ and ‘cooler blank’ as negative controls for each filtering and sampling step, respectively. As a cooler blank, we carried 1 litre of ultra-pure water in a bottle from our laboratory to the sampling field and it was treated identically to the sampled water bottles, except that it was not opened at the field sites. In the laboratory, we filtered the cooler blank and the equipment blank (1 litre DNA-free distilled water prepared in the laboratory) as negative controls after filtering the test samples on each sampling day.
DNA extraction and qPCR
We extracted DNA from the filters with a DNeasy Blood & Tissue Kit (QIAGEN, Netherlands), following the procedures described by Doi et al. (2016).
We designed a new forward primer (Pa-ND4F: 5'‑ATAGCACTTCCACTGACAGCCACC‑3'), reverse primer (Pa-ND4R: 5'‑AGTAGGACCAGTTAAACATGGCCGTG‑3') and probe (5'‑FAM-GGTTTATTGCTAACCTAGCTAACCTGGC-TAMRA‑3'), based on the sequences of the mtDNA NADH dehydrogenase subunit 4 (ND4) region of the Ryukyu ayu, registered in GenBank (accession numbers AB181780–AB181799; www.ncbi.nlm.nih.gov/genbank). The primer and probes did not amplify extracted DNA of Mallotus villosus and Hypomesus nipponensis, species that belong to the same family as the Ryukyu ayu (Suppl. material 1 shows alignments of each primer/probe with osmeriform relatives). Both species do not co-occur on Amami-Ohshima Island, but are widely sold as food products.
equipment blank as mentioned above). A dilution series of the synthetic linear DNA (124 bp: 5'‑ATAGCACTTC CACTGACAG CCACCTGGT GGTTTATTG CTAACCTAG CTAACCTGG CCCTCCCAC CTCTCCCCA ACCTTATGGG GGAGCTGGTC ATTATCACGG CCATGTTTAA CTGGTCCTACT‑3') (Takara) containing 2×10 , 2×10 , 2×10 , 2×10 and 2×10 copies per tube was also used in triplicate as the quantification standard in all qPCR assays. In addition, to avoid contamination, we performed the above qPCR set-up, including preparation and addition of the standards, in a separate room from that of the qPCR procedure. The thermal-cycling regime was as follows: 95°C for 3 min, followed by 55 cycles of 95°C for 10 s and 60°C for 20 s. We performed four replicates for each sample in the qPCR assay. The limit of detection (LOD) of the qPCR was one copy per reaction with four replicates. We analysed the qPCR results using the PikoReal software ver. 2.2.248.601 (Thermo Fisher Scientific). The species related to Ryukyu ayu, which are possibly recognised by our primer/probe set, are not distributed in the study area. We sequenced 8 qPCR products, to confirm that qPCR products, amplified from eDNA, were the target sequences of the Ryukyu ayu. Sequencing was carried out by an external agency (FASMAC, Japan). We examined the relationship between the eDNA concentration and individual numbers of the Ryukyu ayu using single regression analyses.
Results
Visual survey by snorkelling
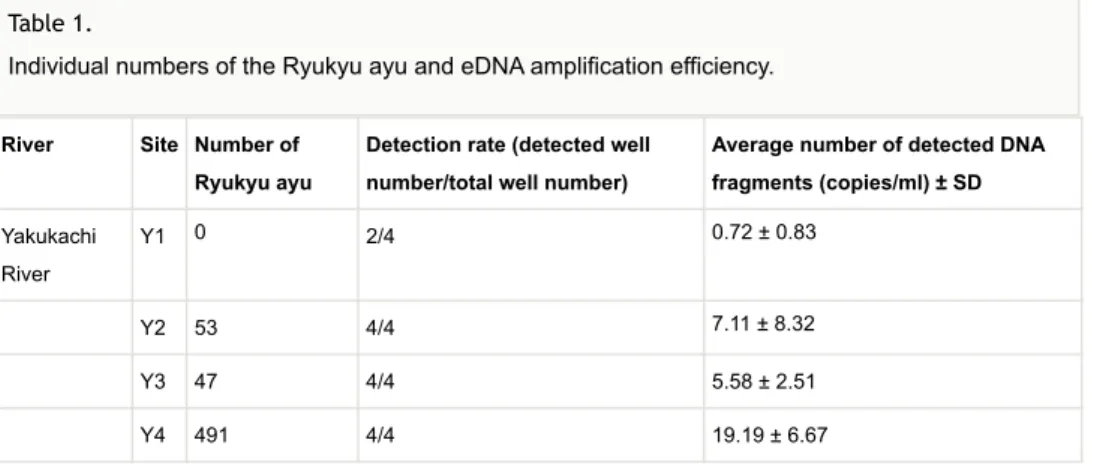
Table 1 lists the numbers of individual fish counted in each river survey segment. The Ryukyu ayu were observed in most survey segments of the three rivers. We counted 187.6 ± 245.0 individuals (mean ± SD) in each survey segment and a total of 1688 individuals in the Yakugachi River. The numbers were 183.3 ± 317.5 and 550 individuals in the Sumiyou River and 350.5 ± 259.9 and 1402 individuals in the Kawauchi River, respectively. The highest density of individuals was counted in segment K3 (Fig. 1) in the Kawauchi River (732 individuals). No fish of this species were found in segment Y3 in the Yakugachi River or in segments S1 and S2 in the Sumiyou River.
River Site Number of Ryukyu ayu
Detection rate (detected well number/total well number)
Average number of detected DNA fragments (copies/ml) ± SD
Yakukachi River
Y1 0 2/4 0.72 ± 0.83
Y2 53 4/4 7.11 ± 8.32
Y3 47 4/4 5.58 ± 2.51
Y4 491 4/4 19.19 ± 6.67
1 2
3 4 5
Table 1.
River Site Number of Ryukyu ayu
Detection rate (detected well number/total well number)
Average number of detected DNA fragments (copies/ml) ± SD
Y5 697 4/4 13.03 ± 3.84
Y6 20 4/4 4.12 ± 2.74
Y7 64 3/4 3.34 ± 2.45
Y8 230 4/4 15.21 ± 5.41
Y9 86 4/4 1.89 ± 1.05
Sumiyo River
S1 0 4/4 19.50 ± 28.22
S2 0 4/4 93.74 ± 9.81
S3 550 4/4 448.60 ± 38.84
Kawauchi River
K1 248 4/4 110.30 ± 80.63
K2 149 4/4 100.90 ± 55.20
K3 732 4/4 398.40 ± 264.53
K4 273 4/4 172.77 ± 97.32
Optimising Ryukyu ayu eDNA detection to estimate fish abundance
The primer sets amplified the Ryukyu ayu DNA extracted from the environmental water. No amplification was detected from both negative controls; the cooler blank and the equipment blank. The DNA sequences of 8 qPCR products which showed the same haplotype, were identical to the target sequences of Ryukyu ayu (see Suppl. material 2).
The numbers of target DNA fragments (copies/ml) contained in each water sample are listed in Table 1, with standard curve (y = –0.233 + 13.651, R2 = 0.94, efficiency = 71.13%). The average numbers of target DNA fragments detected in each river were as follows: 7.57 ± 7.44 copies/ml (mean ± SD), in the Yakugachi River, 186.52 ± 143.94 copies/ml in the Sumiyou River and 195.6 ± 182.31 copies/ml in the Kawauchi River. The largest number of DNA fragments was detected in segment S3 in Sumiyou River (448.60 copies/ml), and the smallest number was found in segment Y1 in the Yakugachi River (0.72 copies/ml).
We examined the relationship between individual numbers of fish counted during snorkelling and the number of target DNA fragments in the rivers (Fig. 2). In all rivers, the number of individuals counted was positively correlated with the number of target DNA fragments, particularly in the Yakugachi and Kawauchi rivers (p < 0.05; single regression analyses). The coefficients of determination (R ) for the relationships were 0.612 (Yakugachi), 0.974 (Sumiyou) and 0.975 (Kawauchi).
Discussion
We used a non-invasive eDNA procedure to monitor the abundance of Ryukyu ayu. The newly-designed primers for the mtDNA ND4 region (Pa-ND4 primers) amplified target DNA fragments from eDNA samples. Then, we found positive correlations between the individual numbers of Ryukyu ayu counted visually while snorkelling and the number of DNA fragments detected in environmental water samples for all rivers (Fig. 2).
Environmental DNA from Ryukyu ayu was detected in sites where no fish were observed (Table 1, Fig. 3), although these sites were within the known distribution range of Ryukyu ayu (G. Kume, unpublished data). The eDNA densities in these sites were low, possibly originating from only a small number of fish that we failed to detect visually or from eDNA transported downstream. In a previous study on ayu, Doi et al. 2016 also detected eDNA in sites where no fish were observed by visual survey and reported that the molecular
Figure 2.
approach has considerable promise when fish occur in such low densities that they may not be visually detected. As no negative controls have been amplified by qPCR in this study, the results detecting target species’ eDNA are probably caused by the high sensitivity of this method and not by artificial contamination.
The copy number of detected DNA was smaller in the Yakugachi River than in the other rivers (Table 1). Although the cause of this difference is obscure, we postulate that the concentration of PCR inhibitors was higher in the Yakugachi River than in the other two rivers. Previous studies have shown that the eDNA amplification efficiency is affected by the concentration of PCR inhibitors (potentially algae, polysaccharides and suspended sediment particles) in environmental waters (Klymus et al. 2015, Stoeckle et al. 2017). As another possible cause, eDNA concentration can be strongly affected by characteristics of each river or lotic system, such as water volume, velocity and structures (e.g. riffles and pools) via retention, re-suspension and dilution of eDNA (Shogren et al. 2017). The inconsistency between eDNA concentration and fish abundance in our study may have involved these differences in characteristics of the rivers. While some studies have shown that eDNA analysis methods are applicable to abundance/biomass estimation (Doi et al. 2016, Yamanaka and Minamoto 2016), Buxton et al. (2017), in a study of great-crested newts (Triturus cristatus), pointed out that eDNA in aquatic systems is most reliable for detecting presence/absence, but not abundance. Our result implies that the reliable estimation of fish abundance in rivers using eDNA analysis requires a priori confirmation of a relationship between the number of eDNA copies and the number of individuals in each river as estimated by independent methods.
Conclusions
The monitoring of animal distributions and abundances is an essential component of endangered species conservation efforts and stock management of commercial species.
Figure 3.
However, invasive monitoring methods that use conventional direct trapping negatively affect small populations and are banned for some species, including the Ryukyu ayu. The non-invasive eDNA monitoring method that we used does not contravene current regulations, requires less effort than snorkelling surveys and can, therefore, provide important data.
Acknowledgements
Funding for this project was provided by grant from JSPS KAKENHI Grant Number 16K07827 and by a grants-in-aid of "The Zoshinkai Fund For Protection of Endangered Animals, Japan." We deeply thank Prof. Minoru Ikeda (Tohoku Univ.) for providing DNA samples of the Ryukyu ayu. Editor and three reviewers provided valuable feedback on earlier versions of the manuscript. This work was also supported by Research center for environmental DNA, Yamaguchi University.
Author contributions
Y.A. and R.I. designed this study. G.K., T.F. and T.K. conducted the field survey. M.G. and Y.K. conducted molecular experiments and Y.A., G.K., M.G., R. I. and Y.K., wrote the manuscripts.
Conflicts of interest
The authors have no conflict of interest to declare.
References
• Atkinson S, Carlsson JL, Ball B, Egan D, Kelly-Quinn M, Whelan K, Carlsson J (2018) A quantitative PCR-based environmental DNA assay for detecting Atlantic salmon (Salmo salar L.). Aquatic Conservation: Marine and Freshwater Ecosystems 28 (5): 1238‑1243.
https://doi.org/10.1002/aqc.2931
• Boon P, Cooksley S, Geist J, Killeen I, Moorkens E, Sime I (2019) Developing a standard approach for monitoring freshwater pearl mussel (Margaritifera margaritifera) populations in European rivers. Aquatic Conservation: Marine and Freshwater Ecosystems 29 (8): 1365‑1379. https://doi.org/10.1002/aqc.3016
• Buxton A, Groombridge J, Zakaria N, Griffiths R (2017) Seasonal variation in environmental DNA in relation to population size and environmental factors. Scientific Reports 7 (1). https://doi.org/10.1038/srep46294
• Dejean T, Valentini A, Miquel C, Taberlet P, Bellemain E, Miaud C (2012) Improved detection of an alien invasive species through environmental DNA barcoding: the example of the American bullfrog Lithobates catesbeianus . Journal of Applied Ecology 49 (4): 953‑959. https://doi.org/10.1111/j.1365-2664.2012.02171.x
• Doi H, Inui R, Akamatsu Y, Kanno K, Yamanaka H, Takahara T, Minamoto T (2016) Environmental DNA analysis for estimating the abundance and biomass of stream fish. Freshwater Biology 62 (1): 30‑39. https://doi.org/10.1111/fwb.12846
• Evans N, Shirey P, Wieringa J, Mahon A, Lamberti G (2017) Comparative cost and effort of fish distribution detection via environmental DNA analysis and electrofishing. Fisheries 42 (2): 90‑99. https://doi.org/10.1080/03632415.2017.1276329
• Ikeda M, Nunokawa M, Taniguchi N (2003) Lack of mitochondrial gene flow between populations of the endangered amphidromous fish Plecoglossus altivelis ryukyuensis inhabiting Amami-oshima Island. Fisheries Science 69 (6): 1162‑1168. https://doi.org/ 10.1111/j.0919-9268.2003.00741.x
• Klymus K, Richter C, Chapman D, Paukert C (2015) Quantification of eDNA shedding rates from invasive bighead carp Hypophthalmichthys nobilis and silver carp Hypophthalmichthys molitrix . Biological Conservation 183: 77‑84. https://doi.org/ 10.1016/j.biocon.2014.11.020
• Laramie M, Pilliod D, Goldberg C (2015) Characterizing the distribution of an
endangered salmonid using environmental DNA analysis. Biological Conservation 183: 29‑37. https://doi.org/10.1016/j.biocon.2014.11.025
• Ministry of the Environment, Japan (2018) Red List: brackish and freshwater fishes.
https://www.env.go.jp/press/files/jp/109278.pdf. Accessed on: 2019-8-01.
• Shogren A, Tank J, Andruszkiewicz E, Olds B, Mahon A, Jerde C, Bolster D (2017) Controls on eDNA movement in streams: Transport, Retention, and Resuspension. Scientific Reports 7 (1). https://doi.org/10.1038/s41598-017-05223-1
• Stoeckle B, Beggel S, Cerwenka A, Motivans E, Kuehn R, Geist J (2017) A systematic approach to evaluate the influence of environmental conditions on eDNA detection success in aquatic ecosystems. PLOS ONE 12 (12). https://doi.org/10.1371/ journal.pone.0189119
• Takahara T, Minamoto T, Doi H (2013) Using environmental DNA to estimate the distribution of an invasive fish species in ponds. PLoS ONE 8 (2). https://doi.org/ 10.1371/journal.pone.0056584
• Thomsen PF, Willerslev E (2015) Environmental DNA – An emerging tool in
conservation for monitoring past and present biodiversity. Biological Conservation 183: 4‑18. https://doi.org/10.1016/j.biocon.2014.11.019
• Watanabe K, Ito S (1999) Population size and distribution of Pseudobagrus ichikawai, an endangered bagrid catfish in the Kawaura River. Japanese Journal of Ichthyology 46 (1): 15‑30. URL: http://zoobank.org/CDBF8BAD-8D6E-4010-98D9-2B177F0660B7
• Yamanaka H, Minamoto T (2016) The use of environmental DNA of fishes as an efficient method of determining habitat connectivity. Ecological Indicators 62: 147‑153.
Supplementary materials
Suppl. material 1: Supplimentary file 1
Authors: Yoshihisa Akamatsu, Gen Kume, Masuji Goto, Takanori Kono, Takuma Fujii, Ryutei Inui, Yoshihisa Kurita
Data type: Alignment file
Brief description: Alignment of each primer/probe sequences with relative species of Plecoglossusaltivelisryukyuensis.
Download file (1.06 kb)
Suppl. material 2: Sequence of eDNA samples
Authors: Yoshihisa Akamatsu, Gen Kume, Masuji Gotou, Takanori Kono, Takuma Fujii, Ryutei Inui, Yoshihisa Kurita
Data type: DNA sequence