1
The relationship between regular sinusoidal waves in the tissue at
lung-related acupuncture points and the respiration pacesetter
mechanism
Fletcher Kovich, Lic.Ac.
Curepoint Acupuncture in Bristol, Bristol, UK. email: [email protected]
Abstract
Background: While investigating the real-time impedance at acupuncture points
(acupoints), it was found that regular sinusoidal waves were present that corresponded to the pulsing of certain organs, such as respiration and duodenal waves, the stomach’s slow waves, and also the heart’s beating.
Methods: This study investigated such respiration waves at lung-related acupoints to clarify their relation to the respiration pacesetter mechanism. The impedance at key acupoints was monitored in real time while the patients’ breathing slowed after exercise.
Results: In all 7 patients studied, the respiration and heart-beat waves matched the rates in the corresponding organs at rest, and did not vary markedly due to exercise. In 3 of the 7 patients, their post-exercise respiration rate exactly matched that of their duodenal waves, but then dropped, stepwise, back to their usual respiration rate. In the other 4 patients, their post-exercise respiration rate did not reach that of their duodenal waves, so this pattern was not triggered.
Conclusion: The results suggested that as well as the brainstem respiration pacesetter, there was also a separate “pace signal” present which remained constant and seemed to merely define the target respiration rate when at rest. It is currently unknown what
mechanism causes the respiration rate to increase due to exercise. But these results suggest that the brainstem pacesetter is sometimes guided by the duodenal pace signal instead of the lung pace signal, which may explain how the pacesetter is able to jump to a higher rate, even though its chemoreceptor inputs may be unchanged.
2 Keywords
acupuncture; duodenum; impedance; lungs; respiration pacesetter;
Introduction
The intelligent tissue theory [1,2] states that real-time organ information is reflected in the bodily tissue at meridian locations, and that this is the phenomenon that acupuncture utilizes to achieve its effect of immediately correcting organ malfunction.
It is thought that the organ information is communicated via electromagnetic waves, and that the communication rate is therefore considerably faster than that achievable via the nervous system (theoretically, 670 times faster [3]) and such waves are capable of conveying fine detail related to an organ’s function.
Part of the organ information found in all bodily tissue consists of sinusoidal waves which appear to relate to the regular pulsing in the function of the heart, lungs, stomach, and the duodenum,[1,4] and may therefore relate in some way to the electrical pacesetters for those organs. The current study aimed to explore the relationship between these sinusoidal waves in the tissue at lung-related acupuncture points (acupoints) and the brainstem respiration pacesetter.
The Theory
It has been shown that the impedance at an acupoint is proportional to the strength of the related organ’s function, which was demonstrated in relation to the lungs [1,5,6], the
stomach [4,7] and the heart [8,9]. When a change of impedance occurs at any skin location, this indicates that there must have been a physical change in the structure of the skin
and/or the tissue beneath, possibly including its fluid content.
3
The inference is that when an organ is stressed and this results in an impedance change at its key acupoints, the accompanying change in physical structure that produces that impedance change is also what causes the above anomalies, such as the tenderness when pressed (which is akin to the feeling when tissue has been bruised; i.e. damaged).
The intelligent tissue theory [2] holds that all organ states are communicated body-wide on electromagnetic waves, and that bodily tissue is capable of interpreting this information, and this is what causes the tissue at meridians to adopt these physical changes that reflect the real-time function of the related organ.
One aspect of these physical changes is sinusoidal waves that reflect the stomach’s slow waves, the duodenal waves, the respiration pattern, and also the heart’s beat. All these waves can be readily detected in the impedance at acupoints, and have been shown not to be artefact of any kind.[1,4] It has also been shown that there is a variable phase shift in such waves, whose phase can vary by as much as 2 seconds,[4] which has been attributed to the variable amount of time it takes for the local tissue to interpret the organ information and produce a change in itself to reflect that information.[4]
4
Methods and materials
Seven patients were selected from the author’s Chinese acupuncture practice. They all received acupuncture routinely, and usually attended clinic for a treatment at intervals ranging from 3 to 6 weeks, depending on the level of stress in their life; none took pharmaceuticals routinely; and at the time of the recordings, all were healthy.
The real-time impedance was monitored at the following acupoints. With patient 1, the range of acupoints monitored was wider. These included bilateral Kidney 3 (Taixi), left Lung-6 (Kongzui), left Lung-9 (Taiyuan), left Stomach-19 (Burong), and left Stomach-36 (Zusanli). This wider range of acupoints was used to determine if the impedance at these acupoints included features pertinent to the study. It was determined that it was only necessary to monitor the impedance at left Lung-6 to obtain the data necessary for this study. However, an interesting phenomenon was noted in the impedance at left Stomach-19 (which is discussed below). Therefore, with patients 2-7, the acupoints monitored were left Lung-6; and 3 pairs of electrodes were also placed across the left Stomach-19 acupoint (at 6 mm intervals perpendicular to the meridian), to monitor for the repetition of this phenomenon in the other patients. The acupoints on the left were chosen for purely practical reasons, the equipment being positioned on the patient’s left side, so that cable sway was less of an issue while monitoring the left acupoints.
A thermistor was also placed under each patient’s nose to record their breathing cycle. And their pulse rate was monitored by placing an oximeter on their finger and taking readings every 10 seconds.
The acupoints were first located by an acupuncturist with 14 years experience in Chinese acupuncture, then the location of lowest impedance was verified electrically, and this was used as the test location.
5
direct current passed through it. The voltage across the thermistor was monitored by another data logger, also sampling at 1 kHz. An Access database and macro was used to control the data loggers and convert the voltage samples into kΩ and Celsius values, before they were imported into Matlab and filtered to produce the plots.
An accompanying online dataset [12] contains links to documents that describe in detail all the equipment and techniques used, including circuit diagrams for the custom-built units, how to construct the custom electrodes, how to reliably locate acupoints electrically; and the Access macro and Matlab scripts are also included.[12]
An initial 190 second recording was made while the patient sat relaxed. The patient then stood, ran on the spot for 3 minutes, then immediately sat down and relaxed while all the states were recorded for 600 seconds. For this second recording, the sample rate was reduced to 500 Hz, to reduce the amount of data and the filtering time. During the recordings, the patient rested their left arm on their left leg, so as to minimize the risk of movement artefact on the left LU-6 electrode.
Towards the end of this period, the patient was asked to hold their breath for around 15-20 seconds. This was marked by the patient pressing a footswitch to mark the start and end point. The exact points were later verified by studying the breathing cycle plot, and these points were marked on the impedance plots with vertical green lines.
Informed consent was obtained (see the consent form in the dataset [12]). This study was conducted in the UK. IRAS Project ID: 274498. The Medical Research Council was consulted but it was determined that NHS Research Ethics Committee approval was not required. Note that the IRB is an entirely USA-based organization whose requirements do not apply in the UK.
Results and discussion
6
Table 1. Lung pace signal and respiration wavelengths (seconds) Patient,
sex, age
rates at rest Average for 1st 30 seconds after exercise
Lung PS Resp. Lung PS Resp.
1, M, 35 4.09±0.09* 3.77±0.42 3.83±0.71 2.67±0.23 2, M, 59 4.04±0.55 3.35±0.29 3.79±0.67 3.10±0.33 3, M, 45 4.00±0.64 4.60±0.88 4.14±0.34 2.17±0.17 4, F, 45 3.80±0.64 3.12±0.44 3.59±1.04 2.83±0.17 5, M, 49 3.81±0.70 4.28±1.41 4.78±0.75† 3.38±0.95 6, M, 52 3.99±0.67 4.73±0.58 3.53±0.91 3.76±0.36 7, M, 49 4.20±0.82 4.87±0.52 3.95±1.02 2.84±0.08
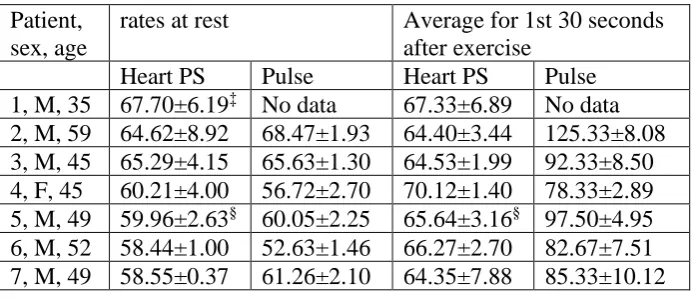
Table 2. Heart pace signal and pulse rates (beats per minute) Patient,
sex, age
rates at rest Average for 1st 30 seconds after exercise
Heart PS Pulse Heart PS Pulse 1, M, 35 67.70±6.19‡ No data 67.33±6.89 No data 2, M, 59 64.62±8.92 68.47±1.93 64.40±3.44 125.33±8.08 3, M, 45 65.29±4.15 65.63±1.30 64.53±1.99 92.33±8.50 4, F, 45 60.21±4.00 56.72±2.70 70.12±1.40 78.33±2.89 5, M, 49 59.96±2.63§ 60.05±2.25 65.64±3.16§ 97.50±4.95 6, M, 52 58.44±1.00 52.63±1.46 66.27±2.70 82.67±7.51 7, M, 49 58.55±0.37 61.26±2.10 64.35±7.88 85.33±10.12
* With patient 1, an initial recording was not made to capture the values at rest, so the rest values were
obtained from the last 100 seconds of the 10 minute recording.
† Figure obtained from ST-19, since LU-6 sensor was faulty on patient 5 after exercise.
‡ With patient 1, an initial recording was not made to capture the values at rest, so the rest values were
obtained from the last 100 seconds of the 10 minute recording.
7
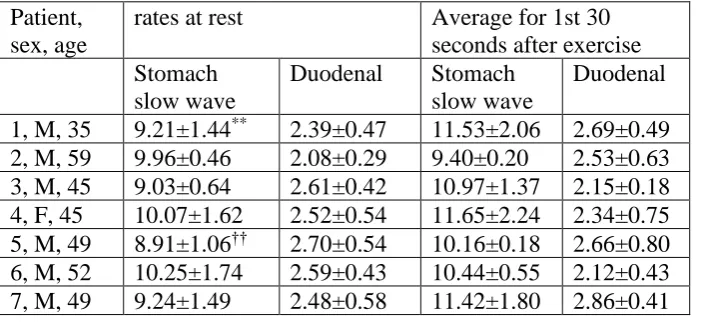
Table 3. Pace signal wavelengths for other organs (seconds) Patient,
sex, age
rates at rest Average for 1st 30 seconds after exercise Stomach
slow wave
Duodenal Stomach slow wave
Duodenal 1, M, 35 9.21±1.44** 2.39±0.47 11.53±2.06 2.69±0.49 2, M, 59 9.96±0.46 2.08±0.29 9.40±0.20 2.53±0.63 3, M, 45 9.03±0.64 2.61±0.42 10.97±1.37 2.15±0.18 4, F, 45 10.07±1.62 2.52±0.54 11.65±2.24 2.34±0.75 5, M, 49 8.91±1.06†† 2.70±0.54 10.16±0.18 2.66±0.80 6, M, 52 10.25±1.74 2.59±0.43 10.44±0.55 2.12±0.43 7, M, 49 9.24±1.49 2.48±0.58 11.42±1.80 2.86±0.41
Note that the stomach’s slow wave is often assumed to have a wavelength of around 20 seconds. But intracellular recordings were made in 2011 that found these slow waves to be 10.4 ±1.7 seconds.[4,13]
In the first 30 seconds after exercise, the average changes in the pace signal rates across all 7 patients, were as follows. There was a slight increase in the lung pace signal rate, of 5.34±4.87 %. Whereas there was a notable increase in the actual respiration rate, of 22.81±15.25 %. There was a slight increase in the heart pace signal rate, of 6.74±7.33 %. Whereas there was a notable increase in the actual pulse rate, of 53.43±17.71 %. There was a decrease in the stomach’s slow wave pace signal rate, of 13.75±11.61 %. And there was a slight decrease in the duodenal pace signal rate, of 0.73±16.07 %.
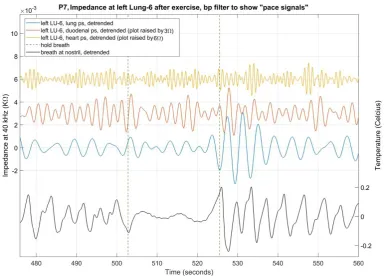
With all patients, the lung pace signal continued unchanged while the patient consciously held their breath. Figure 1 shows the lung, duodenal, and heart pace signals while patient 1 held his breath. This same pattern was repeated with all 7 patients (see dataset-figures 1B to 7B [12]).
** With patient 1, an initial recording was not made to capture the values at rest, so the rest values were
obtained from the last 100 seconds of the 10 minute recording.
8
Figure 1. Shows the impedance at left LU-6 on patient 7, after exercise. Bandpass filters were applied to
show the lung, duodenal, and heart pace signals, as captured within the impedance.
As expected, with all patients there was a notable increase in the respiration rate after exercise (22.81±15.25 %), but with each patient the lung pace signal remained fairly stable, with only a slight average increase amongst all 7 patients (5.34±4.87 %). And similar results were obtained for the heart pace signal and the pulse rate.
These results also confirmed that the pace signals are not merely artefact derived from either the muscular or electrical activity of the related organ. Indeed, the fact that the lung pace signal continued when a patient consciously held their breath, reinforces this notion. So, what function do these sinusoidal waves have, and where are they generated?
9
But there is also an inherent problem in comparing the pace signal (as reflected in the tissue at an acupoint) with that organ’s pacesetter. It has been shown that when such organ information is reflected at an acupoint, there is a variable delay in the pattern produced in the tissue, which can sometimes be as much as 2 seconds.[4] This produces a variable phase shift in these meridian reflections of the pace signals.
The correlation between the lung pace signal and the breathing pattern while at rest
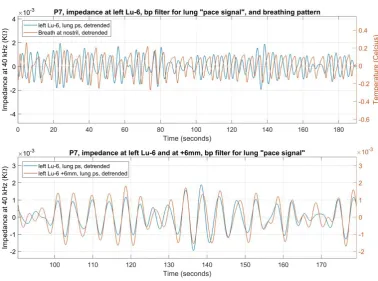
Figure 2’s top plot shows the lung pace signal at left LU-6 superimposed on the breathing pattern of patient 7 while relaxed. If it is assumed that the pace signal somehow guides the respiration pacesetter, it would still not be expected for the two signals in this plot to be in phase, due to the variable delay introduced in the reflection of pace signals at meridian locations. And indeed, in many places in the plot, there does seem to be a fairly consistent phase shift. Overall, the average phase shift was 1.17±1.44 seconds, with a maximum negative shift of -2.39 seconds, and a maximum positive shift of 3.40 seconds (calculations included in the dataset [12]).
Figure 2. Shows the impedance at left LU-6 on patient 7, while relaxed. The upper plot superimposes the
10
And the lower plot shows the lung pace signal at LU-6 and at 6 mm perpendicular to the acupoint’s centre, to
demonstrate the variable phase shift here.
To demonstrate the variability of the delay in the pace signal (as reflected in the meridian tissue), Figure 2’s lower plot shows the pace signal as reflected at left LU-6 and also at 6 mm medial to the acupoint, on patient 7. It should be remembered that the source signal (the actual pace signal) would be the same in both cases, but when the local tissue reflects this at these two locations, which are only 6 mm apart on the skin, clear phase shifts are sometimes introduced, which could only be created due to the delay in the local tissue interpreting the original signal. Overall (between 0 and 190 seconds), the average phase shift was 0.13±0.49 seconds, with the maximum shifts being -1.26 and 1.76 seconds (see the dataset [12] for these calculations).
This also serves to demonstrate that the pace signals picked up in the impedance at acupoints could not be due to electrical artefact, since if they were, they would always be exactly in phase.
The author’s hypothesis was that the pace signals only serve to provide a target resting rate for an organ’s electrical pacesetter. Therefore an exact correlation between the lung pace signal and the breathing pattern would not be expected, as would be expected between an electrical pacesetter and an organ’s muscular activity. And due to the variable delay introduced by whatever mechanism the local tissue uses to reflect the pace signals, an exact comparison between this and the breathing pattern is not possible anyway. However, Figure 2 shows that there was an approximate correlation between the lung pace signal and the breathing pattern in patient 7 while at rest, which pattern was repeated in the other 6 patients.
The spikes in the pace signal
11
dataset [12], which provides an explanation for these spikes, and also uses them to demonstrate that the pace signals could not be artefact of any kind.
Fast respiration may be guided by the duodenal pace signal
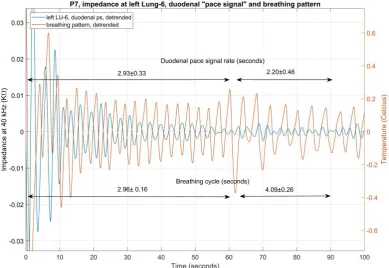
In patients 1, 3 and 7, the initial respiration rate after exercise, matched that of their duodenal pace signal. After a period of relaxation, this rate then immediately dropped, stepwise, back to a rate that was nearer to their lung pace signal. In the other 4 patients, this same phenomenon was not present, which may simply be explained by the fact that their respiration rate did not rise to that of their duodenal pace signal, and therefore simply changed gradually (rather than step-wise), until it had slowed back down to near to their lung pace signal.
Figure 3. Shows the impedance at left LU-6 on patient 7, after exercise. A bandpass filter was applied to
show the duodenal pace signal, as captured within the impedance; which is superimposed on the breathing
pattern, as captured at the nostril.
12
over the following 29 seconds), while the duodenal pace signal continued relatively unchanged, at 2.20±0.46 seconds (during the same 29 second period). During this same period, the lung pace signal’s rate was 3.95±0.99 seconds.
All the pace signals, when reflected in the tissue at any meridian location, feature a variable phase shift (as described above). As can be seen in Figure 3, during the first 60 seconds, when this variable phase shift is allowed for, the breathing pattern matched the rate of the duodenal pace signal, wave for wave. And while the breathing followed the duodenal pace signal, the amplitude of that pace signal was increased (this can be seen more clearly in the dataset-figure 7D [12]).
The dataset-figure 1C and 1E [12] show the same pattern with patient 1. For the first 133 seconds, the duodenal pace signal’s rate was 2.53±0.44 seconds, while the breathing rate was 2.63± 0.25. The patient then sighed, and the breathing rate immediately dropped to 3.13±0.53 seconds (measured over the following 58 seconds), while the duodenal pace signal continued relatively unchanged, at 2.69±0.57 seconds (during the same period). The patient then sighed again, and the breathing rate dropped to 4.35±0.96 seconds.
Throughout, the lung pace signal rate was fairly stable at 4.04±0.29 seconds. With patient 3, the thermistor became misplaced during the exercise period, and the breathing pattern was not captured reliably (see dataset-figures 3C and 3D [12]). However from the figures obtained, it was possible to cautiously deduce the respiration rate during the 1st 30 seconds after exercise, to be 2.17±0.17 seconds (see figure 3D and also the calculations for patient 3 in the dataset [12]). This matched the rate of his duodenal pace signal, of 2.15±0.18 seconds.
Immediately after exercise, patient 4’s breathing rate (2.83±0.17) was near to that of her duodenal pace signal (which was 2.34±0.75), but was not close enough to trigger the above phenomenon, and her breathing rate simply gradually slowed back to her normal rest rate (see the calculations for patient 4 in the dataset [12]).
The increased amplitude in the duodenal pace signal at Stomach-19
13
had a notably increased amplitude, but only while the breathing rate matched that of the duodenal pace signal.
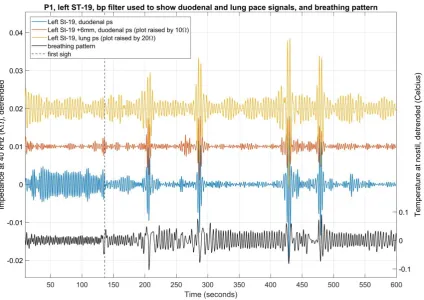
With patient 7, this increased amplitude was present at left LU-6 (see dataset-figure 7B). But with all three patients (1, 3 and 7), this increased amplitude was present in the vicinity of left ST-19.
Figure 4. Shows the impedance at left ST-19 on patient 1, after exercise. A bandpass filter was applied to show the duodenal and lung pace signals, as captured within the impedance. The breathing pattern is also
shown.
14
With patient 3, the increased amplitude was in the general vicinity of left ST-19 (up to a radius of 18 mm), and ceased at around 80 seconds (see dataset-figures 3E and 3F [12]). And with the other 4 patients, whose breathing rate did not increase to that of their
duodenal pace signals, there was no similar increase in the amplitude of the duodenal pace signals, as reflected at left ST-19, or elsewhere.
This increased amplitude was not present in the duodenal pace signal as reflected at other bodily locations at the same time. This therefore amounted to an intelligent interpretation of this pace signal by the tissue at this stomach acupoint. The tissue at the stomach-related meridian is thought to emphasise organ information related to the stomach [2]. And since the tissue emphasized the duodenal pace signal (while it was not emphasized in other locations) this demonstrated an association between that pace signal and the organ. This is an important point, since it helps to rule out the possibility that these pace signals are simply rhythms being generated at some location in the body (for other purposes, or even just accidentally) which just happen to coincide with the resting rhythms of certain organs while not actually being related to those organs.
A possible extra element to the respiration pacesetter mechanism
The above observations suggest a previously unreported element of the respiration pacesetter mechanism.
Respiration (air passing into and out of the lungs) occurs due to pressure differences in the air and within the lungs; and the pressure within the lungs is modified due to the
contraction and relaxing of the diaphragm and the external intercostal muscles.[14] To set the respiration rate, these muscles are controlled by the respiratory centre within a part of the brain known as the medulla oblongata, which acts upon information about the level of CO2 in the blood gained from chemoreceptors in the brain, brainstem, carotid arteries and
aortic arch.[14] However, on exercise the arterial PCO2 does not increase, and it is not
known what mechanism causes the respiration pacesetter to speed up during exercise (there are only unsatisfactory hypotheses).[15]
15
pace signal, rather than the lung pace signal; and that when the faster respiration rate is no longer required, the brainstem pacesetter returns to being guided by the lung pace signal. How might the physiology of this be achieved?
The intelligent tissue theory states that bodily tissue is able to interpret organ information conveyed on an electromagnetic wave. [2] This is not restricted to the meridians, but extends on either side of them; and since the meridians reach every part of the body, this suggest that some element of all bodily tissue may have this ability. The tissue studied so far is extremely responsive, as shown in the figures in this current paper alone. It is now accepted that connective tissue is capable of semiconduction;[16,17] hence this provides the conditions necessary for a genuine direct current to be present throughout the body’s connective tissue network, and it is assumed that the organ information is superimposed upon this current, as electromagnetic waves. Such waves travel through human connective tissue at a theoretical speed of 67,000 m/s.[3] This allows for the communication of organ information to every part of the body at a rate that is around 670 times faster than the nervous system is able to achieve.
One possibility is that each organ’s electrical pacesetter may also incorporate tissue that is able to interpret such organ information, and that it is this tissue that receives the
information from the organ’s pace signal, which then determines the target rate of each electrical pacesetter when the person is at rest. If this is the case, such interpretive tissue would be able to follow a quicker pace signal instead, when necessary, which might explain how the electrical respiration pacesetter was able to follow the duodenal pace signal, rather than the lungs’ pace signal, when a markedly increased respiration rate was necessary. In this situation, this still does not suggest what mechanism tells the pacesetter that an increase in pace is required, but only suggests a mechanism that may enable the pacesetter to jump to a higher rate.
16
the brain and spinal cord,[19,20] so the assumption that these pace signals are generated by the organs (rather than within the brain) would seem to be a sensible starting point for this research.
Another possibility is that a range of pace signals is produced by a single organ, and all organs that pulse repetitively simply select the pace signal that is nearest to their
requirements. However, it seems more likely that each organ produces its own pace signal, because this study noted that when the lungs borrowed the duodenal pace signal, that pace signal had a notably increased amplitude at some stomach acupoints, but only while the lungs were utilizing the duodenal pace signal. This suggested that the duodenal pace signal was specifically associated with the stomach. If all the pace signals were produced
independently of the organs that utilize them, this pattern would not be expected. Prospects
The study suggests exciting opportunities for research in other areas. As a part of the ongoing research into the respiratory pacesetter mechanism, the role of this extra pace signal might be further investigated. The real-time impedance patterns at acupoints contain much detailed information, which is not always easy to interpret. But the fact that these pace-signal waves are predictable, and can also be related to the function of a particular organ, provides the opportunity to look for the corresponding variations in the local tissue at acupoints (and elsewhere). These would perhaps consist of regular microscopic patterns (which produce the waves seen in the impedance). The tissue at such locations could be studied in real time, to attempt to identify these regular physical changes. Once identified, the tissue could be further studied to attempt to determine how the tissue produces these patterns, and hence how the tissue interprets the organ information (the pace signal) in the electromagnetic waves.
17
Disclosure statement
The author received no financial contribution towards the design or conducting of this research, nor towards the preparation of this article.
References
[1] Kovich F. The lungs’ real-time states are reflected in the tissue at its related acupuncture points. J Acupunct Res. 2019;36(2):88-91. doi:
https://doi.org/10.13045/jar.2019.00045.
[2] Kovich F. Acupuncture Today and in Ancient China. Bristol, UK: CuriousPages Publishing; 2019, p. 372-373.
[3] Kovich F. A curious oversight in acupuncture research. J Acupunct Meridian Stud 2017;10(6):411-415. doi: https://doi.org/10.1016/j.jams.2017.10.004.
[4] Kovich F. The stomach’s communication with its related acupoints, and the “intelligent tissue” hypothesis. J Acupunct Res 2019;36(1): 21-27. doi:
https://doi.org/10.13045/jar.2018.00409.
[5]. Serisawa K. An Approach on Meridians and Acupuncture Points in Modern Medicine. J Comprehensive Rehabilitation 1978, 11:789.
[6] Sullivan SG, Eggleston DW, Martinoff JT, Kroening RJ. Evoked electrical conductivity on the lung acupuncture points in healthy individuals and confirmed lung cancer patients. Am J Acupunct 1985;13(3):261-66
[7]. Kovich F. The Daily Variance in Impedance at Acupuncture Points. J Acupunct Res 2018; 35(4): 176-181. doi: https://doi.org/10.13045/jar.2018.00122
[8]. Rosenblatt S. The Electrodermal Characteristics of Acupuncture points. Am J Acupunct 1981;10:131-137.
[9]. Saku K, Mukaino Y, Ying H, Arakawa K. Characteristics of reactive
18
[10] Kovich F. Acupuncture Today and in Ancient China. Bristol, UK: CuriousPages Publishing; 2019, p. 49-60.
[11] Kovich F. Acupuncture Today and in Ancient China. Bristol, UK: CuriousPages Publishing; 2019, p. 345-360.
[12] Kovich, F. The relationship between regular sinusoidal waves in the tissue at lung-related acupuncture points and the respiration pacesetter mechanism. Mendeley Data 2019, v2 http://dx.doi.org/10.17632/xzjbv2h943.2
[13] Rhee PL, Lee JY, Son HJ, Kim JJ, Rhee JC, Kim S et al. Analysis of pacemaker activity in the human stomach. J Physiol. 2011 Dec 15; 589(Pt 24): 6105–6118.
[14] Betts JG, Desaix P, Johnson E, Johnson JE, Korol O, Kruse D et al. Anatomy and Physiology. Houston, TX: OpenStax, Rice University; 2013, p. 1048-1056.
[15] West JB. Respiratory Physiology, The Essentials, 8th ed. Lippincott Williams & Wilkins: Philadelphia, PA; 2008, p. 135.
[16] Szent-Gyorgyi A. Towards a New Bio-chemistry. Science 1941;93:609-11.
[17] Gascoyne PRC, Pethig R, Szent-Gyorgyi A 1981. Water structure-dependent charge transport in proteins. Proceedings of the National Academy of Sciences 1981;78:261-265. [18] Kovich F. Acupuncture Today and in Ancient China. Bristol, UK: CuriousPages Publishing; 2019. p. 87-98.
[19] Betts JG, Desaix P, Johnson E, Johnson JE, Korol O, Kruse D et al 2013. Anatomy and Physiology. Houston, TX: OpenStax, Rice University; 2013, p. 503-598.