REVIEW ARTICLE
COVID-19 in African Countries versus other World Regions: A
Review
DOI: 10.29063/ajrh2020/v24i2s.17
Amadu J. Kaba
1* and Andzi Nkweti Kaba
2Seton Hall University, South Orange, New Jersey1; Independent Scholar, New Jersey2
*For Correspondence: Email: [email protected]
Abstract
This review examines the spread of COVID-19 (coronavirus) in Africa. By May 15, 2020, while the COVID-19 infections were 1,741,129 in Europe, 1,632,167 in North America, 757,924 in Asia, 401,072 in South America, there were only 79,780 infections in Africa, a continent with 1.34 billion people. During this same date, of the total COVID-19 deaths of 308,154 worldwide, Europe accounted for 160,482 (52.1%) deaths; North America accounted for 99,633 (32.3%) deaths; Asia accounted for 23,963 (7.8%) deaths; South America accounted for 21,303 (6.9%) deaths; and Africa accounted for only 2,639 (0.9%) deaths. Among the factors cited for this phenomenon (Africa‘s low figures) are: low volumes of international tourism to most African nations; a relatively young African population, with 533.5 (39.8%) million under the age of 15; low obesity rates in Africa; low rates of urbanization in most African nations; hot or high temperatures and high humidity in most African nations; low levels of testing, which continues to be the case in countries all across the world and proactive measures by African governments and people to slow the spread of the coronavirus. It is recommended that African countries continue to pursue proactive measures such as use of facemasks, hand sanitizers, regular hand washing and immediate partial or full lockdown when necessary. (Afr J Reprod Health 2020 (Special Edition); 24[2]: 125-141).
Keywords: Age, Africa, Coronavirus, COVID-19, Obesity, Tourism, Urbanization
Résumé
Cette revue examine la propagation du COVID-19 (coronavirus) en Afrique. Au 15 mai 2020, alors que les infections au COVID-19 étaient de 1741129 en Europe, 1632167 en Amérique du Nord, 757924 en Asie, 401072 en Amérique du Sud, il n'y avait que 79780 infections en Afrique, un continent de 1,34 milliard d'habitants. Au cours de cette même date, sur un total de 308 154 décès dus au COVID-19 dans le monde, l'Europe représentait 160 482 (52,1%) décès; L'Amérique du Nord a été responsable de 99 633 (32,3%) décès; L'Asie représentait 23 963 décès (7,8%); L'Amérique du Sud représentait 21 303 décès (6,9%); et l'Afrique ne représentait que 2 639 (0,9%) décès. Parmi les facteurs cités pour ce phénomène (les faibles chiffres de l‘Afrique) figurent: les faibles volumes de tourisme international dans la plupart des pays africains; une population africaine relative ment jeune, avec 533,5 (39,8%) millions de moins de 15 ans; les faibles taux d'obésité en Afrique; les faibles taux d'urbanisation dans la plupart des pays africains; températures chaudes ou élevées et humidité élevée dans la plupart des pays africains; de faibles niveaux de tests, ce qui continue d'être le cas dans les pays du monde entier et des mesures proactives des gouvernements et des peuples africains pour ralentir la propagation du coronavirus. Il est recommandé aux pays africains de continuer à prendre de s mesures proactives telles que l'utilisation de masques faciaux, de désinfectants pour les mains, le lavage régulier des mains et le verrouillage immédiat partiel ou complet si nécessaire. (Afr J Reprod Health 2020 (Special Edition); 24[2]: 125-141).
Mots-clés: Âge, Afrique, Coronavirus, COVID-19, Obésité, Tourisme, Urbanisation
Introduction
In the past eleven decades, there are two types of events that could be argued to have directly impacted people all across the world, including the loss of millions of lives, and economic devastations worth hundreds of billions of dollars or more. One such event is war, especially World
dollars in economic devastation to the point where the United States had to financially rescue European nations through the Marshall Plan4. The second event that impacted the entire world in the past eleven decades is the Influenza pandemic of 1918. The flu, as it is commonly known, resulted in worldwide deaths estimated at 20-100 million5, and other scholars put the figure at as high as or no less than 50 million6,7.
The continent of Africa was directly impacted by these three events. For example, Lunn points out that 2.35 million ―Africans were mobilized‖ by European powers to fight in World War I and that ―250,000 soldiers and carriers, as well as approximately 750,000 civilians perished‖ in the war8,9 During World War II, Morrow Jr. points out that 30,000 to 31,000 West African soldiers lost their lives fighting for the French government10. Both World Wars I and II negatively impacted the economies of African nations9-11,. The flu pandemic of 1918, which originated outside of Africa7, killed 2.3 million people in Africa6. The 1918 flu left serious economic effects in the world, including in Africa6.
In the year 2020, there has been the emergence of the COVID-19 (coronavirus) pandemic, which originated in China in December 2019, and became known to the world in January 2020. By May 15, 2020, the disease had infected 4,621,414 people in the world, including in Africa. It had also resulted in the deaths of 308,154 (e Table 1A). However, although Africa has been negatively impacted by COVID-19, the spread of the disease and the death rates have not been as high in African nations as they are in Asia, Europe, Latin America and North America. For example, by May 15, 2020, while there were 1,484,285 people infected in the United States, resulting in 88,507 deaths, there were only 79,780 people infected and 2,639 deaths in Africa, a continent with 1.34 billion people in 2020 (Compiled and computed from Tables 1A and 2A-2F). This is a very interesting observation because there appeared to be an initial expectation that Africans would be negatively impacted the
most12,13. For example, Heaton and Falolanote that
during the influenza pandemic of 1918, while both Africa and Europe had 2.3 million deaths, on a per
capita basis it was 14.2-17.2 deaths per 100,000 of the population in Africa, but only 4.8 deaths per 100,000 people in Europe6.
According to Napoli and Nioi: ―Although we cannot exclude an underestimation of the real cases of SARS-CoV-2 epidemic in poorest countries of Africa due to the lack of appropriate diagnostic techniques, no official report has documented an increase in the death rate for pneumonia of unknown causes. Accordingly, alternative hypotheses can be derived from epidemiological data to explain the disproportional spread of the disease‖14
. By May 15, 2020, however, the small European nation of Luxemburg, with 628,381 people, according to the CIA World Factbook, had more COVID-19 infections (3,923, according to Worldometer) than the following 16 African nations combined: Ethiopia, Democratic Republic of Congo, Tanzania, Kenya, Uganda, Angola, Madagascar, Mozambique, Malawi, Zimbabwe, Burundi, Togo, Botswana, The Gambia, Lesotho, and Western Sahara (3,920 infections, with a combined population of over half a billion people, 518.114 million) (Compiled and computed from Tables 2A-2F).
This review examines the spread of COVID-19 (coronavirus) in Africa in the first five months of 2020, specifically as of May 15, 2020. The study begins by presenting a methodology section. Next, the study presents the overall infection and death rates in the world, and then the infection and death rates in each African nation, and each of the five regions of the continent to examine any similarities and differences among the nations and regions. Finally, the study identified the factors that may be responsible for the similarities and differences among the nations and regions of Africa. It is useful to note that it is still too early to get a full understanding of the COVID-19 pandemic. However, it is important to start to build a body of knowledge on the spread of the disease and the deaths resulting from it.
The coronavirus statistics presented in this study were compiled and computed from the Worldometer website. We carefully observed for two weeks the COVID-19 statistics presented by
(https://coronavirus.jhu.edu/map.html), which is widely cited around the world and Worldometer statistics which are widely cited by major organizations or entities and the same as those from Johns Hopkins University. However, Johns Hopkins University does not provide recovered and active cases statistics for all countries listed. Also, while Worldometer provides statistics categorized as ―Yesterday‖ and ―2 Days Ago‖, Johns Hopkins does not provide such categories (they only provide live statistics, which can change every few hours or minutes or seconds). Therefore, we decided to use the statistics from Worldometer, which are really the same as those provided by Johns Hopkins University. Coronavirus statistics in this study for infections, deaths, recovered and active cases were compiled on May 16, 2020. Coronavirus statistics for total tests and tests per 1 million of population were compiled on June 13, 2020.
The population statistics in this study were compiled from the CIA World Factbook and Worldmeter. The international tourists or visitors data were compiled from the World Bank. The data for the under 15 population, obesity rates and urbanization rates were compiled from the CIA World Factbook. Data for international tourists or visitors were not available for three African countries. Data for total tests and tests per 1 million population were not available for 13 African countries. The non-African countries listed in Tables 1B and 3B were selected for this study because they were ranked among the top 20 of COVID-19 cases as of May 15, 2020. Most of these non-African countries are among the most populous in the world, with many of them ranked in the top 15. Most of these countries also have the highest Gross Domestic Product (GDP) in the world, with many of them in the top 10.
The breakdown of the five regions of Africa is based on the United Nations‘ classifications of world regions and regions of Africa: ―Composition of macro geographical (continental) regions, geographical sub-regions, and selected economic and other groupings‖ (https://unstats.un.org/unsd/methodology/m49/). Finally, the academic journal articles cited in this study to explain or make sense of the statistics or
claims made were carefully retrieved from academic search engines such as Proquest and JSTOR.
COVID-19 infection and death rates in the
world: a focus on Africa
Tables 1A and 1B: World and Regional populations 2020, COVID-19 Infections, Deaths, Recovered, and Active Cases Statistics for the World, World Regions, and Selected Countries, as of Friday, May 15, 2020
Population Total Total % of % of % of Total % of % of % of Active % of % of % of
Table 1A Total Infections Deaths Region World
World
Deaths Recovered Region World
World Total
Recovered Cases Region World
World Active Cases
World 7,784,849,118 4,621,414 308,154 6.7 1,756,649 38.0 2,556,611 55.3
Africa 1,340,598,147 79,780 2,639 3.3 0.1 0.9 30,210 37.9 0.7 1.7 46,931 58.8 1.0 1.8
Asia 4,641,054,775 757,924 23,963 3.2 0.5 7.8 106,133 14.0 2.3 6.0 36,269 4.8 0.8 1.4
Europe 747,636,026 1,741,129 160,482 9.2 3.5 52.1 739,801 42.5 16.0 42.1 840,846 48.3 18.2 32.9
North
America 368,869,647 1,632,167 99,633 6.1 2.2
32.3
406,544 24.9
8.8
23.1 1,125,990 69.0 24.4 44.0
Oceania 42,677,813 8,621 119 1.4 0.0 0.0 7,858 91.1 0.2 0.4 644 7.5 0.0 0.03
South
America 430,759,766 401,072 21,303 5.3 0.5
6.9
139,641 34.8
3.0
7.9 240,128 59.9 5.2 9.4
Table 1B % of % of % of % of % of % of % of % of % of
Selected
Countries Country World
World
Deaths Country World
World Total
Recovered Country World
World Active Cases
United
States 332,639,102 1,484,285 88,507 6.0 1.9 28.7 327,751 22.1 7.1 18.7 1,068,027 72.0 23.1 41.8
Spain 50,015,792 274,367 27,459 10.0 0.6 8.9 188,967 68.9 4.1 10.8 57,941 21.1 1.3 2.3
Italy 62,402,659 223,885 31,610 14.1 0.7 10.3 120,205 53.7 2.6 6.8 72,070 32.2 1.6 2.8
United
Kingdom 65,761,117 236,711 33,998 14.4 0.7 11.0 .. .. .. .. .. .. .. ..
France 67,848,156 179,506 27,529 15.3 0.6 8.9 60,448 33.7 1.3 3.4 91,529 51.0 2.0 3.6
Germany 80,159,662 175,699 8,001 4.6 0.2 2.6 151,700 86.3 3.3 8.6 15,998 9.1 0.3 0.6
China 1,394,015,977 82,933 4,633 5.6 0.1 1.5 78,209 94.3 1.7 4.5 91 0.1 0.0 0.0
Canada 37,694,085 74,613 5,562 7.5 0.1 1.8 36,895 49.4 0.8 2.1 32,156 43.1 0.7 1.3
Belgium 11,720,716 54,644 8,959 16.4 0.2 2.9 14,301 26.2 0.3 0.8 31,384 57.4 0.7 1.2
India 1,326,093,247 85,784 2,753 3.2 0.1 0.9 30,258 35.3 0.7 1.7 52,773 61.5 1.1 2.1
Russia 141,722,205 262,843 2,418 0.9 0.1 0.8 58,226 22.2 1.3 3.3 202,199 76.9 4.4 7.9
Source: Population statistics in Table 1A compiled from Worldometer on Saturday, May 16, 2020 from: https://www.worldometers.info/population/; The Population statistics in Table
1B compiled from the 2020 CIA World Factbook on Saturday, May 16, 2020 from: https://www.cia.gov/library/publications/the-world-factbook/geos/ml.html; All COVID-19 statistics compiled and computed by authors from Worldometer on Saturday, May 16, 2020 from: https://www.worldometers.info/coronavirus/?utm_campaign=homeAdvegas1?
According to Table 1 B, there were five countries with 100,000 or more cases of COVID-19 infections in the world as of May 15, 2020. These include the United States, 1,484,285 (32.1% of total world infections); Spain, 274,367 (5.94%); Russia, 262,843 (5.7%); United Kingdom, 236,711 (5.1%); Italy, 223,885 (4.8%); France, 179,506 (3.9%); and Germany, 175,699 (3.8%). These five countries have the highest number of COVID-19 deaths: United States, 88,507 deaths (6% of those infected in the United States, 1.9% of 4,621,414 infected in the world, and 28.7% of 308,154 world deaths); United Kingdom, 33,998 deaths (14.4%, 0.7%, and 11%) respectively; Italy, 31,610 deaths (14.1%, 0.7%, and 10.3%) respectively; France, 27,529 deaths (15.3%, 0.6%, and 8.9%) respectively; and Italy, 27,459 deaths (10%, 0.6% and 8.9%) respectively. Of the five countries with the highest number of deaths, Germany had the highest proportion of those who recovered (86.3% or 151,700 people) followed by Spain (68.9% or 188,967 people); Italy (53.7% or 120,205 people); France (33.7% or 60,448 people); and the United States (22.1% or 327,751 people). The following countries had at least 40% of active cases: Russia had the highest proportion of active cases: 76.9%; United States, 72%; India, 61.5%; Belgium, 57.4%; France, 51%; and Canada, 43.1% (Table 1B).
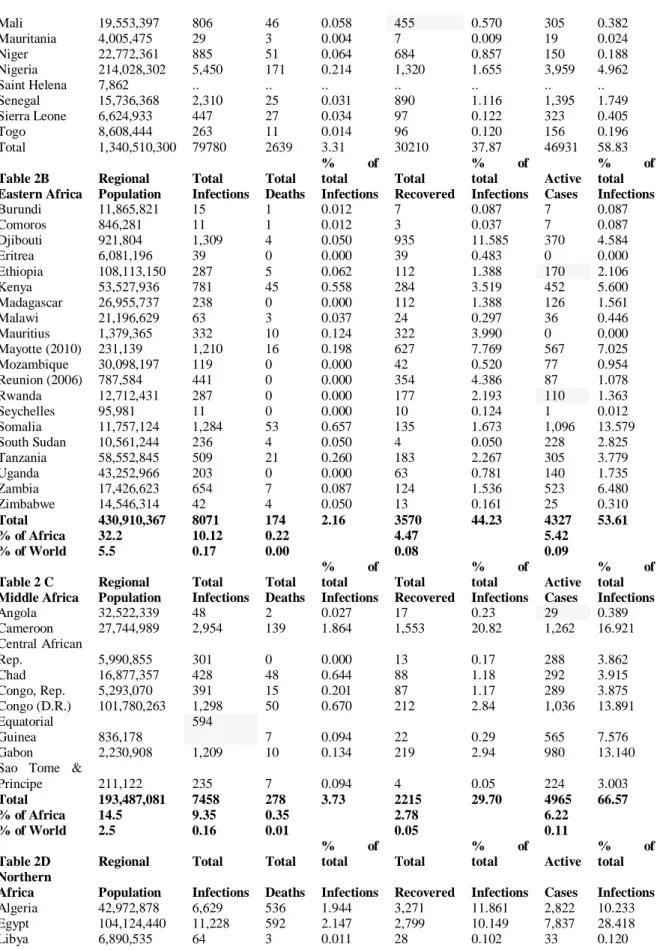
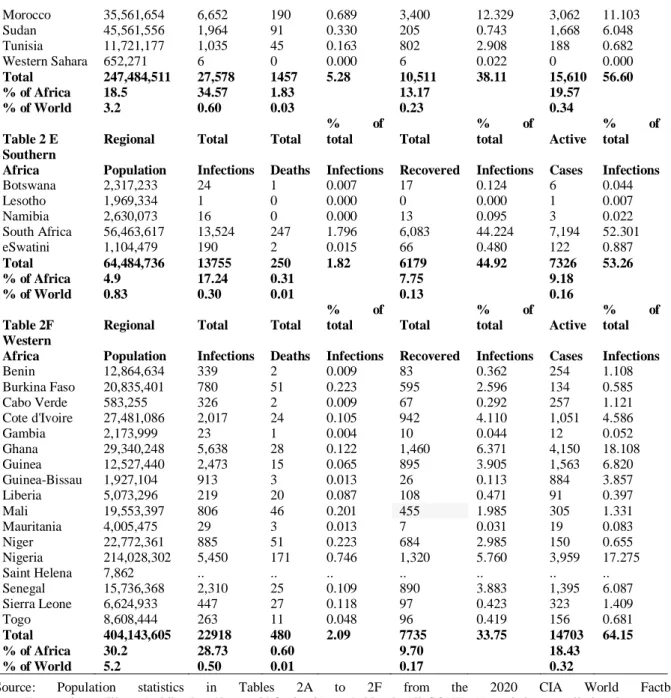
Tables 2A to 2F (in appendix) present COVID-19 infections and death figures for Africa and its five regions as of May 15, 2020. Tables 2A to 2F also present data on those who had recovered from COVID-19, and active cases for Africa and its five regions. As shown, the following countries had 1,000 or more infections: South Africa, 13,524 (17% of total 79,780, but 98.3% of Southern Africa‘s total); Egypt, 11,228 (14.1% of Africa‘s total, but 40.7% of Northern Africa‘s total); Morocco, 6,652 (8.3% of Africa‘s total, but 24.1% of Northern Africa‘s total); Algeria, 6,629 (8.3% of Africa‘s total, but 24% of Northern Africa‘s total); Ghana, 5,628 (7.1% of Africa‘s total, but 24.6% of Western Africa‘s total); Nigeria, 5,450 (6.8% of Africa‘s total, but 23.8% of Western Africa‘s total); Cameroon, 2,954 (3.7% of Africa‘s total, but 39.6% of Middle Africa‘s total); Guinea, 2,473 (3.1% of Africa‘s
total, but 10.8% of Western Africa‘s total); Senegal, 2,310 (2.9% of Africa‘s total, but 10.1% of Western Africa‘s total); Cote d‘Ivoire, 2,017 (2.5% of Africa‘s total, but 8.8% of Western Africa‘s total); Sudan, 1,964 (2.5% of Africa‘s total, but 7.1% of Northern Africa‘s total); Djibouti, 1,309 (1.6% of Africa‘s total, but 16.2% of Eastern Africa‘s total); Democratic Republic of Congo, 1,298 (1.6% of Africa‘s total, but 17.4% of Middle Africa‘s total); Somalia, 1,284 (1.6% of Africa‘s total, but 15.9% of Eastern Africa‘s total); Mayotte, 1,210 (1.5% of Africa‘s total, but 15% of Eastern Africa‘s total); Gabon, 1,209 (1.5% of Africa‘s total, but 16.2% of Middle Africa‘s total); and Tunisia, 1,035 (1.3% of Africa‘s total, but 3.8% of Northern Africa‘s total).
Of the five regions in Africa, Northern Africa had the highest number or proportion of COVID-19 as of May 15, 2020: (27,578 or 34.6% of Africa‘s total), but has 18.5% (247.5 million people) of Africa‘s total population of 1.34 billion; Western Africa, 22,918 (28.73% of Africa‘s total) infections, but 30.2% (404.14 million people) of Africa‘s total population; Southern Africa, 13,755 (17.24% of Africa‘s total) infections, but 4.9% (64.5 million people) of Africa‘s total population; Eastern Africa, 8,071 (10.12% of Africa‘s total) infections, but 32.2% (431 million people) of Africa‘s total population; and Middle Africa, 7,458 (9.35% of Africa‘s total) infections, but 14.5% (193.5 million people) of Africa‘s total population (Tables 2A to 2F in appendix).
Tables 2A to 2F: Africa and Regional African and Country populations 2020, COVID-19 Infections, Deaths, Recovered, and Active Cases Statistics for Africa, African Regions, and African Countries, as of Friday, May 15, 2020
Population Total Total
% of total Total
% of
total Active
% of total Table 2A Total Infections Deaths Infections Recovered Infections Cases Infections
Burundi 11,865,821 15 1 0.001 7 0.009 7 0.009
Comoros 846,281 11 1 0.001 3 0.004 7 0.009
Djibouti 921,804 1,309 4 0.005 935 1.172 370 0.464
Eritrea 6,081,196 39 0 0.000 39 0.049 0 0.000
Ethiopia 108,113,150 287 5 0.006 112 0.140 170 0.213
Kenya 53,527,936 781 45 0.056 284 0.356 452 0.567
Madagascar 26,955,737 238 0 0.000 112 0.140 126 0.158
Malawi 21,196,629 63 3 0.004 24 0.030 36 0.045
Mauritius 1,379,365 332 10 0.013 322 0.404 0 0.000
Mayotte (2010) 231,139 1,210 16 0.020 627 0.786 567 0.711
Mozambique 30,098,197 119 0 0.000 42 0.053 77 0.097
Reunion (2006) 787,584 441 0 0.000 354 0.444 87 0.109
Rwanda 12,712,431 287 0 0.000 177 0.222 110 0.138
Seychelles 95,981 11 0 0.000 10 0.013 1 0.001
Somalia 11,757,124 1,284 53 0.066 135 0.169 1,096 1.374
South Sudan 10,561,244 236 4 0.005 4 0.005 228 0.286
Tanzania 58,552,845 509 21 0.026 183 0.229 305 0.382
Uganda 43,252,966 203 0 0.000 63 0.079 140 0.175
Zambia 17,426,623 654 7 0.009 124 0.155 523 0.656
Zimbabwe 14,546,314 42 4 0.005 13 0.016 25 0.031
Angola 32,522,339 48 2 0.003 17 0.021 29 0.036
Cameroon 27,744,989 2,954 139 0.174 1,553 1.947 1,262 1.582
Central African
Rep. 5,990,855 301 0 0.000 13 0.016 288 0.361
Chad 16,877,357 428 48 0.060 88 0.110 292 0.366
Congo, Rep. 5,293,070 391 15 0.019 87 0.109 289 0.362
Congo (D.R.) 101,780,263 1,298 50 0.063 212 0.266 1,036 1.299
Equatorial
Guinea 836,178
594
7 0.009 22 0.028 565 0.708
Gabon 2,230,908 1,209 10 0.013 219 0.275 980 1.228
Sao Tome &
Principe 211,122 235 7 0.009 4 0.005 224 0.281
Algeria 42,972,878 6,629 536 0.672 3,271 4.100 2,822 3.537
Egypt 104,124,440 11,228 592 0.742 2,799 3.508 7,837 9.823
Libya 6,890,535 64 3 0.004 28 0.035 33 0.041
Morocco 35,561,654 6,652 190 0.238 3,400 4.262 3,062 3.838
Sudan 45,561,556 1,964 91 0.114 205 0.257 1,668 2.091
Tunisia 11,721,177 1,035 45 0.056 802 1.005 188 0.236
Western Sahara 652,271 6 0.000 6 0.008 0 0.000
Botswana 2,317,233 24 1 0.001 17 0.021 6 0.008
Lesotho 1,969,334 1 0 0.000 0 0.000 1 0.001
Namibia 2,630,073 16 0 0.000 13 0.016 3 0.004
South Africa 56,463,617 13,524 247 0.310 6,083 7.625 7,194 9.017
eSwatini 1,104,479 190 2 0.003 66 0.083 122 0.153
Benin 12,864,634 339 2 0.003 83 0.104 254 0.318
Burkina Faso 20,835,401 780 51 0.064 595 0.746 134 0.168
Cabo Verde 583,255 326 2 0.003 67 0.084 257 0.322
Cote d'Ivoire 27,481,086 2,017 24 0.030 942 1.181 1,051 1.317
Gambia 2,173,999 23 1 0.001 10 0.013 12 0.015
Ghana 29,340,248 5,638 28 0.035 1,460 1.830 4,150 5.202
Guinea 12,527,440 2,473 15 0.019 895 1.122 1,563 1.959
Guinea-Bissau 1,927,104 913 3 0.004 26 0.033 884 1.108
Mali 19,553,397 806 46 0.058 455 0.570 305 0.382
Mauritania 4,005,475 29 3 0.004 7 0.009 19 0.024
Niger 22,772,361 885 51 0.064 684 0.857 150 0.188
Nigeria 214,028,302 5,450 171 0.214 1,320 1.655 3,959 4.962
Saint Helena 7,862 .. .. .. .. .. .. ..
Senegal 15,736,368 2,310 25 0.031 890 1.116 1,395 1.749
Sierra Leone 6,624,933 447 27 0.034 97 0.122 323 0.405
Togo 8,608,444 263 11 0.014 96 0.120 156 0.196
Total 1,340,510,300 79780 2639 3.31 30210 37.87 46931 58.83
Table 2B Regional Total Total
% of total Total
% of
total Active
% of total Eastern Africa Population Infections Deaths Infections Recovered Infections Cases Infections
Burundi 11,865,821 15 1 0.012 7 0.087 7 0.087
Comoros 846,281 11 1 0.012 3 0.037 7 0.087
Djibouti 921,804 1,309 4 0.050 935 11.585 370 4.584
Eritrea 6,081,196 39 0 0.000 39 0.483 0 0.000
Ethiopia 108,113,150 287 5 0.062 112 1.388 170 2.106
Kenya 53,527,936 781 45 0.558 284 3.519 452 5.600
Madagascar 26,955,737 238 0 0.000 112 1.388 126 1.561
Malawi 21,196,629 63 3 0.037 24 0.297 36 0.446
Mauritius 1,379,365 332 10 0.124 322 3.990 0 0.000
Mayotte (2010) 231,139 1,210 16 0.198 627 7.769 567 7.025
Mozambique 30,098,197 119 0 0.000 42 0.520 77 0.954
Reunion (2006) 787,584 441 0 0.000 354 4.386 87 1.078
Rwanda 12,712,431 287 0 0.000 177 2.193 110 1.363
Seychelles 95,981 11 0 0.000 10 0.124 1 0.012
Somalia 11,757,124 1,284 53 0.657 135 1.673 1,096 13.579
South Sudan 10,561,244 236 4 0.050 4 0.050 228 2.825
Tanzania 58,552,845 509 21 0.260 183 2.267 305 3.779
Uganda 43,252,966 203 0 0.000 63 0.781 140 1.735
Zambia 17,426,623 654 7 0.087 124 1.536 523 6.480
Zimbabwe 14,546,314 42 4 0.050 13 0.161 25 0.310
Total 430,910,367 8071 174 2.16 3570 44.23 4327 53.61 % of Africa 32.2 10.12 0.22 4.47 5.42 % of World 5.5 0.17 0.00 0.08 0.09
Table 2 C Regional Total Total
% of total Total
% of
total Active
% of total Middle Africa Population Infections Deaths Infections Recovered Infections Cases Infections
Angola 32,522,339 48 2 0.027 17 0.23 29 0.389
Cameroon 27,744,989 2,954 139 1.864 1,553 20.82 1,262 16.921
Central African
Rep. 5,990,855 301 0 0.000 13 0.17 288 3.862
Chad 16,877,357 428 48 0.644 88 1.18 292 3.915
Congo, Rep. 5,293,070 391 15 0.201 87 1.17 289 3.875
Congo (D.R.) 101,780,263 1,298 50 0.670 212 2.84 1,036 13.891
Equatorial
Guinea 836,178
594
7 0.094 22 0.29 565 7.576
Gabon 2,230,908 1,209 10 0.134 219 2.94 980 13.140
Sao Tome &
Principe 211,122 235 7 0.094 4 0.05 224 3.003
Total 193,487,081 7458 278 3.73 2215 29.70 4965 66.57 % of Africa 14.5 9.35 0.35 2.78 6.22 % of World 2.5 0.16 0.01 0.05 0.11
Table 2D Regional Total Total
% of total Total
% of
total Active
% of total Northern
Africa Population Infections Deaths Infections Recovered Infections Cases Infections
Algeria 42,972,878 6,629 536 1.944 3,271 11.861 2,822 10.233
Egypt 104,124,440 11,228 592 2.147 2,799 10.149 7,837 28.418
Morocco 35,561,654 6,652 190 0.689 3,400 12.329 3,062 11.103
Sudan 45,561,556 1,964 91 0.330 205 0.743 1,668 6.048
Tunisia 11,721,177 1,035 45 0.163 802 2.908 188 0.682
Western Sahara 652,271 6 0 0.000 6 0.022 0 0.000
Total 247,484,511 27,578 1457 5.28 10,511 38.11 15,610 56.60 % of Africa 18.5 34.57 1.83 13.17 19.57
% of World 3.2 0.60 0.03 0.23 0.34
Table 2 E Regional Total Total
% of total Total
% of
total Active
% of total Southern
Africa Population Infections Deaths Infections Recovered Infections Cases Infections
Botswana 2,317,233 24 1 0.007 17 0.124 6 0.044
Lesotho 1,969,334 1 0 0.000 0 0.000 1 0.007
Namibia 2,630,073 16 0 0.000 13 0.095 3 0.022
South Africa 56,463,617 13,524 247 1.796 6,083 44.224 7,194 52.301
eSwatini 1,104,479 190 2 0.015 66 0.480 122 0.887
Total 64,484,736 13755 250 1.82 6179 44.92 7326 53.26 % of Africa 4.9 17.24 0.31 7.75 9.18 % of World 0.83 0.30 0.01 0.13 0.16
Table 2F Regional Total Total
% of total Total
% of
total Active
% of total Western
Africa Population Infections Deaths Infections Recovered Infections Cases Infections
Benin 12,864,634 339 2 0.009 83 0.362 254 1.108
Burkina Faso 20,835,401 780 51 0.223 595 2.596 134 0.585
Cabo Verde 583,255 326 2 0.009 67 0.292 257 1.121
Cote d'Ivoire 27,481,086 2,017 24 0.105 942 4.110 1,051 4.586
Gambia 2,173,999 23 1 0.004 10 0.044 12 0.052
Ghana 29,340,248 5,638 28 0.122 1,460 6.371 4,150 18.108
Guinea 12,527,440 2,473 15 0.065 895 3.905 1,563 6.820
Guinea-Bissau 1,927,104 913 3 0.013 26 0.113 884 3.857
Liberia 5,073,296 219 20 0.087 108 0.471 91 0.397
Mali 19,553,397 806 46 0.201 455 1.985 305 1.331
Mauritania 4,005,475 29 3 0.013 7 0.031 19 0.083
Niger 22,772,361 885 51 0.223 684 2.985 150 0.655
Nigeria 214,028,302 5,450 171 0.746 1,320 5.760 3,959 17.275
Saint Helena 7,862 .. .. .. .. .. .. ..
Senegal 15,736,368 2,310 25 0.109 890 3.883 1,395 6.087
Sierra Leone 6,624,933 447 27 0.118 97 0.423 323 1.409
Togo 8,608,444 263 11 0.048 96 0.419 156 0.681
Total 404,143,605 22918 480 2.09 7735 33.75 14703 64.15 % of Africa 30.2 28.73 0.60 9.70 18.43 % of World 5.2 0.50 0.01 0.17 0.32
Source: Population statistics in Tables 2A to 2F from the 2020 CIA World Factbook: https://www.cia.gov/library/publications/the-world-factbook/geos/ml.html; All COVID-19 statistics compiled and computed by
authors from Worldometer on Saturday, May 16, 2020 from:
https://www.worldometers.info/coronavirus/?utm_campaign=homeAdvegas1? people infected. (Tables 2A to 2F in appendix). Of
the 79,780 total infections in Africa in May 2020, 30,210 (37.8%) had recovered: 6,179 (44.92%) out of 13,755 infected in Southern Africa; 3,570 (44.23%) out of 8,071 infected in Eastern Africa; 10,511 (38.1%) out of 27,578 infected in Northern Africa; 7,735 (33.75%) out of 22,918 in Western Africa; and 2,215 (29.7%) out of 7,458 infected in Middle Africa.
Factors responsible for the similarities and
differences in infection and death rates of
COVID-19 in Africa; and the relative low
rates in Africa compared with countries in
Europe, North America and Asia
Some of the factors that may be responsible for fewer cases of COVID-19 and deaths in African countries closer to the equator, than countries in Northern Africa and South Africa in particular, could be similar to the same factors that separate these same African nations and countries in Europe, North America, and Asia. The remaining factors will tend to apply to all African nations versus countries in Europe, North America, and Asia. These factors including the following: low volumes of international tourism to most African nations; high proportion of individuals under the age of 15; low urbanization rates in Africa; relatively low obesity rates in Africa; Africa‘s relatively hot and humid climate; low levels of testing; adequate preparations for COVID-19 by African governments and its people.
Low volumes of international tourists to
African nations
The COVID-19 pandemic originated from the city of Wuhan, the capital of Hubei Province, central China in late December 2019, and spread to Europe and North America by early January 2020. A careful observation of the countries with the highest infection and death rates shows that they have very large volumes of international tourists that they host annually. For example, the following countries located in Europe, North America and Asia are ranked among the top 20 with infections or deaths of COVID-19 as of Friday, May 15, 2020: United States (1,484,285 infections), Spain (274,367 infections), Italy (223,885 infections), United Kingdom (236,711 infections), France (179,506 infections), Germany (175,699 infections), Russia (262,843 infections), Turkey (146,457 infections), China (82,933 infections), Canada (74,613 infections), India (85,784 infections), Belgium (54,644 infections), The Netherlands (43,681 infections), Saudi Arabia (49,176 infections), Switzerland (30,514 infections), and Portugal (28,583 infections).
Compared with most African nations, these nations listed have very large volumes of International tourists.
According to the World Bank, as of 2018, there were 79.75 million tourists that visited the United States; Spain, 82.8 million visitors; Italy, 61.6 million visitors; United Kingdom, 36.3 million visitors; France, 89.3 million visitors; Germany, 38.9 million visitors; Russia, 25.6 million visitors; Turkey, 45.8 million visitors; China, 63 million visitors; Canada, 21.1 million visitors; India, 17.4 million visitors; Belgium, 9.1 million visitors; Saudi Arabia, 15.3 million visitors; the Netherlands, 18.8 million visitors; Switzerland, 10.4 million visitors; and Portugal, 16.2 million visitors16.
visitors (2017 figures); The Gambia, 552,000 visitors; Gabon, 269,000 (2005 figures); Lesotho, 1.2 million visitors; Guinea Bissau, 45,200 visitors (2016 figures); Mauritius, 1.4 million visitors; and eSwatini, 782,000 visitors. For sub-Saharan Africa as a whole, there was a total of 47.63 million visitors in 201716.
It is useful to point out that there is no data provided for Liberia, Somalia, South Sudan. The primary reason is civil war. Libya has been experiencing a civil war since 2011, which is one of the reasons why 2003 tourism figures are presented, and also why its COVID-19 infection numbers are very low. Liberia experienced a very serious civil war that lasted from the 1990s to 2005. Somalia has been experiencing a bloody civil war since the 1990s. South Sudan gained its independence from Sudan in July 2011, after many years of rebellion. Countries that experience civil wars tend to have low numbers of international tourists, because visitors are not certain whether the society has political, economic, and social stability. This economic liability, however, may have contributed to the slow spread of the coronavirus in these African nations, because it is a disease brought into the continent from other continents.
High proportion of individuals under the age
of 15
Age appears to be playing a significant role in the infection and death rates of the COVID-19 pandemic. It has been widely reported in the media across the world and in scholarly journal publications that regardless of geographic location or racial or ethnic backgrounds, the COVID-19 tends to impact the elderly more than young people17-19. According to a study by Wang et al. of coronavirus patients, ―High proportion of severe to critical cases and high fatality rate were observed in the elderly patients with COVID-19‖ (p.639)19. Niu et al. found in their study of COVID-19 patients that: ―The older confirmed patients with COVID-19 infection has a high proportion of severe cases, and the COVID-19 infection was generally susceptible with a relatively high fatality rate in older populations‖18
.
This observation could help to explain the relatively low rates of COVID-19 infections and
deaths in Africa, compared with the nations among the top 20 most impacted by this COVID-19 pandemic mentioned above. For example, of the 50 million people in Spain in July 2020, 15.02% are under the age of 15, 9.9% are aged 15-24, and 18.49% are aged 65 and over; for Italy‘s 62.4 million people as of July 2020, the figures are 13.45%, 9.61, and 22.08% respectively; for the United States‘ 332.6 million people, the figures are 18.6%, 12.91% and 16.85% respectively; For the United Kingdom‘s 65.8 million people, the figures are 17.63%, 11.49%, and 18.48% respectively; for France‘s 67.85 million people, the figures are 18.36%, 11.88%, and 20.46% respectively; for Germany‘s 80.2 million people, the figures are 12.89%, 9.81%, and 22.99% respectively; for Canada‘s 37.7 million people, the figures are 15.99%, 11.14% and 18.98% respectively; for China‘s 1.394 billion people, the figures are 17.29%, 11.48%, and 12.34% respectively; and for Belgium‘s 11.72 million people, the figures are 17.22%, 11.2%, and 19.21% respectively20.
In Africa, as of July 2020, of the 1.34 billion people, 533.5 million (39.8%) are under the age of 15, 18.1% are aged 15-24, and 3.3% are aged 65 and over. The youngest people in the world are in Niger, with 50.58% of its 22.8 million population under the age of 15. Other African nations with 45% or higher are: Uganda, 48.21% out of 43.3 million people; Malawi, 45.87% out of 21.2 million people; Angola, 47.83% out of 32.5 million people; Mali, 47.69% out of 19.6 million people; Chad, 47.43% out of 16.9 million people; the Democratic Republic of Congo, 46.38% out of 101.8 million people; Zambia, 45.74% out of 17.4 million people; Mozambique, 45.57% out of 30.1 million people; and Benin, 45.56% out of 12.9 million people20.
could be a potential factor for more COVID-19 cases in North African countries compared with their counterparts in sub-Saharan Africa20.
Africa‘s youth, which has sometimes been viewed as a liability, because with such a massive number of young people under the age of 15, societies in the continent must educate them, feed them, provide them with healthcare, etc., in this current COVID-19 pandemic appears to be a strength because the data so far illustrates that young people in this age group are not infected as much or even if they are infected, they tend to recover from the disease. Scholars have noted that while rates of infection with coronavirus are lower among the young population in Africa, this does not eliminate the need for vigilance in mitigating infection in this population. For example, Napoli and Nioi point out: ―Interestingly, although the low median age of Africans is expected to be associated with a reduced case fatality rate, the high presence of young adults in Africa does not eliminate the risk of contagion within the population or the possibility of detecting a certain number of cases‖14
.
Low obesity rates in Africa
It has been widely reported that obese individuals are at a disadvantage to fight the COVID-19 disease, primarily due to a number of underlying conditions resulting from being obese21,22 Muscogiuri et al. point out that: ―Until now, there are no data in the literature reporting that subjects with obesity have a higher risk of getting COVID-19; however, since obesity is known to increase the risk of developing severe forms of respiratory failure, it could be hypothesized that subjects with obesity could be at risk of serious illness if infected. … it was observed that 72.1% of 775 patients with confirmed COVID-19 were overweight or obese and that among patients with BMI > 30 who had undergone intensive care, 60.9% of them died‖21
. According to Zheng et al.: ―The presence of obesity in MAFLD [metabolic associated fatty liver disease] patients was associated with a ~6-fold increased risk of severe COVID-19 illness…. Notably, this association with obesity and COVID-19 severity remained significant… even after adjusting for age, sex,
smoking, diabetes, hypertension, and dyslipidaemia‖22
.
In 2016, the adult obesity prevalence rate in the United States was 36.2%; Canada, 29.4%; United Kingdom, 27.8%; Spain, 23.8%; Russia, 23.1%; Germany, 22.3%; Belgium, 22.1%; France, 21.6%; and Italy, 19.9 percent. In Africa, the obesity adult prevalence rates are very low for most of the countries, especially in sub-Saharan Africa. However, the figures are relatively higher in countries in Northern Africa and Southern Africa, especially South Africa, which could be a potential factor for their relatively high COVID-19 cases. For example, as of 2016, the adult obesity prevalence rate in Ethiopia was 4.5%; Eritrea, 5%; Madagascar and Uganda each, 5.3%; Burundi, 5.4%; Niger, 5.5%; Burkina Faso, 5.6%; Malawi and Rwanda each, 5.8%; Chad, 6.1%; South Sudan, 6.6% (2014 figures); Democratic Republic of Congo, 6.7%; Kenya, 7.1%; Mozambique, 7.2%; Central African Republic, 7.5%; Guinea, 7.7%; Comoros, 7.8%; Equatorial Guinea, 8%; Zambia, 8.1%; Angola, 8.2%; Somalia, 8.3%; Tanzania and Togo each, 8.4%; Mali, 8.6%; Sierra Leone, 8.7%; Senegal, 8.8%; Nigeria, 8.9%; Guinea-Bissau, 9.5%; Benin and the Republic of Congo each, 9.6%; Liberia, 9.9%; Cote d‘Ivoire and The Gambia each, 10.3%; Mauritius, 10.8%; Ghana, 10.9%; Cameroon, 11.4%; Carbo Verde, 11.8%; Sao Tome & Principe, 12.4%; Mauritania, 12.7%; Djibouti, 13.5%; Seychelles, 14%; Gabon, 15%; and Zimbabwe, 15.5 percent. For Northern African countries, the obesity figures are slightly higher: Libya, 32.5%; Egypt, 32%; Algeria, 27.4%; Tunisia, 26.9%; Morocco, 26.1%; and Sudan, 6.6% (2014 figures). For Southern African countries, the obesity figures are also slightly higher: South Africa, 28.3%; Botswana, 18.9%; Namibia, 17.2%; Lesotho, 16.6%; and eSwatini, 16.5 percent20.
economically that this leads to excess caloric consumption which in turn leads to obesity and obesity-related conditions. The low obesity rates prevalent in most countries, including those in Africa, indicate that these populations consume fewer total calories on a daily basis. However, this has turned out to be a good development with COVID-19. It is useful to note that there are wealthy nations that still manage to carefully monitor caloric consumption so as not to become overweight. In Japan, the obesity rate in 2016 was 4.3% and 4.7% in South Korea20. This sends a message to these African nations with relatively low rates to try to maintain them even as they become wealthy or developed societies.
Low rates of urbanization in African
countries
What has been regularly considered a liability for Africans in Africa might now turn to be a strength in the continent‘s attempt to avoid the worst effect of the spread of COVID-19 – slow urbanization in Africa. High rate of urbanization for a country is seen as a good indicator for modernization and economic development23,24 This has now turned out to be a big liability for the countries mentioned above that are the most negatively impacted by the coronavirus pandemic mentioned above. Their relatively high rates of urbanization have resulted in the rapid spread of the coronavirus, partly because such countries have many large cities where residents use public transportation such as buses, rails/trains in underground subways, and massive high-rise public and private housing buildings, with hundreds and thousands of residents.
For example, the urban population as a proportion of the total population in the United States, as of 2020, is 82.7%, with a rate of urbanization (annual rate of change) from 2015-2020 of 0.95%; United Kingdom, 83.9% and 0.9% respectively; Canada, 81.6% and 0.97% respectively; France, 81% and 0.72% respectively; China, 61.4% and 2.42% respectively; Italy, 71% and 0.29% respectively; Spain, 80.8% and 0.33% respectively; Germany, 77.5% and 0.27% respectively; Russia, 74.8% and 0.18% respectively; Turkey, 76.1% and 2.04% respectively; Saudi Arabia, 84.3% and 2.17%
respectively; Belgium, 98.1% and 0.62% respectively; the Netherlands, 92.2% and 0.74% respectively; and Switzerland, 73.9% and 0.88% respectively20.
In contrast, African nations have continued to experience slow urbanization, and some studies even tend to show declines in urbanization rates for some countries24-26. At 11.635 million square miles, Africa is such a massive continent that its 1.34 billion people inhabiting it seem to be a small number for its size. According to Cohen, in 1950, Africa‘s urban population was 33 million (14.9% of Africa‘s total population and 4.5% of world urban population); Asia, 232 million (16.6% of Asia‘s total population and 31.7% of world urban population); Europe, 280 million (51.2% of Europe‘s total population and 38.2% of world urban population); and Northern America, 110 million (63.9% of total population of Northern America and 15% of world urban population). In 2000, for Africa, the figures were 295 million, and 37.1% and 10.3% respectively; Asia, 1.367 billion, and 37.1% and 47.8% respectively; Europe, 529 million, and 72.7% and 18.5% respectively; and Northern America, 250 million, and 79.1% and 8.8% respectively24.
Among African countries, the Northern African and Southern African countries tend to have higher percentages of urbanization. In Northern Africa, although the countries‘ percentage of urbanization rates are generally higher, Egypt and Sudan had <50% (42.8%, with an urbanization rate of 1.86% in Egypt and 35.3% and 3.17% respectively in Sudan); 80.7%, with an urbanization rate of 1.68% in Libya; 73.7% and 2.46% respectively in Algeria; 69.6% and 1.53% respectively in Tunisia; 63.5% and 2.14% in Morocco respectively. In Southern Africa, Lesotho has 29% and 2.83% r espectively; 52% and 4.2% respectively in Na mibia; 67.4% and 1.97% r espect ively in South Africa; and 70.9% and 2.87% respect ivel y in Botswa na2 0.
52.1% and 3.41% r espectively in Liber ia; 55.3% and 4.28% r espect ively i n Mauritania; 57.3% a nd 3.34% respect ivel y in Ghana; 57.6% and 3.63% respect ively i n Camer oon; 62.6% and 4.07% respect ivel y in Ga mbia; 66.8% and 4.32% respect ivel y
in Angola; and 67.8% and 3.28%
respectively in R epublic of C ongo20.
For sub-Saharan African countries with <50% percentages of urbanization, the figures are as follows: 13.7% a nd 5.68% r espect ively i n Burundi; 16.6% and 4.27% r espectively i n Niger; 17.4% a nd 4.19% r espect ively i n Malawi; 17.4% and 2.86% respect ively i n Rwanda; 20.2% and 4.1% respect ively i n
Sout h Suda n; 21.7% and 4.63%
respectively in Ethiopia; 23.5% and 3.88% respectively in Cha d; 24.2% and 2.46% respectively in eS watini; 25% and 5.7% respectively in Uga nda; 28% and 4.23 % respectively in Kenya; 30.6% and 4.99% respectively in Bur kina Faso; 32.2% and 2.19% respectively in Zimbabwe; 35.2% and 5.22% respect ively in Tanzania2 0.
These low urbanization percentages in most African countries, in addition to the continent being very vast may have helped to slow the spread of the coronavirus. The countries impacted the most right now tend to also be highly urbanized, which results in very congested cities and towns. It is in such environments that the coronavirus tends to be very effective in spreading among people in public transportation, such as buses and trains27.
Hot temperatures and high humidity in most
African countries
Scholars have pointed out that viruses, including those within the coronavirus family tend to have less success infecting people in regions that have high temperatures and high humidity. Some of these scholars have used Africa, especially countries closer to the equator as an example. The viruses, however, are more successful in spreading in cooler regions of the world. Most of the countries hardest hit by the current COVID-19 tend to have cold and long winters or temperate climate.
Even in Italy and Spain, two southern European nations, the coronavirus is more prevalent in the
northern and cooler regions of those countries14,28-33.
According to Napoli and Nioi: ―Surprisingly, the historical data relating to SARS-CoVs and MERS-CoV epidemics reveal a limited or no dissemination of these disorders in African countries, despite the limitations of the health system and the geographical continuity of the two outbreaks… Similarly, very recent data concerning the spread of COVID-19 in Africa describe a much smaller than expected number of cases, particularly when considering the vulnerability of this population‖14. Araújo and Naimi point out that: ―Our models fitted on the existing pattern of spread between January and March 2020, support the view that incidence of the virus could follow a seasonal climate pattern with outbreaks generally being favored by cool and dry weather, while being slowed down by extreme conditions of both cold and heat as well as moist33. Xu et al. point out that: ―Combining one of the most comprehensive datasets of COVID-19 transmission to date with weather data across the world, this paper provides evidence for the association of various meteorological variables with the spread of COVID-19…. We find a stronger effect… for temperatures above 25 °, the relatively mild slope of temperature effect below 25 degrees suggests many temperate zones with high population density may face larger risks, while some warmer areas of the world may experience slower transmission rates. For example, the estimated associations may partially explain the smaller sizes of outbreaks in southern Asia and Africa to date‖32
.
Low levels of testing
Low levels of testing have been an issue in most countries worldwide. Even in wealthier countries such as the United States, Germany and the United Kingdom testing only accounts for a fraction of those countries total populations and as such does not accurately reflect the number of existing cases of COVID-19. It is also important to note that although Africa as a whole has lower rates of testing than wealthier countries of the world, there are at least two notable exceptions, Mauritius (108,353 tests per 1 million) and Djibouti (40.878 tests per 1 million), that have higher rates of testing than many wealthier countries (see Table 3A in appendix).
Tables 3A and 3B present population figures, total coronavirus tests, and tests per 1 million of the population for African countries and selected countries as of June 12, 2020. Of the 58 African countries and entities in Table 3A, total coronavirus tests and tests per 1 million of population were available for 45 of them. In Table 3B, total tests and tests per 1 million of population were not available for China. Although the United States had the highest number of total tests (23.79 million), its tests per 1 million of its population (71,900) was lower than figures for Russia: 97,434 (14.22 million total tests); Spain, 95,507 and 4.47 million respectively; United Kingdom, 94,811 and 6.43 million respectively; and Belgium, 86,025 and 996,785 respectively. Although France is a wealthy nation of 65.2 million people, it only had 1.38 million total tests and 21,215 tests per 1 million people (Tables 3A and 3B).
African countries and entities have lower overall total tests and tests per 1 million people, with the 45 countries and entities with available data accounting for 3.088 million total tests. This is the case even with South Africa, which had the highest number of total tests: 1.06 million and 17,892 tests per 1 million of its population respectively. It is useful to point out that Mauritius had a higher rate of tests per 1 million of its population, 108,353 (137,789 total tests) than all of the selected nations listed in Table 3B, including Russia, Spain, United Kingdom, Belgium, United States, Italy (74,661), Germany (56,035), and Canada (54,926). Djibouti‘s tests per
1 million of its population of 40,878 is higher than the rate for France. Apart from South Africa and Mauritius, the following countries have 100,000 or more total tests: Morocco, 389,142 (10,549 tests per 1 million people); 242,218 and 7,804 respectively for Ghana; 170,860 and 1,488 respectively for Ethiopia; 135,00 0 and 1,321 respectively for Egypt; 111,436 and 2,441 respectively for Uganda; and 108,666 and 2,023 respectively for Kenya. Nigeria had 88,432 total tests, with 430 tests per 1 million people (Tables 3A and 3B).
Proactive policies and preparation by
African governments and people
Tables 3A and 3B: Populations of African Countries, Selected Countries, Total Coronavirus tests, and Tests per 1 Million of Population, as of Friday, June 12, 2020
Table 3A Population
Tests per 1 million
Total
Total Tests
of
population
Burundi 11,868,767 382 32
Comoros 868,536 .. ..
Djibouti 987,227 40,356 40,878
Eritrea 3,543,797 .. ..
Ethiopia 114,794,517 170,860 1,488
Kenya 53,702,760 108,666 2,023
Madagascar 27,648,383 15,148 548
Malawi 19,100,310 6,690 350
Mauritius 1,271,669 137,789 108,353 Mayotte (2010) 272,427 8,800 32,302 Mozambique 31,201,863 16,919 542 Reunion (2006) 894,993 17,200 19,218
Rwanda 12,933,152 85,613 6,620
Seychelles 98,317 .. ..
Somalia 15,866,124 .. ..
South Sudan 11,186,857 3,356 300
Tanzania 59,629,682 .. ..
Uganda 45,649,727 111,436 2,441
Zambia 18,352,460 28,236 1,539
Zimbabwe 14,851,276 52,905 3,562
Angola 32,801,945 10,000 305
Cameroon 26,506,586 .. ..
Central African
Rep. 4,825,119 18,921 3,921
Chad 16,396,849 .. ..
Congo, Rep. 5,510,035 .. ..
Congo (D.R.) 89,391,169 .. .. Equatorial
Guinea 1,400,039 8,268 5,906
Gabon 2,222,650 19,517 8,781
Sao Tome &
Principe 218,931
1,354
6,185
Algeria 43,806,931 .. ..
Egypt 102,226,041 135,000 1,321
Libya 6,866,309 11,765 1,713
Morocco 36,887,633 389,142 10,549
Sudan 43,789,277 401 9
Tunisia 11,812,229 57,273 4,849 Western Sahara 596,469 .. .. Botswana 2,348,927 26,800 11,409
Lesotho 2,141,394 1,515 707
Namibia 2,538,340 5,514 2,172
South Africa 59,269,206 1,060,425 17,892
eSwatini 1,159,544 6,551 5,650
Benin 12,104,097 45,637 3,770
Burkina Faso 20,868,398 .. ..
Cabo Verde 555,674 1,307 2,352
Cote d'Ivoire 26,339,495 35,179 1,336
Gambia 2,412,511 1,970 817
Ghana 31,035,817 242,218 7,804
Guinea 13,111,180 14,407 1,099
Guinea-Bissau 1,965,269 1,500 763
Liberia 5,050,706 .. ..
Mali 20,214,891 3,483 172
Mauritania 4,642,299 7,654 1,649
Niger 24,148,953 6,252 259
Nigeria 205,836,204 88,432 430
Saint Helena .. .. ..
Senegal 16,717,343 58,003 3,470 Sierra Leone 7,967,746 .. ..
Togo 8,267,347 24,802 3,000
Total 1,338,676,397 3087646 Table 3B Population
Tests per 1 million
Selected
Countries Total
Total Tests
of
population
United States 330,906,997 23,792,191 71,900 Spain 46,753,936 4,465,338 95,507 Italy 60,465,875 4,514,441 74,661 United
Kingdom 67,868,549 6,434,713 94,811 France 65,266,664 1,384,633 21,215 Germany 83,771,107 4,694,147 56,035
China 1,439,323,776 .. ..
Canada 37,725,348 2,072,096 54,926 Belgium 11,587,177 996,785 86,025 India 1,379,307,780 5,363,445 3,889 Russia 145,931,552 14,218,674 97,434 Source: Compiled and computed by authors from Worldometer on Saturday, June 13, 2020 from: https://www.worldometers.info/coronavirus/?utm_campaign= homeAdvegas1?
As Okonofua et al. observe: ―The attempts to restrain the COVID-19 have had most interesting moments in the African continent. For many countries where politicians have often paid lip services to public health, it has been refreshing to see heads of governments and key officials lead the campaign against the virus in many countries. Health funding that had hitherto been restricted to a few privileged cases are being made available, and donations are coming from philanthropists from within the continent rather than from outside‖37
.
Conclusion
relatively smaller numbers of international tourists when compared with countries in Europe and North America. Even within Africa, Northern African nations and South Africa host a lot more tourists than most other sub-Saharan African nations. However, for this particular COVID-19 pandemic, this ‗liability‘ has turned out to be very helpful, in reducing the spread of the disease. Africa‘s youth and lower obesity rate may have also contributed to the lower incidence of COVID-19 since older persons and obese individuals are more susceptible to severe illness from COVID-19. Low urbanization rates in Africa, as well as the vast land may also have helped to slow down the spread of COVID-19.
Finally, African governments and people had time to observe how devastating COVID-19 had been in countries such as China, Italy, Spain and the United States. This resulted in African governments and people taking proactive measures or actions to slow the spread of the coronavirus. Without these measures or actions the total number of infections by May 15, 2020 could have been in the hundreds of thousands or more, instead of 79,780.
Contribution of Authors
Amadu J. Kaba conceived the initial idea and discussed with Andzi Nkweti Kaba. They both selected the factors used in the paper. Both authors compiled and computed all the data in the study. Both authors wrote the entire paper.
References
1. World War One: Casualty and Death Tables. PBS: The Great War. 2020. Retrieved on May 7, 2020 from: https://www.uwosh.edu/faculty_staff/henson/188/W WI_Casualties%20and%20Deaths%20%20PBS.ht ml
2. Fregert K. The Costs and Finances of World War I According to Eli F. Heckscher. Œconomia 2016; 6 (4): 515-524.
3. Research Starters: Worldwide Deaths in World War II. The National World War II Museum. New Orleans. 2020. Retrieved on May 7, 2020 from: https://www.nationalww2museum.org/students-
teachers/student-resources/research- starters/research-starters-worldwide-deaths-world-war
4. Weissman AD. Pivotal Politics – The Marshall Plan: A Turning Point in Foreign Aid and the Struggle for
Democracy. The History Teacher 2013; 47 (1): 111-129.
5. Johnson NA. The 1918 Flu Pandemic and its Aftermath.
Evolution: Education and Outreach 2018; 11 (5): 2. 6. Heaton M and Falola T. Global Explanations versus
Local Interpretations: The Historiography of the Influenza Pandemic of 1918-1919 in Africa. History in Africa 2006; 33: 208, 214, 223, 214.
7. Humphris MO. Paths of Infection: The First World War and the Origins of the 1918 Influenza Pandemic.
War in History 2014; 21 (1): 55. 8. Lunn JH. War Losses (Africa). International
Encyclopedia of the First World War. 2017, January 8. Retrieved on May 15, 2020 from:
https://encyclopedia.1914-1918-online.net/article/war_losses_africa.
9. Rathbone R. World War I and Africa: Introduction. The Journal of African History 1978; 19 (1): 1. 10. Morrow Jr. J. H. Black Africans in World War II: The
Soldiers‘ Stories. The Annals of the American Academy of Political and Social Science 2010; 632: 13.
11. Pallaver K. Organization of War Economies (Africa). International Encyclopedia of the First World War. 2015, September 17. Retrieved on May 15, 2020 from: https://encyclopedia.1914-1918-online.net/article/organization_of_war_economies_ africa
12. Adekunle I A, Onanuga A T, Akinola OO and
Ogunbanjo OW. Modelling spatial variations of coronavirus disease (COVID-19) in Africa. Science of the Total Environment 2020; 729: 1-4.
13. Berhan Y. Will Africa be Devastated by Covid-19 as Many Predicted? Perspective and Prospective.
Ethiopian Journal of Health Sciences 2020; 30 (3): 459-467.
14. Napoli PE and Nioi M. Global Spread of Coronavirus Disease 2019 and Malaria: An Epidemiological Paradox in the Early Stage of a Pandemic. Journal of Clinical Medicine 2020; 9 (4): 4, 2.
15. Gilbert M, Pullano G, Pinotti F, Valdano E, Poletto C, Boëlle P Y, D'Ortenzio E, Yazdanpanah Y, Eholie SP, Altmann M, Gutierrez B, Kraemer, MUG and Colizza V. Preparedness and vulnerability of African countries against importations of COVID-19: a modelling study.
Lancet 2020; 395 (10227): 871-877.
16. International tourism, number of arrivals. World Bank. 2020. Retrieved on May 13, 2020 from: https://data.worldbank.org/indicator/ST.INT.ARVL ?view=map.
17. Mustafa F and Green R J. The implications of COVID- 19 for the children of Africa. SAMU: South African Medical Journal 2020; 110 (6):
18. Niu S, Tian S, Lou J, Kang X, Zhang L, Lian H and Zhang J. Clinical characteristics of older patients infected with COVID-19: A descriptive study.
Archives of Gerontology and Geriatrics 2020; 89: 4.
Based on 4-week Follow-up. Journal of Infection
2020; 80 (6):639; also see Liu K, Chen Y, Lin R and Han K. Clinical features of COVID-19 in elderly patients: A comparison with young and middle-aged patients. Journal of Infection 2020; 80(6): e14‐e18.
20. Compiled and computed from the 2020 CIA World
Factbook. Available at:
https://www.cia.gov/library/publications/the-world-factbook/.
21. Muscogiuri G, Pugliese G, Barrea L, Savastano S and Colao A. Obesity: The ―Achilles Heel‖ for COVID-19? Metabolism 2020; 108: 2.
22. Zheng KI, Gao F, Wang XB, Sun QF, Pan KH, Wang TY, Ma HL, Chen YP, Liu WY, George J and Zheng MH. Obesity as a Risk Factor for Greater Severity of COVID-19 in Patients with Metabolic Associated Fatty Liver Disease. Metabolism
Clinical and Experimental 2020; 108: 1.
23. Arku G. Rapidly Growing African Cities Need to Adopt Smart Growth Policies to Solve Urban Development Concerns. Urban Forum 2009; 20 (3): 253–270.
24. Cohen B. Urbanization in Developing Countries: Current Trends, Future Projections, and Key Challenges for Sustainability. Technology in Society 2006; 28 (1-2): 70.
25. Potts D. Whatever Happened to Africa‘s Rapid
Urbanisation? Africa Research Institute. London, England. 2012, February 15. Retrieved on May 10,
2020 from:
https://www.africaresearchinstitute.org/newsite/pod
cast/whatever-happened-to-africas-rapid-urbanisation-2/.
26. Potts D. The Slowing of sub-Saharan Africa‘s
Urbanization: Evidence and Implications for Urban Livelihoods Environment & Urbanization 2009; 21 (1): 253-259.
27. Zhao S, Zhuang Z, Ran J, Lin J, Yang G, Yang L and He D. The association between domestic train transportation and novel coronavirus (2019-nCoV) outbreak in China from 2019 to 2020: A data-driven correlational report. Travel Med Infect Dis. 2020 Jan-Feb; 33: 1-3.
28. Becchetti L, Conzo G, Conzo P and Salustri F.
Understanding the heterogeneity of adverse COVID-19 outcomes: the role of poor quality of air and lockdown decisions,‖ 2020, April 15; Available
at SSRN 3572548.
https://papers.ssrn.com/sol3/papers.cfm?abstract_id =3572548.
29. Briz-Redón Álvaro and Serrano-Aroca Á. A spatio- temporal analysis for exploring the effect of temperature on COVID-19 early evolution in Spain.
Science of the Total Environment 2020; 728: 1-7.
30. Hunter P. The Spread of the COVID-19 Coronavirus: Health Agencies Worldwide Prepare for the Seemingly Inevitability of the COVID-19 Coronavirus Becoming Endemic. EMBD Reports
2020; 21 (4) e50334: 1-3.
31. Memarzadeh F. Literature Review of the Effect of Temperature and Humidity on Viruses. ASHRAE Transactions 2012; 118 (1):1049-1060.
32. Xu R, Rahmandad H, Gupta M, Ghaffarzadegan N, DiGennaro C, Amini H and Jalali MS. Weather Conditions and COVID-19 Transmission: Estimates and Projections. medRxiv 2020, May 12; Page 10. Available
at:https://projects.iq.harvard.edu/files/covid19/files/ weather_and_covid-19_preprint.pdf
33. Araújo MH and Naimi B. Spread of SARS-COV-2 Coronavirus Likely Constrained by Climate. medRxiv 2020;7-8. Available at: https://www.medrxiv.org/content/10.1101/2020.03. 12.20034728v3.full.pdf
34. Balogun JA. Lessons from the USA Delayed Response to the COVID-19 Pandemic. African Journal of Reproductive Health 2020; 24 (1): 14-21.
35. Iken O, Abakporo U, Ayobami O and Attoye T. COVID- 19: Travel health and the implications for sub -Saharan Africa. Travel Medicine and Infectious Disease 2020; 1-4. Doi:
oi: 10.1016/j.tmaid.2020.101645.
36. Kapata N, Ihekweazu C, Ntoumi F, Raji T, Chanda- Kapata P, Mwaba P, Mukonka V, Bates M, Tembo J, Corman V, Mfinanga S, Asogun D, Elton L, Arruda LB, Thomason MJ, Mboera L, Yavlinsky A, Haider N, Simons D, Hollmann L, Lule SA, Veas F, Abdel Hamid MM, Dar O, Edwards S, Vairo F, McHugh TD, Drosten C, Kock R, Ippolito G and Zumla A. Is Africa prepared for tackling the COVID-19 (SARS-CoV-2) epidemic. Lessons from past outbreaks, ongoing pan-African public health efforts, and implications for the future.
International Journal of Infectious Diseases 2020; 93: 233-236.
37. Okonofua FE. Eimuhi KE and Omonkhua AA. COVID- 19: Perspectives and Reflections from Africa.
African Journal of Reproductive Health. 2020; 24 (1): 10.
38. Nkengasong JN and Mankoula W. Looming threat of COVID-19 infection in Africa: act collectively, and fast. Lancet 2020; 395 (10227): 841-842.
39. Nuwagira E and Muzoora C. Is Sub-Saharan Africa prepared for COVID-19? Tropical Medicine & Health 2020;48 (1): 1-3.