IJART- Vol-4, Issue-4, August, 2019 Available online at http://www.ijart.info/ DOI: https://doi.org./10.24163/ijart/2017/4(4):65-71
65 Kaushal et al., 2019 INTERNATIONAL JOURNAL OF APPLIED RESEARCH AND TECHNOLOGY
ISSN 2519-5115 RESEARCH ARTICLE
Process Optimization and Preparation of Guava Nectar Blended with
Aloevera
1Gurkirat Singh 2Naveet Kaushal 3Dilip Singh Kachwaya 4Arshdeep Singh
Department of Agriculture, Mata Gujri College, Fatehgarh Sahib, Punjab-140406
Corresponding author:
Naveet Kaushal
Received: July 27, 2019 Revised: Aug 17, 2019 Published: Aug 31, 2019
ABSTRACT
The present investigation was carried out in laboratory, Department of Agriculture, Mata Gujri College, Fatehgarh Sahib, Punjab during Winter Season of 2018-19.Guava nectar blend with aloevera different blending proportions possess significant differences in all nutritional as well as sensory quality parameters. Results depict that there was slight increase in total soluble solids and acidity, reducing sugars but, slight decrease in pH, total sugars, ascorbic acid and antioxidant activity during storage of 90 days. The blended guava nectar prepared using different proportion of guava and aloevera juice or pulp maximum score (9) in blend using T4 (70 ml guava and 30 ml aloevera), score for color, taste, aroma and overall acceptability. During storage period of three months, no microbial counts were observed in blended guava nectar. Overall findings of investigation revealed that blended guava nectar can successfully be stored for 3 months in glass bottles with minimum changes in chemical, sensory and microbial quality.
Keywords-: Guava, Aloevera, Storage studies, Nectar,
IJART- Vol-4, Issue-4, August, 2019 Available online at http://www.ijart.info/ DOI: https://doi.org./10.24163/ijart/2017/4(4):65-71
INTRODUCTION
Guava (Psidium guajava L.) belongs to Myrtaceae family is popularly known as'poor man's apple of the tropics, has a long history of traditional use for a wide range of ailments. It is a low evergreen tree or shrub 6 to 25 feet high, with wide-spreading branches and square, downy twigs. It is a native of tropical America. Guava is a tropical and semitropical plant. It is well known in the islands for its edible fruit. It is common in the backyards (Joseph and Priya, 2011). It has been in cultivation in India since early 17th century and gradually became a crop of commercial importance. It is available throughout the year except during the summer season. Guava fruit is known for its ‘Vitamin-C’, minerals like calcium, iron and phosphorous with pleasant aroma and flavor (Dhaliwal and Dhillon, 2003). The leaves of aloevera contain protein (3.2 g), fibre (15.2 g), iron (9.4 g) and also contains good amount of vit. B12,
vit. C, E and carotene - a precursor or vitamin A. Aloevera has a wide range of medicinal applications immune response against cancer. Sangeetha et al. (2005) blended aloe juice in combination with lime juice, pineapple, papaya, grape, and tomato pulps. Aloevera extract and fruit juices in the ratio of 1:1 were found most acceptable. Zhi et al. (2008) produced a health care compound juice containing aloevera and apple, a new type of juice, which was not as bitter as pure aloevera juice and proved to have increased nutritional value.
At present, there is increasing demand for the fat free, low calorie and new emerging foods to prevent us from various degenerative diseases. Keeping all these facts in view, the urgent need was felt to standardize guava and aloevera blended health drink (Nectar) for the benefit of masses in general and sufferers in particular to lead a healthy normal life without sacrificing their taste perception but combining sensory and
nutritional properties (Lavanya et al., 2018)
MATERIAL AND METHODS
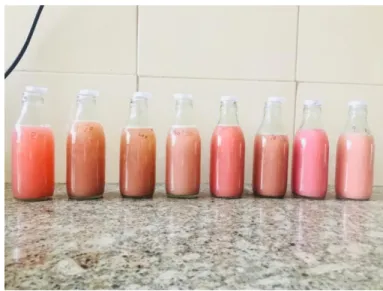
The experiment was carried out at laboratory of department of agriculture, Mata Gujri College, Fatehgarh Sahib, Punjab in the year 2018-19. The collection of guava (cv. Allahabad Safeda) fruits was done from the orchard of Aham Khas Bhag Fatehgarh Sahib (Punjab).The experiment was laid out in a Completely Randomized Design (CRD) with three replication. The experiment comprised 9 treatments and Juice/ pulp from guava and aloevera were extracted by grating the slips/ fruits following extraction by using crusher & screw type juice extractor and pulper. Produce juice/ pulp after extraction and filtration were blended in ratio of [T1
-100 ml : 0 ml, T2-90 ml : 10 ml, T3-80
ml : 20 ml, T4-70 ml : 30 ml, T5-60 ml :
40 ml, T6-150 ml : 50 ml, T7-40 ml : 60
ml, T8-30 ml : 70 ml and T9-20 ml : 80
ml (Guava: Aloevera)] and TSS (25°B) maintained with 0.30% acidity followed by heated at 95°C for 5 min. Immediately after pasteurization, the health drink was packed in 200 ml pre-sterilized glass bottles followed by processing in boiling water for 30 min at 96±1°C. The samples followed by
labeling were analyzed for
IJART- Vol-4, Issue-4, August, 2019 Available online at http://www.ijart.info/ DOI: https://doi.org./10.24163/ijart/2017/4(4):65-71
for commercial products. Sensory attributes like appearance, colour, flavour, taste etc. were scored individually. Numerical scores were assigned to each attribute (Peryam and Pilgrim, 1957). A five point scale was adopted to score each of attribute. While scoring highest score (9) was assigned to most preferred characteristic and least score (1) to the least desired. The overall rating was obtained by calculating the average of the scores.
RESULTS AND DISCUSSION
It was observed from Table 1 that TSS of blended guava nectar increased significantly from 19.93 to 21.66°B after three month storage, with the minimum TSS (20.64) in blended guava nectar prepared using T9 (20 ml
guava and 80 ml of aloevera) and the maximum TSS (20.81) in blend using T1
(100 ml guava and 0 ml aloevera), which is statistically followed with T2 (90 ml
guava and 10 ml aloevera) value of 20.80 and T3 (80 ml guava and 20 ml
aloevera) value of 20.80. The increase in TSS might be due to inversion of polysaccharides like starch and cellulose into simpler soluble molecules in the presence of organic acid (Sudhindra et al., 2012).
Titrable acidity of guava nectar varied significantly from 0.29 % to 0.37 % after three month storage has been presented in Table 1, with minimum acidity (0.29 %) in blended guava nectar prepared using T9 (20 ml guava
and 80 ml of aloevera) and the maximum acidity (0.38 %) in blend using T1 (100 ml guava and 0 ml
aloevera), which is statistically followed with T2 (90 ml guava and 10
ml aloevera) value of 0.36 % and T3 (80
ml guava and 20 ml aloevera) value of 0.35 %. The increase in acidity might be due to formation of organic acid by degradation of ascorbic acid during storage of guava-jamun blended beverage as explained by Sharma et al.
(2009) and Choudhari et al. (2008).
From table 2 mean pH varied significantly decrease from 4.66 to 4.57 during three month storage, with minimum pH (4.58) in blended guava nectar prepared using T9 (20 ml guava
and 80 ml of aloevera) and maximum pH (4.65) in blend using T1 (100 ml
guava and 0 ml aloevera), which is statistically followed with T2 (90 ml
guava and 10 ml aloevera) value of 4.64 and T3 (80 ml guava and 20 ml
aloevera) value of 4.64. During processing of pulp, the pH decreased and total acidity increased. The difference might be due to the breakdown of pectin by pectolytic enzymes. The slight decrease in ph might have been to buffering capacity of guava pulp and nectar. These are in conformity with the findings of Dubey
et al. (2011) and Choudhari et al.
(2008).
The total sugars significantly increased from 31.76 % to 33.53 % after three month storage has been presented in Table 2, with minimum total sugar (31.33 %) in blended guava nectar prepared using T9 (20 ml guava and 80
ml of aloevera) and maximum total sugar (33.56 %) in blend using T1 (100
ml guava and 0 ml aloevera), which is statistically followed with T2 (90 ml
guava and 10 ml aloevera) value of 33.43 % and T3 (80 ml guava and 20 ml
aloevera) value of 33.21 %. This slight increase in total sugars during storage might be due to acid hydrolysis of polysaccharides as reported by Sudhindra et al. (2012).
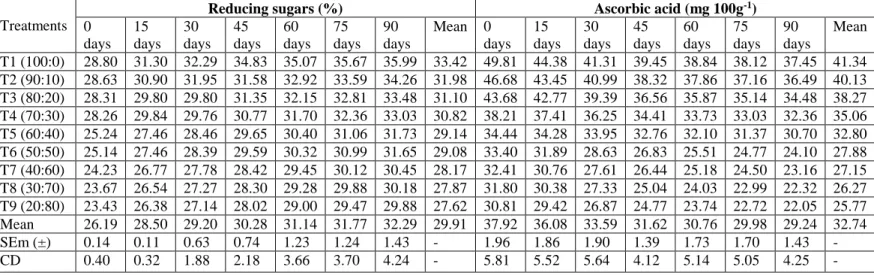
Reducing sugars increased significantly from 26.19 % to 32.29 % after three month storage has been presented in Table 3, with minimum reducing sugar (27.62 %) in blended guava nectar prepared using T9 (20 ml
guava and 80 ml of aloevera) and maximum reducing sugar (33.42 %) in blend using T1 (100 ml guava and 0 ml
aloevera), which is statistically followed with T2 (90 ml guava and 10 ml
aloevera) value of 31.98 % and T3 (80
IJART- Vol-4, Issue-4, August, 2019 Available online at http://www.ijart.info/ DOI: https://doi.org./10.24163/ijart/2017/4(4):65-71
31.10 %, respectively. During processing of pulp, the pH decreased and total acidity increased. The difference might be due to the breakdown of pectin by pectolytic enzymes. The slight decrease in pH might have been to buffering capacity of guava pulp and nectar. These are in conformity with the findings of Dubey et al. (2011) and Choudhari et al. (2008).
From table 3, it can be conferred that ascorbic acid varied significantly decrease from 37.92 mg to 29.24 mg after three month storage, with minimum ascorbic acid (25.77 mg) in blended guava nectar prepared using T9 (20 ml
guava and 80 ml of aloevera) and maximum ascorbic acid (41.34 mg) in blend using T1 (100 ml guava and 0 ml
aloevera), which is statistically followed with T2 (90 ml guava and 10 ml
aloevera) value of 40.13 and T3 (80 ml
guava and 20 ml aloevera) value of 38.27 mg. Brock et al., (1998) reported that the ascorbic acid content decreased during storage probably due to thermal degradation during processing and subsequent oxidation.
The mean antioxidant activity (%TBARS) of blended guava nectar varied significantly high from 324.3 % to 356.1 % after three month storage has been presented in Table 4, with minimum antioxidant activity (315.2 %) in blended guava nectar prepared using T9 (20 ml guava and 80 ml of aloevera)
and high (353.6 %) in blend using T1
(100 ml guava and 0 ml Aloevera), which is statistically followed with T2
(90 ml guava and 10 ml Aloevera) value of 352.6 % and T3 (80 ml guava and 20
ml aloevera) value of 350.3 %. Measurement of bioactivity such as antioxidant capacity becomes more use full for assessing the overall healthiness of foods than measurement of specific micronutrients (Van B. and Jongen, 1997).
The sensory color, taste, aroma and overall acceptability score of blended guava nectar prepared using different proportion of guava and
aloevera juice/ pulp maximum score (9) in blend using T4 (70 ml guava and 30
ml aloevera), which is statistically followed with T5 (60 ml guava and 40
ml aloevera) score (8) and T6 (50 ml
guava and 50 ml aloevera) score (8). Minimum score occur (5) in blended nectar prepared using T9 (20 ml guava
and 80 ml of aloevera).The interaction of TSS, blends and storage possess significant effect on the sensory score of blended guava nectar. Similar observations were also reported earlier by Vaghashiya (2015).
CONCLUSION AND
RECOMMENDATIONS
The findings summarized above indicate that guava fruits and aloevera slips available in the market during glut season can be utilized more beneficially for preparation of blended guava nectar. The blended guava nectar can be prepared using T4 (70 ml guava and 30
ml aloevera) give result in color, taste, aroma and overall acceptability. The prepared guava nectar can be stored successfully for a period of three months in glass bottles after heat processing at 96±1°C for 30 min. Thus, the developed technologies can commercially be explored by food processing industry for the production of quality guava nectar blending with aloevera. Therefore, profitable utilization of guava fruits and aloevera slips by processing can ensure better returns to the growers and consumer at reasonable price.
REFERENCES
Brock V. D., Ludikhuyze L., Weemaes C., Van L. A. and Hendrickx. M. (1998) Kinetics for isobaric isothermal degradation of L-ascorbic acid. Journal
of Agriculture and Food
Chemistry,46(5): 2001-2006.
IJART- Vol-4, Issue-4, August, 2019 Available online at http://www.ijart.info/ DOI: https://doi.org./10.24163/ijart/2017/4(4):65-71
preparation. Journal of Horticulture Science, 3(2):161-163.
Dhaliwal G. S. and Dhillon S. K. (2003). Effect of tree size on physico-chemical characteristics of fruits of guava cv.
Sardar. Indian Journal Horticulture 60: 312-317.
Dubey S., Banafar R. N. and Shahu G. D. 2011. Effect of storage period on biochemical composition of guava RTS. Journal of Environment and Ecology 29(4):106-112.
Joseph B. and Priya M. R. (2011). Review on nutritional, medicinal and pharmacological properties of guava
(Psidium guajava L.). International
Journal of Pharmacy and Biology Sciences 2(1):53-69.
Lavanya T., Raj D and Vaghashiya J. M. (2018). Standardization of formulation for preparation of health drink by blending Aloevera, Guava and Jamun. International Journal of Chemical Studies 6(4):1715-1721.
Nickos A., Botsoglou D. J., Geargia F. E., Papgeorgiou V. N, Vassilopoulos A and Mantis J .(1994). Rapid, sensitive and specific thiobarbituric acid method for measuring lipid peroxidation in animal tissue, food and feed stuff samples. Journal of Agriculture Food Chemistry 42(9):1931-1937.
Peryam D. R. and Pilgrim J. F.(1957). Hedonic scale method of measuring food preferences. Journal of Food Technology 11(9): 9-14.
Ranganna S.(1997). Handbook of Analysis and Quality Control for Fruit
and Vegetable Products. Tata McGraw Hill Publishing Co. Ltd., New Delhi, India.
Sangeetha A. ,Premalatha M. R., Malathi D and Govindaraju P .2005. Preparation of aloeverabased fruit squashes. National seminar on post production systems and strategies. Food Safety & Security, 22-23: 220.
Sharma M., Gahlot R., Singh R. and Siddique S. (2009). Changes in chemical constituence of guava- jumun blends ready to serve drink and squash during squash. Haryana Journal of Horticulture Science38(4):259-265.
Sudhindra K. S. N., Sreenivas K. N., Shankarappa T. H. and Ravindra V. J. (2012). Standardization of recipe for value added nutraceutical beverages of guava blended with Aloevera and Roselle. Journal of Environmental Ecology 30(3): 995-1001.
Vaghashiya J. M. (2015). Study on preparation of health drink by blending Aloevera, bitter gourd, aonla and guava.
M.Sc. Thesis, Department of Post
Harvest Technology, ASPEE College of Horticulture and Forestry, Navsari Agricultural University, pp 84.
Van B. M .A. J.S. and Jongen M. F. (1997). Product quality and food processing: How to quantify the healthiness of a product. Cancer Letters, 114 (1-2):65-69.
IJART- Vol-4, Issue-4, August, 2019 Available online at http://www.ijart.info/ DOI: https://doi.org./10.24163/ijart/2017/4(4):65-71
Table 1: Changes in TSS (ºBrix) and acidity (%) in all the treatments during three month of storage period
T
Treatments
TSS (0Brix) Acidity (%)
0 days 15 days 30 days 45 days 60 days 75 days 90 days
Mean 0 days 15 days 30 days 45 days 60 days 75 days 90 days Mea n T1 (100:0) 20.01 20.09 20.50 20.93 21.06 21.39 21.72 20.81 0.34 0.35 0.37 0.38 0.39 0.40 0.41 0.38 T2 (90:10) 20.01 20.08 20.48 20.92 21.05 21.38 21.71 20.80 0.31 0.33 0.35 0.36 0.37 0.38 0.39 0.36 T3 (80:20) 20.00 20.08 20.50 20.92 21.04 21.38 21.70 20.80 0.30 0.32 0.34 0.35 0.36 0.37 0.38 0.35 T4 (70:30) 19.97 20.07 20.49 20.91 21.04 21.36 21.69 20.79 0.30 0.31 0.32 0.33 0.35 0.37 0.38 0.34 T5 (60:40) 19.94 20.07 20.49 20.90 21.01 21.34 21.68 20.78 0.30 0.31 0.32 0.33 0.35 0.37 0.38 0.34 T6 (50:50) 19.92 20.06 20.42 20.89 21.00 21.30 21.64 20.75 0.29 0.30 0.31 0.32 0.33 0.35 0.35 0.32 T7 (40:60) 19.90 20.03 20.37 20.85 20.98 21.28 21.62 20.72 0.28 0.30 0.31 0.32 0.33 0.34 0.35 0.32 T8 (30:70) 19.89 20.04 20.34 20.82 20.94 21.26 21.60 20.70 0.27 0.29 0.30 0.31 0.32 0.33 0.34 0.31 T9 (20:80) 19.75 20.02 20.33 20.79 20.87 21.20 21.54 20.64 0.24 0.26 0.28 0.30 0.31 0.32 0.33 0.29
Mean 19.93 20.06 20.44 20.88 21.00 21.32 21.66 20.76 0.29 0.31 0.32 0.33 0.34 0.36 0.37 0.33
SEm (±) 0.19 0.02 0.02 0.02 0.02 0.33 0.66 - 0.01 0.01 0.01 0.02 0.01 0.03 0.02 -
CD 0.56 0.06 0.05 0.05 0.05 0.99 1.96 - 0.04 0.04 0.04 0.05 0.04 0.08 0.07 -
Table 2: Changes in pH and total sugars (%) in all the treatments during three month of storage period
T
Treatments
pH Total sugar (%)
0 days 15 days 30 days 45 days 60 days 75 days 90 days
Mean 0
days 15 days 30 days 45 days 60 days 75 days 90 days Mean
T1 (100:0) 4.69 4.68 4.67 4.66 4.64 4.62 4.60 4.65 32.58 32.74 33.14 33.72 33.92 34.15 34.66 33.56 T2 (90:10) 4.68 4.67 4.66 4.65 4.63 4.62 4.60 4.64 32.44 32.70 32.94 33.42 33.84 34.09 34.54 33.43 T3 (80:20) 4.68 4.67 4.66 4.65 4.62 4.61 4.59 4.64 32.09 32.43 32.72 33.29 33.72 33.99 34.25 33.21 T4 (70:30) 4.67 4.66 4.65 4.64 4.62 4.60 4.58 4.63 31.94 32.05 32.15 32.26 32.71 33.08 33.71 32.56 T5 (60:40) 4.67 4.66 4.65 4.64 4.61 4.59 4.57 4.63 31.73 31.86 31.96 32.08 32.50 33.00 33.40 32.36 T6 (50:50) 4.66 4.65 4.63 4.62 4.60 4.59 4.57 4.62 31.67 31.74 31.86 31.98 32.33 32.70 33.26 32.22 T7 (40:60) 4.65 4.64 4.62 4.61 4.59 4.57 4.56 4.61 31.60 31.68 31.77 31.84 32.13 32.57 32.93 32.08 T8 (30:70) 4.65 4.64 4.62 4.61 4.59 4.57 4.54 4.60 31.24 31.42 31.63 31.79 32.11 32.48 32.88 31.93 T9 (20:80) 4.63 4.62 4.60 4.58 4.56 4.56 4.54 4.58 30.56 30.70 30.86 31.13 31.86 32.07 32.13 31.33 Mean 4.66 4.65 4.64 4.63 4.61 4.59 4.57 4.62 31.76 31.92 32.11 32.39 32.79 33.12 33.53 32.52
SEm (±) 0.02 0.01 0.01 0.02 0.02 0.01 0.01 - 0.01 0.21 0.03 0.20 0.59 0.67 0.79 -
CD 0.05 0.03 0.04 0.05 0.07 0.03 0.03 - 0.03 0.62 0.10 0.60 1.74 2.00 2.36 -
Table 3: Changes in reducing sugars (%) and ascorbic acid (mg 100g-1) in all the treatments during three
month of storage period
T
Treatments
Reducing sugars (%) Ascorbic acid (mg 100g-1)
0 days 15 days 30 days 45 days 60 days 75 days 90 days
Mean 0 days 15 days 30 days 45 days 60 days 75 days 90 days Mean
T1 (100:0) 28.80 31.30 32.29 34.83 35.07 35.67 35.99 33.42 49.81 44.38 41.31 39.45 38.84 38.12 37.45 41.34 T2 (90:10) 28.63 30.90 31.95 31.58 32.92 33.59 34.26 31.98 46.68 43.45 40.99 38.32 37.86 37.16 36.49 40.13 T3 (80:20) 28.31 29.80 29.80 31.35 32.15 32.81 33.48 31.10 43.68 42.77 39.39 36.56 35.87 35.14 34.48 38.27 T4 (70:30) 28.26 29.84 29.76 30.77 31.70 32.36 33.03 30.82 38.21 37.41 36.25 34.41 33.73 33.03 32.36 35.06 T5 (60:40) 25.24 27.46 28.46 29.65 30.40 31.06 31.73 29.14 34.44 34.28 33.95 32.76 32.10 31.37 30.70 32.80 T6 (50:50) 25.14 27.46 28.39 29.59 30.32 30.99 31.65 29.08 33.40 31.89 28.63 26.83 25.51 24.77 24.10 27.88 T7 (40:60) 24.23 26.77 27.78 28.42 29.45 30.12 30.45 28.17 32.41 30.76 27.61 26.44 25.18 24.50 23.16 27.15 T8 (30:70) 23.67 26.54 27.27 28.30 29.28 29.88 30.18 27.87 31.80 30.38 27.33 25.04 24.03 22.99 22.32 26.27 T9 (20:80) 23.43 26.38 27.14 28.02 29.00 29.47 29.88 27.62 30.81 29.42 26.87 24.77 23.74 22.72 22.05 25.77 Mean 26.19 28.50 29.20 30.28 31.14 31.77 32.29 29.91 37.92 36.08 33.59 31.62 30.76 29.98 29.24 32.74
SEm (±) 0.14 0.11 0.63 0.74 1.23 1.24 1.43 - 1.96 1.86 1.90 1.39 1.73 1.70 1.43 -
IJART- Vol-4, Issue-4, August, 2019 Available online at http://www.ijart.info/ DOI: https://doi.org./10.24163/ijart/2017/4(4):65-71
Table 4: Changes in antioxidant (%TBARS) and sensory evaluation in all the treatments during three month of storage period
Treatments
%TBARS Sensory evaluation
0 days 15 days
30 days
45 days
60 days
75 days
90 days
Mean Color
scores Taste scores
Flavor scores
Overall Accept.
T1 (100:0) 342.1 345.5 346.5 352.1 356.5 359.8 372.5 353.6 6.14 7.18 7.10 5.67
T2 (90:10) 339.3 342.6 347.0 350.3 357.0 360.3 369.6 352.3 8.01 7.66 7.91 8.11
T3 (80:20) 338.3 341.6 344.0 346.6 353.3 360.0 368.6 350.4 8.08 8.02 8.12 8.18
T4 (70:30) 331.6 334.9 337.6 340.9 347.6 354.3 363.3 344.3 8.60 8.61 8.84 8.78
T5 (60:40) 325.2 328.6 331.9 335.2 341.9 348.6 356.9 338.3 8.38 8.37 8.52 8.51
T6 (50:50) 321.8 325.1 329.1 332.5 339.1 345.8 352.5 335.1 8.29 8.15 8.19 8.49
T7 (40:60) 314.2 317.6 321.9 325.2 331.9 338.6 345.9 327.9 7.32 7.46 7.32 7.23
T8 (30:70) 307.0 310.3 314.7 318.0 324.7 331.3 342.0 321.1 6.31 7.27 7.12 6.64
T9 (20:80) 299.1 303.4 310.1 313.4 320.1 326.8 333.4 315.2 5.95 7.04 6.19 5.15
Mean 324.3 327.7 331.4 334.9 341.3 347.3 356.1 337.6 7.45 7.75 7.70 7.42
SEm (±) 3.79 4.42 3.17 3.98 5.14 4.56 4.98 - 0.37 0.01 0.21 0.21
CD 11.26 13.13 9.43 11.82 15.27 13.56 0.01 - 1.09 0.04 0.63 0.61