DISPOSITION OF CISPLATIN AND PEGYLATED LIPOSOMAL CISPLATIN IN MICE BEARING SECONDARY INTRACRANIAL LUNG AND BREAST CANCER METATASES
Amanda W. Keeler
Honors Thesis
UNC Eshelman School of Pharmacy University of North Carolina
Advisor
William C. Zamboni, PharmD, PhD.
April 2015
William C. Zamboni, PharmD, PhD
Background:
Metastases to the brain remain a significant hindrance to extending patient survival as most chemotherapeutics do not show good penetration across the blood brain barrier. The two most commonly known tumors to metastasize to the brain are non-small cell lung cancer (NSCLC) and breast cancer, particularly triple negative breast cancer (TNBC). Nanoparticle agents, including liposomes, have shown enhanced delivery to solid tumors and brain. We compared pharmacokinetics (PK), efficacy, and tumor disposition of PEGylated liposomal cisplatin (PLC) with that of small molecule (SM) cisplatin in intracranial models of NSCLC and TNBC.
Methods:
Female Nu/Nu athymic mice were inoculated intracerebrally with A549 NSCLC K-Ras (12S)-luciferase-expressing cells or SUM149 BRCA1-deficient -(12S)-luciferase-expressing cells. Tumor-bearing mice (n=3) were administered PLC at 5mg/kg or SM cisplatin at 5mg/kg and were euthanized prior to and at 0.083, 1, 3, 6, 24, 72 and 96h post-treatment. Samples were processed to measure platinum concentrations via inductively coupled plasma mass spectroscopy (ICP-MS). Efficacy was assessed by survival and bioluminescence. Immunohistochemistry was used to determine tumor microenvironment.
Results:
The exposures of PLC and cisplatin were higher in SUM149 TNBC as compared with A549 NSCLC tumors. This suggests that A549 NSCLC tumors in the brain have barriers that impede the delivery of drugs, including nanoparticle agents. Higher tumor AUCs were seen in both cell lines for PLC, but this did not translate to improved efficacy.
The need for novel methods to induce the release of drug from liposomes into tumors and determine the factors that affect the tumor delivery of small molecule and nanoparticle agents into intracranial tumors needs to continue to be investigated further.
1.0 Introduction
Brain metastases arising from breast cancer and lung cancer are significant clinical problem associated with decline in quality of life, loss of independence, and poor survival. As systemic cancer chemotherapies continue to show improvements in efficacy, metastases to the brain remain a significant hindrance to extending patient survival, as most chemotherapeutics do not show good penetration across the blood brain barrier. The two most commonly known tumors to metastasize to the brain are non-small cell lung cancer (NSCLC) and breast cancer, particularly triple negative breast cancer (TNBC). Cisplatin is a standard treatment for extracranial NSCLC and TNBC tumors. However, cisplatin has limited activity in NSCLC and TNBC tumors metastatic to the brain due to limited penetration into the brain and brain tumors. The treatment of primary and metastatic brain tumors has been significantly limited by the inability of anticancer agents to achieve cytotoxic exposures within the tumor.
Nanoparticles and liposomes are thought to be cleared via the mononuclear phagocyte system (MPS), which is located primarily in cells in the liver and spleen, as well as in the lung, bone marrow and blood. Nanoparticles and liposomes can alter both the tissue distribution and the clearance of drugs because the drug takes on the PK characteristics of the carrier. The primary sites of accumulation of nanoparticles are the tumor, liver and spleen, compared to non-nanoparticle formulations.
The ability to encapsulate platinum (Pt) analogues, such as cisplatin, in a liposomal or nanoparticle carrier offers pharmacologic, efficacy and toxicity advantages. A nanocarrier would protect the active unbound Pt from being rapidly deactivated by plasma proteins and thus allow for more of the active drug to circulate in blood. Prior nanoparticle and liposomal formulations of cisplatin have been limited by the inability to load cisplatin into the carrier and/or the inability of the nanoparticle carrier to release the drug in the tumor target once encapsulated. The ability of nanoparticle agents to deliver drug to brain tumors has not been extensively evaluated.
In this study, we evaluated the pharmacology of cisplatin and PEGylated liposomal (PLC) in mice bearing intracranial tumor models of NSCLC and TNBC. In addition, we evaluated how tumor related factors (e.g. vascularity, collagen, and macrophages) affect the delivery of these agents to different sections of tumors, tumors in different location of the brain and normal brain. We then compared how these factors impact the efficacy of cisplatin and PLC in these models.
2.0 Materials and Methods
2.1 Pharmacologic Agents
2.2 Animal use and intracranial tumor inoculation
Female Foxn1nu/nu mice at 10 weeks old, weighing at least 20 g before intracranial (IC) tumor
implantation, were used for all studies. All animal studies were performed under the supervision of the Animal Studies Core (University of North Carolina at Chapel Hill) and were bred in-house. Before IC inoculation, mice were anesthetized with ketamine 75 mg/kg IP x 1 and Domitor® 1 mg/kg IP x 1. Mice were placed on a stereotactic frame (Kopf Model 900, Tujunga, CA) prior to injection of either 2 x 10⁵
SUM149 cells or 2 x 10⁵ A549 cells re-suspended in 5 uL of corresponding culture media containing 5%
methylcellulose; implantations were performed as previously described. All animals were monitored for health conditions and handled in accordance with The Institutional Animal Care and Use Committee (IACUC) approved protocols. Only animals which fully recovered from IC surgery were entered into the study.
2.3 Bioluminescence imaging
2.4 Maximum tolerated dose (MTD)
Cisplatin was dosed in three treatment arms (1 mg/kg, 3 mg/kg and 5 mg/kg) and compared to a PBS control group, n=3 for all treatment arms, in non-tumor bearing female nude mice 8-10 weeks old intravenously via tail-vein once per week for six weeks. Body weight and other signs of morbidity were monitored, and animals were sacrificed at a 20% weight loss as compared to maximum weight. Animal handling, monitoring and sacrifices were performed by the Animal Studies Core (UNC-CH). Cisplatin MTD was determined to be 5 mg/kg for six weeks of treatment. PLC MTD was performed by the sponsoring company, and the single dose MTD was determined to be 12 mg/kg.
2.5 Pharmacokinetic study design
On day 14 and day 23 following intracranial injections of 2x10⁵ SUM149-LUC (BRCA1 mut,
pTEN-, basal-like) cells and 2x10⁵ A549 (Kras, mutant) cells respectively, mice were pair-matched into
two treatment groups. For both cell lines, intracranial tumor formation was confirmed by serial bioluminescence imaging on day 1 and then approximately 1 and 2 weeks post-injection. Prior to treatment, the average luciferase signal (photons/second) between groups was shown to be not statistically significant. Group 1 (n=21) received SM cisplatin administered over 10-15 seconds at 5 mg/ kg IV x 1 via tail vein; and group 2 (n=21) received PLC administered over 10-15 seconds at 5 mg/kg (cisplatin equivalents) IV x 1 via tail vein.
where tumor was present), normal contralateral brain, spleen and liver were collected from each mouse. Plasma, tumor and tissues were placed in cryopreservation vials and snap frozen using liquid nitrogen. All samples were stored in a -80 °C freezer until processing.
2.6 Sample processing and analytical method
To measure plasma sum total Pt concentrations (carrier-encapsulated + released) for PLC and total Pt concentration (protein-bound + unbound) SM cisplatin, 100 uL of 70% HNO3 with 100 ng/mL of
iridium (Ir) were added to 75 uL of plasma for Pt detection. Samples were digested at 100 °C for 90 minutes, and filtered water was added for a final volume of 1,500 uL for all plasma samples, which were stored at 4 °C until analysis. For SM cisplatin samples, an additional 150 uL of plasma was required for unbound cisplatin concentration detection. Plasma was added to the ultracentrifugation chamber (Centrifree Millipore) and spun at 2500 x g for 30 minutes at 25 °C. After centrifugation, 50 uL of ultrafiltrate was collected and processed like the sum total plasma samples previously described. Solid phase separation was used for PLC plasma samples to measure Pt in encapsulated and released fractions. For tissue sum total Pt detection, a goal weight of 60- 80 mg was collected and 100 uL of 70% HNO3
with 200 ng/mL of Ir was added to each tissue. Tissues were digested at 100 °C for a minimum of 2 hours; filtered water was added for a final volume of 2,000 uL and stored at 4 °C until analysis.
2.7 Pharmacokinetic Analysis
The pharmacokinetics of PLC and cisplatin in plasma, tumor and tissues were analyzed by noncompartmental analysis using WinNonlin Professional Edition version 6.3 (Pharsight Corp., Cary, NC). The area under the concentration versus time curve from 0 to 96hr (AUC0-96hr) was calculated using
the linear up/log down rule. The plasma volume of distribution (Vd), clearance (CL), and half-life (t1/2)
were calculated using standard equations. The maximum concentration (Cmax) and time of Cmax (tmax)
were determined by visual inspection of the concentration versus time data.
2.8 Immunohistochemistry (IHC) and Digital Imaging
Control female Foxn1nu/nu mice with confirmed SUM149 and A549 intracranial tumors were
was used to calculate H-score with a possible range of 0-300. The microvessel density (MVD) was calculated from the number of vessels divided by stained areas (mm2) using the Definien Tissue Studio
software (Munich, Germany).
2.9 Efficacy study design
Treatments for both cell lines were: 1) control, IV via tail vein PBS (100uL) weekly, 2) cisplatin 5 mg/kg IV weekly, and 3) PLC 5 mg/kg IV weekly, in female nude mice >20gm, > 8 weeks old. Treatment was ongoing until clinical symptoms required sacrifice. Prior to treatment, the average luciferase signal between all treatment groups and within each experiment was not statistically different. Mice were weighed a minimum of three times/weekly and were monitored by optical imaging weekly until clinical symptoms (i.e. decreased response to stimuli, neurologic dysfunction, weight loss of 20% and/or a Body Composition Score of 2 or less) indicated sacrifice. A549 (Kras mutant): LUC imaging on day 1, 8, 15, 22 post injection and groups were confirmed on D23, then weekly imaging performed. Sum149-LUC (BRCA1 mut/PTEN-; basal-like): LUC imaging on Day 1, 7 and 13 post injection and groups were confirmed on D14, then weekly imaging performed. Based on previous studies, 12 mice per treatment group were required to provide 80% power (alpha = 0.003) to detect an 11 day difference in survival between any two groups, assuming a standard deviation of six days.
The Kaplan-Meier method and Log-rank tests were used to evaluate and compare overall survival among treatment groups. Unadjusted p-values are reported. For bioluminescence imaging, fold changes were calculated relative to the start date of treatment. If present, negative imaging values (due to correction for background) were recorded and set to zero. For every time point where at least two animals were alive in the treatment group, the median level and interquartile range (25th – 75th
3.0 Results
3.1a Pharmacokinetic studies for PLC and SM cisplatin in SUM149 TNBC model
The plasma concentration versus time profiles for PLC and SM cisplatin administration at 5 mg/kg (cisplatin equivalents) in female nu/nu mice in SUM149 TNBC intracranial tumors can be seen in
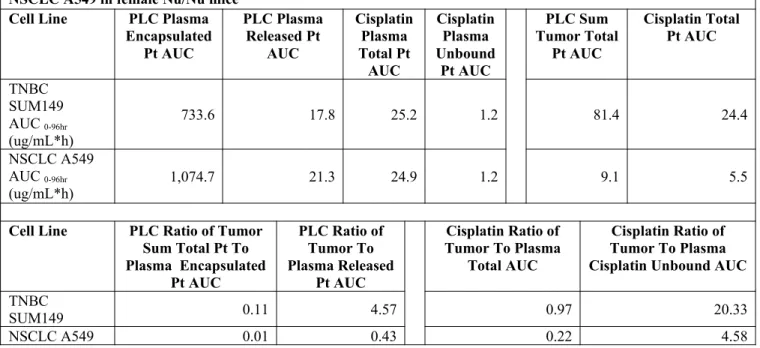
Figure 1. Figure 1 illustrates the prolonged circulation time of PLC over SM cisplatin and potential advantages for extended drug exposure. The tumor concentration versus time profile of sum total (encapsulated + released) PLC Pt and total (protein bound + unbound) cisplatin Pt in female mice bearing SUM149 TNBC intracranial tumor is shown in Figure 3. The AUCs for each agent in plasma and tumors are included in Table 1 along with the plasma AUC to tumor AUC ratios. In addition, the AUCs for the peritumoral brain tissue and contralateral brain tissue are included in Table 2.
Table 1: Summary of AUC Data in plasma and intracranial tumor for PLC and Cisplatin in TNBC SUM149 and NSCLC A549 in female Nu/Nu mice
Cell Line PLC Plasma
Encapsulated Pt AUC PLC Plasma Released Pt AUC Cisplatin Plasma Total Pt AUC Cisplatin Plasma Unbound Pt AUC PLC Sum Tumor Total Pt AUC Cisplatin Total Pt AUC TNBC SUM149 AUC 0-96hr (ug/mL*h)
733.6 17.8 25.2 1.2 81.4 24.4
NSCLC A549 AUC 0-96hr
(ug/mL*h) 1,074.7 21.3 24.9 1.2 9.1 5.5
Cell Line PLC Ratio of Tumor
Sum Total Pt To Plasma Encapsulated
Pt AUC
PLC Ratio of Tumor To Plasma Released
Pt AUC
Cisplatin Ratio of Tumor To Plasma
Total AUC
Cisplatin Ratio of Tumor To Plasma Cisplatin Unbound AUC
TNBC
SUM149 0.11 4.57 0.97 20.33
NSCLC A549 0.01 0.43 0.22 4.58
The plasma concentration versus time profiles for PLC and SM cisplatin administration at 5 mg/kg in female nu/nu mice in A549 NSCLC intracranial tumors can be seen in Figure 2. As seen in the previous tumor model, PLC showed an extended exposure as compared to SM cisplatin.
0 12 24 36 48 60 72 84 96 0.001 0.01 0.1 1 10 100 1000 Time (hr) P la ti nu m C on ce nt ra ti on (u g/ m L )
0 12 24 36 48 60 72 84 96
0.001 0.01 0.1 1 10 100 1000 Time (hr) P la ti nu m C on ce nt ra ti on (u g/ m L )
Figure 1. Plasma concentration versus time profiles of
PLC (gray) and cisplatin (black) in mice bearing SUM149 TNBC intracranial tumors dosed at 5 mg/kg IV x1 via tale vein.
Figure 2. Plasma concentration versus time profiles of PLC
(gray) and cisplatin (black) in mice bearing A549 NSCLC
intracranial tumors dosed at 5 mg/kg IV x 1 via tale vein.
0 12 24 36 48 60 72 84 96 0.001 0.01 0.1 1 10 Time (hr) P la ti nu m C o n ce n tr a ti o n ( ng /m g )
0 12 24 36 48 60 72 84 96
1 10 Time (hr) P la ti n um C o n ce n tr a ti o n ( n g /m g )
Figure 3. Tumor concentration vs. time profiles of PLC
(gray) and cisplatin (black) in mice bearing SUM149 TNBC intracranial tumors dosed at 5 mg/kg IV x 1 via tale vein.
Figure 4. Tumor concentration vs. time profiles of PLC
(gray) and cisplatin (black) in mice bearing A549 NSCLC
intracranial tumors dosed at 5 mg/kg IV x 1 via tale vein.
3.2 Profiling Factors in Intracranial and Extra-axial TNBC and NSCLC Tumors
Slides of intracranial and extra-axial tumors were generated from three no treatment control mice for each tumor model (SUM149 and A549) and evaluated for tumor factors (F4/80, CD31 and Collagen IV) using IHC methods. Slides were processed in triplicate. All three control SUM149 mice grew an extra-axial tumor in addition to the primary intracranial tumor, while only one of the three A549 control mice grew an extra-axial tumor in addition to the primary intracranial tumor. All tumors were annotated with Aperio Spectrum software (Munich, Germany) to distinguish between extra-axial and intracranial tumor tissue, and these results are displayed in Table 2. For both cell lines, the intracranial tumors were identifiable and marked appropriately. All three SUM149 extra-axial tumors were also identifiable after staining and able to be annotated, but the one A549 tumor extra-axial tumor was only identifiable after F4/80 and Collagen IV staining.
Table 2: Average IHC Staining Results for Intracranial & Extra-axial Tumor in A549 & SUM149 Cell Line (Nu/Nu) Cell Line # of Tumor samples Tumor Type F4/80 H Score (0-400) CD31: Sum Vessel Density (1/
mm3)
CD31: Sum # Vessel with
Lumen
SUM149
67.7 62.5 159.8 2,517 35.3
N=9 Extra-axial 187.1 ±
77.8 492.4 ± 55.8 382.2 ± 345.1 7,412 ± 6,649 49.5 ± 34.7 NSCLC A549
N=9 Intracranial 111.3 ±
45.5 269.7 ±173.2 268.9 ± 265.7 12,631 ± 17,631 25.8 ± 9.4
N=3 Extra-axial 199.2 ±
34.7
* * * 73.4 ±
4.9 *IHC staining of CD31 was not detectable in tumor
3.3 Efficacy Studies of PLC E1280-248 in TNBC and NSCLC Models
The Kaplan-Meier curves after administration of PLC , SM cisplatin and no treatment controls (PBS) in female mice bearing intracranial SUM149 TNBC and A549 NSCLC tumors are shown in
Figure 5 and 6, respectively.
Figure 5. Kaplan-Meier (percent survival) curves after
administration of PLC (green), cisplatin (black) and no treatment control (orange) in mice bearing SUM149 TNBC intracranial tumors. The median survival (MS) is listed for each agent. MS was greater for cisplatin.
Figure 6. Kaplan-Meier (percent survival) curves after
administration of PLC (green), cisplatin (black) and no treatment control (orange) in mice bearing A549 NSCLC
intracranial tumors. The median survival (MS) is listed for each agent. The MS was similar for all cohorts.
Even though there was a higher exposure of sum total Pt in tumors after administration of PLC (Figure 3), there was greater survival in mice bearing SUM149 tumors after administration of SM cisplatin, signifying that cisplatin is not readily released from liposomal carrier into the tumor matrix. The AUCs for peritumoral brain and contralateral brain are also included in Table 3.
Table 3. Summary of AUC Data in peri-tumoral and contralateral brain tissue for PLC and SM Cisplatin in TNBC SUM149 and NSCLC A549 in female Nu/Nu mice
Cell Line Peri-tumoral
Brain PLC Sum Total Peri-tumoral Brain Cisplatin Sum Total Contralateral Brain
PLC Sum Total Contralateral Brain Cisplatin
Sum Total
NSCLC A549
AUC 0-96hr (ug/mL*h)
13.81 5.46 15.83 5.92
4.0 Discussion
The development of brain metastases in breast and lung cancer continue to be a significant challenge in the management of patients with advanced disease. Even though the blood brain barrier can be compromised in the presence of an intracranial tumor, delivery of systemic chemotherapy treatments continues to be an obstacle to successful treatment. We show here that in two different murine intracranial models, the plasma exposure of PLC was higher in both cell lines (SUM149 and A549) as compared to SM cisplatin. Specifically, the encapsulated AUC0-96hr of PLC was 30-fold higher in the
SUM149 murine model and 50-fold higher in the A549 model. Also, a higher plasma exposure for both platinum agents was seen in A549 as compared to SUM149. Table 1 data suggest that liposomal agents are able to achieve higher exposure in tumor compared to small molecule agents. However, these tumor concentration are only of sum total PLC and total SM cisplatin, due to the inability to measure exposure of active-released and unbound concentration of respective drugs in tissues.
The AUC for PLC was 9-fold higher in SUM149 tumors over A549 tumors, and for SM cisplatin, the AUC was 5-fold higher in SUM149 compared to A549. This was surprising given that the plasma AUC for PLC and SM cisplatin were higher in the A549 murine model as compared to SUM149. This suggests that NSCLC A549 intracranial tumors have barriers which impede the delivery of drugs, especially nanoparticle and liposomal agents. In addition, the exposure of PLC in intracranial SUM149 tumors was significantly lower than the exposure of PEGylated liposomal doxorubicin (Doxil®; PLD) in mice bearing MDA-MB-213 TNBC intracranial tumors, suggesting that tumor delivery is not only variable across tumor types, but also highly variable across TNBC models.
in Table 3. F4/80 was used to evaluate how the presence of TAMs affects the delivery of PLC and SM cisplatin. When comparing F4/80 in both cell lines, the intracranial H-score for both were similar, but in both cell lines, the H-score in the extra-axial tumors was significantly higher.
Collagen IV and CD31 were used to evaluate effects of the tumors extracellular collagen matrix and physiologic state of the vasculature, respectively, on tumor delivery. The baseline H-score of collagen was 2-fold greater in A549 than SUM149. In addition, there was no difference seen between intracranial and extra-axial SUM149 H-scores, but there was a 3-fold increase in A549 extra-axial H-score over intracranial H-score (25.8 ± 9.4 vs. 73.4 ± 4.9). Vascularity was measured by microvessel density (MVD) and was seen to be similar in both cell lines. The number of blood vessels with lumen was also quantified to compare between cell lines. A549 tumors had higher number of vessels with lumen compared to SUM149 (268.9 ± 265.7 vs. 152.2 ± 159.8), indicating hyperpermeability and hyperperfusion of the vasculature.
Despite the higher concentration of PLC in both tumor models, this did not translate into prolonged survival. The pharmacokinetics of nanoparticles like PLC are dependent on the carrier and not the encapsulated drug until it is released from the carrier. Drug that is maintained in the liposomal carrier is considered inactive until it is released from the carrier as an active ‘warhead’. Due to the inability to measure released drug from the liposomal carrier within tissues, it is difficult to predict the encapsulated to released ratio of PLC within the tissues. Based on the limited improvement in efficacy seen in the PLC treatment arm as compared to the placebo arm, it is reasonable to assume that the release of active warhead cisplatin did not occur efficiently within the tumor.
compared to A549 tumors. Even though PLC AUCs in SUM149 tumors were 3.3 times higher than in SM cisplatin, the SM cisplatin treatment arm had an additional 13.5 days in mean survival over the PLC treatment arm. In the A549 cell line, there was only marginal improvement in both treatment arms as compared to placebo arm. Again, despite tumor PLC AUC being 1.5 times higher than SM AUC, this did not translate into improved efficacy. For PLC, further development is needed to improve the release of active drug in the tumor while preventing release during circulation.
References:
1. Lin NU, Bellon JR, Winer EP. CNS metastases in breast cancer. Journal of clinical oncology. 2004;22(17):3608-3617.
2. Zamboni WC, Strychor S, Joseph E, et al. Plasma, tumor, and tissue disposition of STEALTH liposomal CKD-602 (S-CKD602) and nonliposomal CKD-602 in mice bearing A375 human melanoma xenografts. Clinical cancer research. 2007;13(23):7217-7223.
3. Zamboni WC, Yoshino K. Formulation and physiological factors affecting the pharmacokinetics and pharmacodynamics of liposomal anticancer agents. Drug delivery system. 2010;25(1):58-70. 4. Zamboni WC, Maruca LJ, Strychor S, et al. Bidirectional pharmacodynamic interaction between
pegylated liposomal CKD-602 (S-CKD602) and monocytes in patients with refractory solid tumors. Journal of liposome research. 2011;21(2):158-165.
5. Anders, C.K., et al., Pharmacokinetics and Efficacy of PEGylated Liposomal Doxorubicin in an Intracranial Model of Breast Cancer. PLoS ONE, 2013. 8(5): p. e61359.
6. Song G, Wu H, Yoshino K, Zamboni WC. Factors affecting the pharmacokinetics and pharmacodynamics of liposomal drugs. J Liposome Res. 2012;22(3):177-92.
7. Li S, Huang L. Pharmacokinetics and biodistribution of nanoparticles. Molecular pharmaceutics. 2008;5(4):496-504.
8. Karginova O, Siegel MB, et al. Efficacy of Carboplatin alone and in combination with ABT888 in BRCA-mutated and BRCA-wild-type Triple Negative Breast Cancer intracranial murine models. Mol Cancer Ther; 2015;14(4): 1-11.