Emily A. Guhde. The Value of Online Resources to North Carolina Public Library Patrons. A Master’s Paper for the M.S. in L.S. degree. March, 2012. 52 pages. Advisor: Jeffrey Pomerantz
As public libraries balance the increasing demand for online resources with budgetary constraints, information about the value of online resources to patrons will help library administrators prioritize their efforts. Many researchers have studied the value of public libraries more generally, but this study estimates the value of library-provided online resources through an evaluation of library patrons’ willingness to pay. Results indicate limited relationships between respondent-specific variables and patron willingness to pay, but several library-specific variables were found to be significantly related to patron willingness to pay. A discussion of these results and recommendations for applying this research to public library administration are included in this paper.
Headings:
Public Libraries – North Carolina
Electronic Books – Evaluation
Audiobooks – Evaluation
THE VALUE OF ONLINE RESOURCES TO NORTH CAROLINA PUBLIC LIBRARY PATRONS
by Emily A. Guhde
A Master’s paper submitted to the faculty of the School of Information and Library Science of the University of North Carolina at Chapel Hill
in partial fulfillment of the requirements for the degree of Master of Science in
Library Science.
Chapel Hill, North Carolina March 2012
Approved by
Acknowledgments
I received assistance from many people over the course of this project. I would particularly like to thank:
All staff members at NC LIVE for their support, but especially Scott Ross for creating the online survey distribution method, Jill Morris for helping me find a solution to every
problem, and Tim Rogers for asking the big questions that lead to new research.
Elizabeth Caran and her staff at West Regional Library for allowing me to test the survey tool with their patrons.
Greg Needham, Director of Sheppard Memorial Library, for promoting my study through the North Carolina public library directors listserv.
All North Carolina public libraries that participated—without your cooperation, this study would not have been possible.
Table of Contents
Introduction....………..………. 3
Literature Review…..……… 5
Methodology...….………... 15
Survey Design..……….. 15
Survey Distribution….……….... 18
Findings……..……… 20
Descriptive Statistics………... 20
Cross-tabulations…….……… 23
Discussion………...……… 26
Willingness to Pay Responses……….……… 26
Factors Unrelated to Willingness to Pay…….……… 28
Factors Related to Willingness to Pay……… 30
Conclusion….………. 32
References... 33
Appendix A: List of Variables……….………. 37
Appendix B: Survey (Full Text)…..………. 40
Appendix C: Participating Libraries……..………. 48
Introduction
There are plenty of reasons to feel pessimistic about the future of public libraries.
The iPhone’s Siri puts a reference librarian in your pocket. Decreased government
spending on every level is hitting library budgets hard. Publishing companies are trying
to cut libraries out of the digital distribution picture. Netflix is more popular than God
and easier to use than a spoon. It is easy to see why some librarians have subscribed to
the “libraries are screwed” viewpoint (Neiburger, 2010), but even the most optimistic of
librarians will concede that the traditional public library faces a harsh new reality with
plenty of challenges ahead.
One major challenge is that the brand of libraries is still books (OCLC, 2010), and
books are quickly becoming an “outmoded” technology (Neiburger, 2010). When you
can access the information online and download it to a portable device, a trip to the
library is right up there with renting a movie from Blockbuster. Although many public
libraries have tried to keep up with the latest trends for providing innovative information
services to their patrons, the pace of technological change is leaving many public libraries
behind.
A second major challenge is that libraries, like all publicly funded agencies, are
under intense pressure to cut costs. This pressure has led to lay-offs, down-sizing staff
through attrition, and reduced open hours. Some local governments have even privatized
To remain a relevant information resource in this increasingly digital world,
public libraries must address these challenges. Public libraries need to offer services that
keep pace with popular technology, and they need to demonstrate the value of offering
these services to the community. Although plenty of studies demonstrate the value of
public libraries, there is a lack of research about the value of online resources to public
library patrons. To contribute to the knowledge about the value of online resources, this
study focused upon three popular online formats offered by all North Carolina public
libraries through the NC LIVE consortium—eBooks, eAudio books, and online videos.
The study intends to answer two research questions:
1) How much money are library patrons willing to pay to use a library-provided
eBook, eAudio books, or online video?
2) What factors are related to library patron willingness to pay for these
resources?
The answers to these questions will help public libraries begin to understand how
their patrons value their investments in online resources and what their communities’
Literature Review
Even before the Great Recession, public libraries recognized the importance of
demonstrating their value to their communities, lawmakers and administrators. Matthews
(2011) found 27 return on investment studies from public libraries in the United States
between 1999 and 2008, each able to point to a specific number—a dollar amount that the
library is producing in value for every dollar that it receives in funding (p. 5). Libraries
rely on this dollar amount “as a way to develop quantitative support in order to
politically, economically or socially influence a decision” because “traditional
justifications for library funding, usually a usage or output measure such as annual
circulation, […] is not as effective as it once was” (p. 1).
In order to survive the “tug-of-war for funding” (Matthews, 2011, p. 1), public
libraries must be able to show how they are adding value to their communities. Public
libraries that can cite a specific dollar amount have a particularly powerful sound bite for
their stakeholders. Theyer (2008) writes about the significance that this number can have
for taxpayers. “Tell them in dollars and cents what their money is buying in terms of
movie rentals, books purchases, computer time, programs, expert personal assistance, and
other things that do cost a lot of money on the open market” (p. 45). Similarly, Kaser
(2010) urges librarians to put those numbers to good use. “No matter what number you
come up with, carry it around in your hip pocket just in case the budget man comes to
Calculating that tangible number, of course, is easier said than done. Matthews
(2011) provides a summary of various methods for determining the value of public
libraries, but explains that because so many different methods are used to assess value,
the numbers are not easily compared between libraries and across states (p. 7). Lown and
Davis (2009) express a similar concern: “ROI [return on investment] metrics are
estimates that are based on surveys of their own local users combined with metrics that
are relevant to their own budget systems. Any attempt to compare ROI metrics across
these boundaries doesn’t make sense and is not relevant” (p. 4). This lack of
transferrable data puts the burden upon individual libraries or library systems to complete
their own valuation studies, but the cost may be prohibitive. For instance, Elliott, Holt,
Hayden and Holt (2007) make a low estimate of $20,000 to commission a cost-benefit
analysis for a public library (p. 32).
Libraries sometimes attempt to shortcut this process by using fair market value
data to create library value calculators. Library value calculators, like the one featured on
the Massachusetts Library Association website (MLA, 2008), often use fair market value
to calculate cost avoidance. They purport to show patrons how visiting the library
translates into savings for their families. The fair market value of any good, however, is
not an accurate measure of the consumer value of that good because it may overestimate
the value to consumers (K. Smith, personal interview, June 10, 2011). If a patron
borrows four eBooks through her public library’s website, a library value calculator
might determine that she has saved $60, estimating a fair market value of $15 per eBook
(Amazon Kindle Store, 2011). The problem with this calculation is that it assumes that
per eBook. She will download the eBooks for free from the library, but she is unlikely to
spend $15 per eBook because it is not worth it to her. In this case, the market value is
overestimating the value she derives from the eBook.
Similarly, fair market value may underestimate the value to consumers (Mankiw,
2009, p. 139). If a person buys an eBook for $15, but would have been willing to pay
$25, the market price of that eBook is less than the value that he has placed upon the
eBook. The difference between the two prices is called consumer surplus—the extra
amount of consumer benefit that the consumer did not have to pay for (p. 139). If we use
the market price to estimate value to the consumer in this case, we underestimate how
much benefit this person received from the good.
Another problem with using fair market value for library resources is that private
goods are inherently different from public goods. The consumer’s expectations and
benefits may be different when using a private good rather than a public good (K. Smith,
personal interview, July 12, 2011). For example, someone who purchases a book decides
that it is worth to her at least the market price, and she expects that the book will belong
to her after she purchases it. In contrast, when someone borrows a book from the library,
she decides it is worth the time and effort it took for her to get to the library, and she
expects that she must return the book after a specified time. If we use the fair market
value of a book to determine the value of borrowing that book from the library, we are
ignoring the important differences in consumer experience and expectations. The fair
market value of a book will not accurately capture the benefits that people get from
When we use fair market value to determine the value of a public good to
consumers, we make an inaccurate estimate. This dilemma is not particular to public
libraries. Public goods in general are difficult to value. City sanitation services, public
transportation, public safety, parks and recreation—each of these public goods lacks an
adequate market equivalent to help us determine its value. Economists have relied upon
willingness to pay (i.e., contingent valuation) studies to estimate the value of public
goods in a number of contexts, such as environmental resources and local government
services.
One of the most famous and influential willingness to pay (WTP) studies was
conducted after the Exxon Valdez oil spill in 1989, during which 11 million gallons of
crude oil spilled into Prince William Sound (Carson, Mitchell, Hanemann, Kopp, Presser,
& Ruud, 2003, p. 257). Researchers estimate that “250,000 seabirds, 2,800 sea otters,
300 harbor seals, 150 bald eagles, up to 22 killer whales, and billions of salmon and
herring eggs died as a direct result of the spill” (Steyn, 2003, p. 305). The loss of these
animals and the damage inflicted upon Alaska’s natural resources could not have been
estimated by a market value because it is not possible to determine the market price of a
sea otter or the Alaskan shoreline. Nonetheless, the State of Alaska and the Federal
Government wanted to recoup the loss of their natural resources by collecting damages
from Exxon, and they intended to pursue the matter in court (Carson et al., 2003, p. 257).
In order to demonstrate the value of these natural resources, several researchers created a
study to examine their value to the American public. In a paper describing their
methodology for this study, Carson, Mitchell, Hanemann, Kopp, Presser, and Ruud
valuation is a survey approach designed to create the missing market for public goods by
determining what people would be willing to pay (WTP) for specified changes in the
quantity or quality of such goods” (p. 258). Even though most Americans were likely
never to use the resources directly, the study attempted to put a monetary value on the
lost resources by asking people what they would be willing to pay to prevent a future oil
spill. Today this study serves as “a reference point that may be used to assess the
criticisms of [contingent valuation] and perhaps the more general debate surrounding
passive use” (Carson et al., p. 259).
In another WTP study, Simonsen and Robbins (2003) measured citizen WTP to
help solve a local government budget crisis in Waterford, Connecticut. They asked
citizens of Waterford how much of a property tax increase they would tolerate to avoid
an imminent budget shortfall (p. 836). Their results showed that “a positive view of
government and government services leads to a higher level of support for taxes” (p.
846), but they also demonstrated that people who were dissatisfied with government
services were not more likely to refuse paying increased property taxes. Simonsen and
Robbins use their results to suggest that citizens behave rationally when facing difficult
choices, regardless of their attitude toward the government (p. 851).
Public libraries have also used WTP studies to demonstrate value to their
communities, lawmakers and administrators. Researchers have conducted WTP studies
in public libraries throughout the world, and the following sub-sections describe several
United States
In the late 1990s, the St. Louis Public Library conducted a return on investment
study which included a WTP assessment. Not only were the authors of the study
interested in determining the return on investment for St. Louis’s taxpayers, but they also
wanted to “develop and test a practical, conservative methodology that large urban public
libraries can use to estimate and communicate the direct return on annual taxpayer
investment” (Holt, Elliott, & Moore, 1999, p. 2). The authors of the study measured
direct benefits by asking library card holders about their WTP for various library
services, their willingness to accept the loss of library services, and the cost of their time.
Their results gave them the sound bite they wanted: “And what we have proved is that
on average for every dollar the public has invested in library services, the direct benefits
just to library users is $4” (p. 11).
In 2006, the Library Research Service (a division of the Colorado State Library)
worked with eight of Colorado’s public libraries to determine their return on investment.
Their survey asked “typical” library users about their time and expense for traveling to
the library, as well as their WTP for annual use of their library cards (Steffen, Lietzau,
Lance, Rybin, & Molliconi, 2009, p. 5). Return on investment was calculated for each of
the eight participating libraries. On average, “for every $1.00 spent on public libraries,
$5.00 of value was realized by our taxpayers” (p. v). The survey asked respondents about
their use of many types of library services, as well as their purpose for using library
resources. However, the study did not include an analysis to determine if these variables
United Kingdom
Morris, Sumsion, and Hawkins (2002) questioned over 550 public library users
from four public library locations when returning books. Respondents were asked about
their personal characteristics, the type of book they borrowed, their purpose for using the
book, their reasons for borrowing the book (instead of purchasing), their enjoyment of the
book, and the price they would have paid to rent the book, if it had not been available at
the library (p. 79). Using the unique concept of “reads” to determine the overall benefit
of library books, Morris et al. determined “a value in excess of £815,000 per annum for
those services that can be assessed in monetary terms” (p. 86). They also found that the
type of resource borrowed did not reveal significant differences in WTP and found “no
dramatic links between purpose and the price a borrower would be prepared to pay” (p.
80). Respondent age, however, seemed to be related to WTP in this study (p. 80).
Pung, Clarke, and Patten (2004) studied the British Library using the contingent
valuation method to gauge the value of their services. They asked questions regarding
demographics, library use, service awareness, expenditures, substitute goods, WTP for
and willingness to accept various service levels (p. 92). They also asked respondents to
rate the importance of various library services, but did not discuss how these ratings
might be related to WTP. Their results showed that “the Library generates value of
around 4.4 times the level of its annual public funding of £85m” (p. 79). Their study also
found that “84% of all non-users interviewed felt that the British Library had a value for
Norway
AabØ (2004) presents the methodology and findings from her dissertation in
library science, which investigated the value of Norwegian public libraries using both
WTP and willingness to accept methods. Overall, her results show that “the population’s
valuation of public libraries seems to lie within the range of 400-2000 NOK per
household […] This in case implies that, as an average over all households, the benefits
from public libraries are greater than the costs of producing such library services” (p.
196). AabØ also asked respondents about their number of annual library visits and found
evidence of a relationship between frequency of use and WTP (p. 186-187). She also
found that income was related to WTP and that “rural residents and town folks have less
WTP than city dwellers” (p.184).
In a different study from 2009, AabØ conducted a multivariate regression analysis
to demonstrate which methodologies (cost/benefit, contingent valuation, or secondary
economic) reveal the highest rates of return on investment for American public libraries
(the only data set large enough for this type of analysis). AabØ concluded from her
regression analysis that “cost/benefit analysis (CBA) combined with market analogy
methods or measurements of secondary economic impacts give a higher [return on
investment] figure than CBA combined with contingent valuation” (p. 321). In other
words, contingent valuation (i.e., WTP) is a more conservative approach to determine the
value of public library resources.
Australia
Hider (2008) surveyed a random sample of Wagga Wagga, New South Wales
asking respondents to hypothetically vote for or against a monthly charge to fund the
public library (p. 446). The analysis of results included a regression model with the
variables sex, education, income and price (p. 450). Price was the most significant
predictor of whether or not a respondent would vote for or against the monthly charge,
although education level and income were also found to be statistically significant factors
(p. 450). Hider’s results ultimately showed a 1.33:1 return on investment ratio for the
Wagga Wagga City Library (p. 452).
South Korea
Lee, Chung, and Jung (2010) attempt to measure the effect of warm glow (the
feeling of goodness people derive from supporting a public good) in public library
valuation studies. They asked public library patrons about their WTP for library services,
but also asked them to agree or disagree with several warm glow indicators, such as “I
am willing to donate money for fundraising campaigns to promote public library
services” (p. 241). They found that respondents who felt good about supporting the
library were likely to be willing to pay more. They also found that the level of
satisfaction with public libraries did not affect WTP, while income and education levels
were positively related to WTP (p. 242).
Chung (2008) explains several techniques for eliminating common problems of
WTP studies. The dissonance minimizing technique, for example, avoids emotionally
motivated high or low WTP responses by giving people options to express emotion in
addition to assigning a dollar value (p. 72). Another technique, called information bias
accurately. Chung’s results indicate that dissonance minimizing and information bias
minimizing techniques can increase the accuracy of WTP amounts (p. 78).
These studies emphasize the benefits of using the WTP methodology for valuing a
public good. They also provide guidance for designing a WTP study that will be
methodologically rigorous and uphold the high standards of economic research.
The abundance of public library literature devoted to explaining and promoting
valuation studies indicates that librarians are concerned about this topic. While many
public libraries have conducted valuation studies, there is a lack of research that focuses
specifically upon the value of online resources. This research begins to address this gap
in the literature, particularly for North Carolina’s public libraries. By applying the
methods from previous studies to this research question about the value of online public
Methodology
This study was developed to discover information about the value of online
resources to public library patrons. The following two sub-sections will describe how the
study was conducted.
Survey Design
Using the WTP studies from the literature for guidance, an online survey was
designed to discover how much money North Carolina public library patrons are willing
to pay for eBooks, eAudio books, and online videos. The survey also included questions
about a number of factors that were found to be significant predictors of WTP in previous
studies. Each of the factors included in this study has been observed in multiple WTP
studies, and with the exception of “Purpose for using online resources,” all factors were
related to WTP responses in at least one previous study. These factors were broken down
further into variables, some of which came directly from the literature, and some of
which were original for this research. See Appendix A for a full list of variables and how
they were measured for this study. The factors included in this study were:
1) Frequency of using resources
2) Satisfaction with the library’s resources
3) Purpose for using online resources
4) Importance of library services in general
Library-specific characteristics were also included in the analysis with data
gathered from the State Library of North Carolina website.
The survey was created in Survey Monkey for ease of distribution and replication.
See Appendix B for the survey’s full text. Although answers were gathered at the
individual level, respondents were asked to consider the entire family’s use and valuation
of these resources in their responses. In order to participate, respondents were required to
state that they were 18 or older.
To elicit their WTP amounts, respondents were presented with a hypothetical
situation in which their library could no longer afford to provide eBooks, eAudio books
and online videos for free (at the point of use). Respondents were then presented with a
payment card—a range of specific payment options (between $0 and $5.00 or more)—
and asked to select the maximum amount that they would be willing to pay to use a
particular resource through the library’s website. This payment card format was a
stronger alternative to an open-ended response, which “tends to produce an unacceptably
large number of nonresponses” since people “often find it difficult to pick a value out of
the air” (Mitchell & Carson, 1989, p. 97). However, presenting respondents with specific
options carries the risk of an anchoring effect (p. 101). A preferred method would have
incorporated various ranges of options, randomly assigned to respondents, but survey
software limitations prevented this more sophisticated approach. The simple payment
card format used in this study was a feasible method that minimized the risk of
discouraging respondents and provided them with as much flexibility as possible, given
Respondents who indicated that they would pay nothing for these services were
presented with a follow-up question to better understand their refusal to pay. This type of
follow-up question allows respondents to disclose their motivation for refusing to pay and
can provide useful information about the respondent’s valuation. For example, a person
who refuses to pay because he is not interested in using the resource is expressing a
different motivation for his WTP than a person who refuses to pay because he cannot
afford to.
Many WTP studies include specific information about the payment vehicle, or the
method through which the hypothetical payment would occur. However, Noonan (2003)
found through his meta-analysis of WTP studies that an omitted payment vehicle did not
result in statistically different WTP responses than studies that described the payment
vehicle as a tax or a private fund (p. 169). Furthermore, explaining how a hypothetical
payment would occur added excessive length to the survey. Therefore, a specific
payment vehicle was not disclosed to survey respondents. Instead, respondents were
simply asked to select the maximum amount that they would pay to use an eBook,
eAudio book or online video through the library’s website.
In many WTP studies, information bias is minimized by providing detailed
information about the good or service to all respondents. However, “such an overview
might be new information for some respondents, rather than a clarification or a reminder
of what they are voting on” and could impact the way a respondent votes (Hider, 2008, p.
454). In this study, providing additional information about the eBook, eAudio book, and
library patrons who were already using online library resources, the assumption was
made that respondents had a basic understanding of eBooks, eAudio books, and online
videos. If respondents were unsure about a resource, they were able to select “I don’t
know” or skip the question.
Survey Distribution
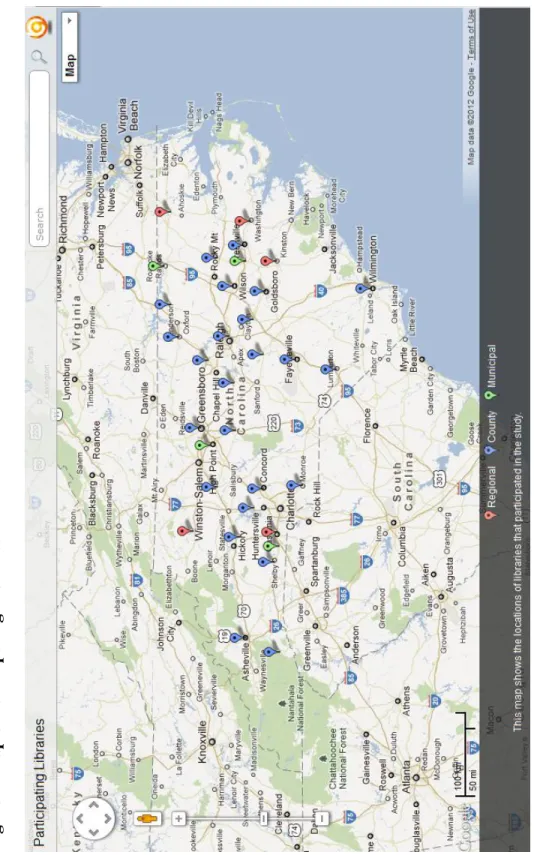
In order to make the results as generalizable as possible, all 77 North Carolina
public libraries were invited to participate in the study. Greg Needham, Director of
Sheppard Memorial Library in Pitt County, advertised the study through the North
Carolina Public Library Directors listserv. NC LIVE staff members also made phone
calls to recruit libraries for this study. Thirty-three of the 77 libraries agreed to
participate. See Appendix C for a list of all the participating libraries and a map
displaying their locations.
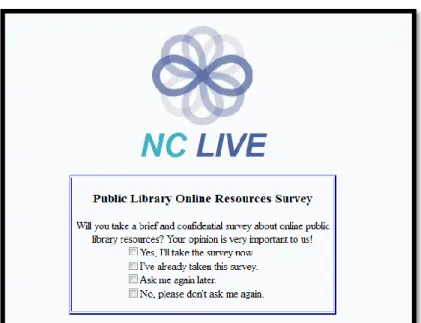
While the survey was open, library patrons from these participating libraries who
logged in to use an NC LIVE resource, or who used an NC LIVE resource at the library,
were presented with a modified “splash page.” A normal splash page displays the NC
LIVE logo while the resource is loading. But in order to invite library patrons to take the
survey, a message was displayed below the logo only for participating libraries. See
Appendix D for the standard and modified splash pages.
If a respondent clicked on “Yes, I’ll take the survey now,” a new window opened
to display the survey. Their requested resource still opened in the background, and they
were able to continue with their NC LIVE resource and minimize the survey window at
If the respondent was using a personal computer at home, clicking on “Yes, I’ll
take the survey now,” “I’ve already taken the survey,” or “No, please don’t ask me again”
gave their browser a “Survey Seen” cookie that lasted for six months. This cookie
allowed them to continue requesting NC LIVE resources without being invited to
complete the survey multiple times. If they selected “Ask me again later,” their browser
received a cookie that expired at midnight so that the survey invitation would display
again on the following day.
Patrons who responded using a public computer at the library most likely saw the
survey invitation each time they began a new internet session, no matter which option
they chose. On public computers, browsers are often set to clear the cookies each time
the program closes.
Since library patrons logged in to NC LIVE with a library card number or
library-specific password, their responses were categorized by library name. When respondents
clicked on the “Yes, I’ll take the survey now” response, the library name was captured by
Survey Monkey. After the survey was closed, the three library-specific variables were
added into the dataset with information from the State Library of North Carolina’s
website.
This study was limited to library patrons who clicked on NC LIVE-provided
resources through their libraries’ websites or by visiting the NC LIVE website directly.
The number of uses that occurred among the 33 participating libraries while the survey
was open was 16,395, but the number of unique visitors is not captured and therefore a
Findings Descriptive statistics
The survey received 471 valid responses from among the 33 participating
libraries. The following sub-sections display descriptive statistics about the respondents.
Willingness to pay
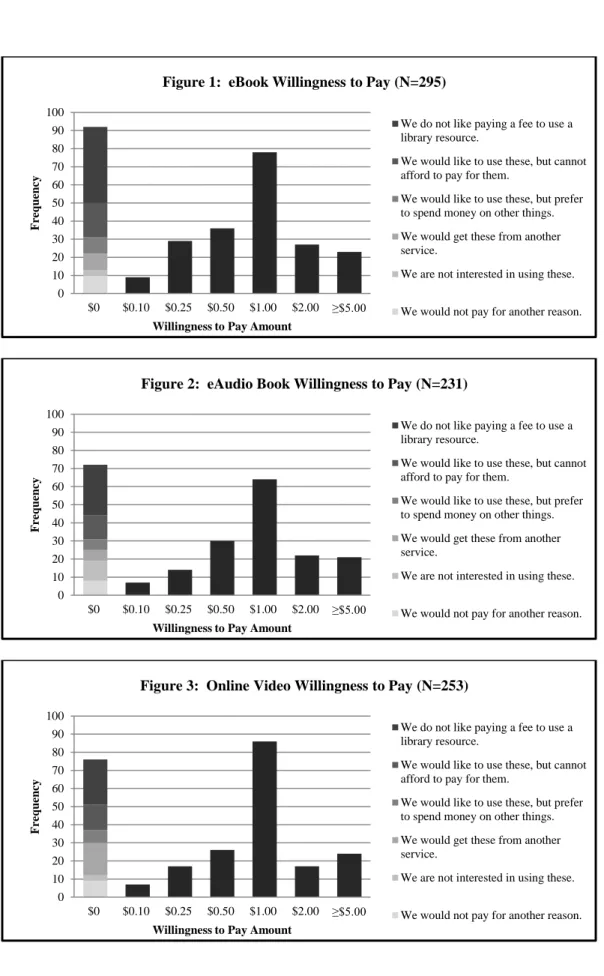
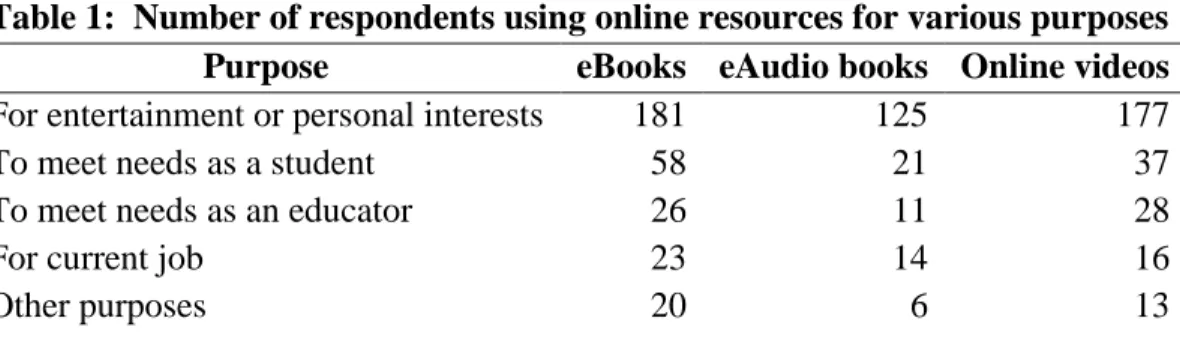
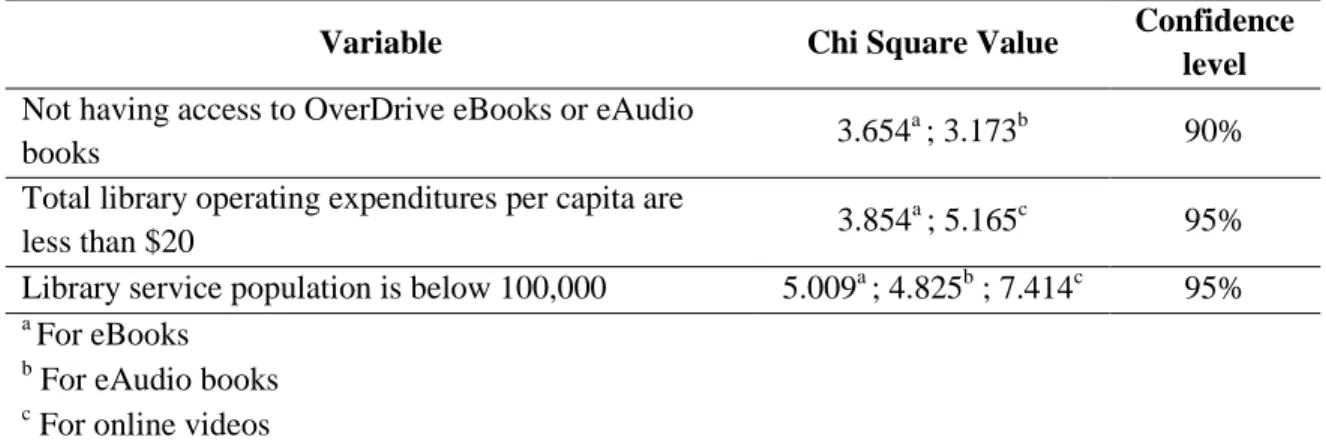
Responses for all three resources followed roughly the same pattern, with peaks at
$0 and $1.00. Respondents who selected “No opinion because we don’t use these” and
respondents who exited the survey early were excluded. Responses are highly correlated
across all three resources, indicating that people tend to provide similar valuations for the
use of eBooks, eAudio books and online videos (Pearson correlation between eBook
willingness to pay and eAudiobook willingness to pay is .919; between eBook
willingness to pay and online video willingness to pay, .877; between eAudiobook
willingness to pay and online video willingness to pay, .872.). For all three resources, the
majority of respondents are willing to pay an amount greater than $0. Among
respondents who are willing to pay something, the most common willingness to pay
response is $1.00. Among respondents who are willing to pay nothing, the most common
reason is an objection to paying a fee to use a library resource. See Figures 1, 2, and 3
0 10 20 30 40 50 60 70 80 90 100
$0 $0.10 $0.25 $0.50 $1.00 $2.00 ≥$5.00
Fr
eq
u
en
cy
Willingness to Pay Amount
We do not like paying a fee to use a library resource.
We would like to use these, but cannot afford to pay for them.
We would like to use these, but prefer to spend money on other things. We would get these from another service.
We are not interested in using these.
We would not pay for another reason. Figure 1: eBook Willingness to Pay (N=295)
0 10 20 30 40 50 60 70 80 90 100
$0 $0.10 $0.25 $0.50 $1.00 $2.00 ≥$5.00
Fr
eq
u
en
cy
Willingness to Pay Amount
We do not like paying a fee to use a library resource.
We would like to use these, but cannot afford to pay for them.
We would like to use these, but prefer to spend money on other things. We would get these from another service.
We are not interested in using these.
We would not pay for another reason. Figure 2: eAudio Book Willingness to Pay (N=231)
0 10 20 30 40 50 60 70 80 90 100
$0 $0.10 $0.25 $0.50 $1.00 $2.00 ≥$5.00
Fr
eq
u
en
cy
Willingness to Pay Amount
We do not like paying a fee to use a library resource.
We would like to use these, but cannot afford to pay for them.
We would like to use these, but prefer to spend money on other things. We would get these from another service.
We are not interested in using these.
Frequency of using online resources (during the past 12 months)
Seventy percent of respondents visited the library more than once a month
(N=455). Forty percent of respondents have used an eBook (N=412), 30 percent have
used an eAudio book (N=395), and 30 percent have used an online video (N=392)
through their library’s website. Thirty percent of respondents have paid for an eBook
(N=401), 17 percent have paid for an eAudio book (N=385), and 43 percent have paid for
an online video (N=401) using services like Netflix, Amazon and iTunes.
Satisfaction with the library’s online resources
About 40 percent of eBook users (N=152), 40 percent of eAudio book users
(N=127), and 35 percent of online video users (N=95) described their library’s selection
as “above average” or “excellent.” About 80 percent of eBook users (N=146), 70 percent
of eAudio book users (N=122), and 85 percent of online video users (N=97) thought that
using these resources through the library’s website was “somewhat easy” or “very easy.”
Purpose for using online resources
Table 1 displays the number of respondents who indicated that they use these
resources, either through the library or by paying for the service, for the following
purposes.
Table 1: Number of respondents using online resources for various purposes Purpose eBooks eAudio books Online videos
For entertainment or personal interests 181 125 177
To meet needs as a student 58 21 37
To meet needs as an educator 26 11 28
For current job 23 14 16
Importance of library services in general
Eighty-six percent of respondents said that library services are very important for
their families (N=398). Ninety-two percent of respondents said that library services are
very important for their communities (N=378).
Personal and family characteristics
Thirty-five percent of respondents are male and 65 percent are female (N=384).
Sixty-nine percent of respondents have at least a four-year college degree (N=388).
Eighty-three percent of respondents are white, 10 percent are black and 2.4 percent are
Hispanic (N=374). Nearly 50 percent of respondents are between the ages of 45 and 64
(N=379). Eighty-five percent of respondents have at least one other family member
(N=376). The most frequently selected income range was $50,000 to $74,999, with 25
percent of respondents falling into that category (N=288).
Library characteristics
Three percent of respondents are from municipal libraries, 87 percent from county
libraries, and 10 percent from regional libraries. Sixty-four percent of respondents have
access to OverDrive eBooks, 60 percent have access to OverDrive eAudio books, and 39
percent have access to OverDrive online videos through their public library. Forty-eight
percent of respondents are from libraries that spend less than $20 per capita. Fourteen percent of respondents are from libraries with service populations less than 100,000.
Cross-tabulations
Cross-tabulations were used to determine which factors are related to a library
Respondents who answered “No opinion because we don’t use these,” “I don’t know,”
and respondents who skipped the question were excluded from cross-tabulations.
Respondents who did not use these resources but did provide willingness to pay
responses were included in the analysis. Willingness to pay responses were given by
55% of eBook users, 41% of eAudio book users, and 54% of online video
non-users.
Despite the trends noted in previous literature, this study found only limited
relationships between respondent-specific variables and willingness to pay. The
following sections describe the results from the cross-tabulation analysis.
Neither the frequency of visiting the library in person, nor the frequency of using
the online resources through the library’s website, predicted whether or a not a
respondent was likely to be willing to pay to use those resources.
Statistically, respondents who used a paid service for an eBook during the past 12
months are significantly more likely to be willing to pay something for library eBooks
(N=280, chi-square value 4.650, 95% confidence). However, this relationship between
paying for an online resource and willingness to pay for the library resource was not
statistically significant for eAudio books and online videos.
Neither satisfaction with using online resources (measured by selection and ease
of use), nor the purpose for using online resources, predicted whether or not a respondent
was likely to be willing to pay, with one exception. Respondents who said that they used
online videos “to meet needs as an educator” are statistically significantly less likely to be
The importance of library services in general, whether to family or to community,
did not predict whether or not a respondent was likely to be willing to pay.
Personal and family characteristics (gender, education level, ethnicity, age,
number of family members and income) did not predict whether or not a respondent was
likely to be willing to pay.
In contrast to most respondent-specific variables, library-specific variables are
able to predict whether or not respondents are willing to pay. Respondents are more
likely to be willing to pay if they are coming from libraries that do not have access to
OverDrive resources, spend less than $20 per capita on library services, and have a
service population below 100,000. See Table 2 for statistical output.
Table 2: Library-specific variables that predict willingness to pay
Variable Chi Square Value Confidence
level
Not having access to OverDrive eBooks or eAudio
books 3.654
a
; 3.173b 90%
Total library operating expenditures per capita are
less than $20 3.854
a
; 5.165c 95%
Library service population is below 100,000 5.009a ; 4.825b ; 7.414c 95%
a
For eBooks
b
For eAudio books
c
Discussion
The findings from this study offer several contrasts to the existing literature about
public library patron willingness to pay. The following sections will highlight the
implications of these findings as they relate to public libraries’ present and future work.
Willingness to Pay Responses
The high correlation between the willingness to pay responses for all three
resources is noteworthy. People are generally willing to pay the same amount for
eBooks, eAudio books and online videos. This finding could help public library
administrators make collection development decisions that provide the biggest return on
investment. For instance, if a cost discrepancy exists between different types of online
resources, public libraries might decide to focus their financial resources upon acquiring,
supporting and distributing lower-cost online resources since the value derived from all
three appears to be roughly similar.
The frequency of $0 responses should not be surprising. As David Reibstein,
Professor of Marketing at the Wharton School, explains, “Once people have gotten things
for free, it’s hard to get them used to having to pay for it” (Wharton School, 2002). A
different theory about the $0 responses comes from research about online versus in-print
news. Hal Varian, a Google economist, used data from the Google news site to see how
much time people were spending with online news resources. He found that people were
likely to consume little bits of news over the course of the day, and they were less likely
unwillingness to pay for online news resources is that “People who click on a news
article or a video at work as a distraction from other tasks aren't going to want to pay for
it. People are willing to pay for newspapers not because they're used to paying […] but
because ‘It's a much nicer experience to sit there with a newspaper and a cup of coffee
and have that be your leisure time activity’” (Beckett, 2010). Likewise, libraries should
pay attention to how their patrons are using these online resources—not only for what
purposes, but in what contexts and for how long. This research on information behavior
could help libraries better understand the expectations of their patrons and would be
particularly important for libraries that are considering charging per-use fees for certain
resources.
The frequency of $1.00 responses could be the result of an “iTunes” or “app”
effect. In many online and mobile environments, instant satisfaction is only $.99 away.
Regardless of what resource people are trying to access, they are accustomed to paying
about a dollar for online and mobile resources. This theory could explain why $1.00 was
the most popular response among respondents willing to pay something for these
resources. Since this study did not ask respondents to explain their responses if they were
willing to pay an amount greater than $0, more research is needed to understand why
these respondents chose $1.00.
By further analyzing the responses of the people who are willing to pay nothing,
we can better understand the perspective of these respondents. The response “We don’t
like paying a fee to use a library resource” was selected most frequently among
this case, a per-use fee). Some studies exclude protest responses from the analysis in
order to minimize their effect upon the average willingness to pay. In this study,
however, protest responses were included in the analysis because it provided a more
conservative estimate of overall WTP. As AabØ (2004) demonstrated, excluding the
protest responses generally results in higher WTP estimates (p. 183), which can
potentially inflate the perceived value beyond real WTP. The frequency of these protest
responses should indicate to library administrators that a per-use fee is often
objectionable to library patrons. In this economic climate, many library administrators
are looking for ways to diversify their funding, but they should consider that charging
people on a per-use basis for online resources could be met with opposition.
Factors Unrelated to Willingness to Pay
The use of these online resources is not related to willingness to pay. Patrons who
did not use these resources are not more or less likely to be willing to pay than patrons
who did use these resources. This result may indicate that online library services hold
value for patrons who choose not to use them. A comparison of users and non-users of
eBooks, eAudio books and online videos revealed no remarkable differences in terms of
demographics. However, this study only surveyed respondents who were already
accessing some type of online resource (including databases). It is possible that if we
look at patrons who are using any type of online resource and compared them to library
patrons who are not using any type of online resource, we might observe some
differences between these two groups. This research could be extremely valuable to
will need to make sure that their resources are still accessible to all types of people in
their communities.
“Library love,” or how important respondents thought library services in general
were for their families and communities, is not related to willingness to pay. In previous
studies (e.g., Simonsen & Robbins, 2003), a relationship between people’s attitudes
towards the service and their willingness to pay had been found, but in this study, no
relationship could be established between the importance of services and willingness to
pay. One potential explanation is that using online resources is a less personal experience
than an in-person visit to the library, making respondents less likely to be influenced by
their positive feelings about library services in general. Since libraries often rely on
“library love” from the community to defend against budget cuts, libraries should
consider that online library resources may not inspire the same “warm and fuzzy”
feelings as a visit to the library. As libraries change their focus to online resources, they
should consider if patrons’ perceptions of the library are also likely to change and, if so,
what impact these changes will have upon their organizations.
Previous studies (e.g., Morris et al., 2002; AabØ, 204; Hider, 2008) have shown
relationships between willingness to pay and personal and family characteristics, but this
study does not follow that trend. Age, number of family members, income, education,
ethnicity and gender do not predict whether or not respondents are willing to pay. The
group of respondents from this study is skewed towards female, white and well-educated,
however enough variation exists to adequately complete an analysis. It would be
traditional library services. The skew in respondents might also be the result of a
self-selection bias. It is possible that some groups of people are more inclined to respond to
surveys than others. More research is needed to determine if libraries are successfully
marketing their online resources to all of their patrons, particularly since libraries will
continue to increase their reliance upon online information resources.
Factors Related to Willingness to Pay
The finding that respondents who used online videos to meet their needs as
educators are less likely to be willing to pay could indicate that educators think that they
should not have to use their personal resources for educational materials. However, since
this effect was only observed in the case of online videos, more research is needed to see
if this relationship can be observed in other contexts.
The finding that people who paid for eBooks are more likely to be willing to pay
was not surprising. People who are accustomed to paying for a good in the marketplace
might be more inclined to pay for a substitute public good. It is worth mentioning,
however, that this finding was not statistically significant for eAudio books or online
videos, and more research would help libraries gain more understanding about this
potential relationship between paying for a resource and WTP.
The three library specific variables are all statistically significant for predicting
willingness to pay and are highly correlated. In other words, libraries with higher
spending per capita are likely to have OverDrive resources and a larger service
population. It is possible that people who come from larger library systems with many
resources know that they are making significant financial contributions to the library
libraries with fewer resources are aware of the limitations their libraries face, and
therefore place a higher value upon the resources that are available. These findings offer
encouragement for small libraries to seek out partnerships to increase their patrons’
Conclusion
This study measured the value of library-provided eBooks, eAudio books, and
online videos to North Carolina public library patrons and investigated the relationship
between respondent and library characteristics and the perceived value of these resources.
Although this study provides some interesting findings for public library administrators,
this study does not measure the full economic or cultural value of these resources. It only
measures the monetary value that patrons assign to the hypothetical use of eBooks,
eAudio books and online videos. In that sense it is a conservative estimate of the value
that these resources provide to their communities. While this estimate may be useful to
public library administrators, it is important to remember that libraries have more to offer
their communities than a number preceded by a dollar sign. The value of preserving local
history, supporting early childhood literacy and connecting communities to new
technologies cannot be easily measured with monetary terms. Matthews (2011) suggests
that public libraries “consider developing a new out-of-the-box [return on investment]
measure that communicates the value of the library. Perhaps we should consider a return
on imagination, a return on innovation, a return on ideas, a return on improvement, a
return on inquisitiveness […]” (p. 14). Alternative measures of value could provide a
richer story for the benefits of libraries, but the challenge for libraries will be finding a
References
Aabo, S. (2009). Libraries and return on investment (ROI): A meta-analysis. New Library
World, 110 (7/8), 311-324.
Aabo, S. (2004). Valuing the benefits of public libraries. Information Economics and
Policy, 17, 175-198.
Amazon. (n.d.). Kindle store. Retrieved December 6, 2011, from Amazon.com:
http://www.amazon.com/kindle-store-ebooks-newspapers-blogs/b?ie=UTF8&node=133141011
Beckett, L. (2010, January 28). Google economist explains why you won't pay for online
news. Retrieved March 25, 2012, from SF Weekly:
http://blogs.sfweekly.com/thesnitch/2010/01/google_economist_explains_why.ph
p
Carson, R. T., Mitchell, R. C., Hanemann, M., Kopp, R. J., Presser, S., & Ruud, P. A.
(2003). Contingent valuation and lost passive use: Damages from the Exxon
Valdez oil spill. Environmental and Resource Economics, 25, 257-286.
Chung, H.-K. (2008). The contingent valuation method in public libraries. Journal of
Librarianship and Information Science, 40 (2), 71-80.
Elliott, D. S., Holt, G. E., Hayden, S. W., & Holt, L. E. (2007). Measuring Your Library's
Value: how to Do a Cost-Benefit Analysis for Your Public Library. Chicago:
Goldberg, B. (2011, December 21). LSSI Gets Its First Florida Library Contract, Eyes
Simi Valley. Retrieved March 21, 2012, from American Libraries:
http://americanlibrariesmagazine.org/news/12212011/lssi-gets-its-first-florida-library-contract-eyes-simi-valley
Hider, P. (2008). Using the contingent valuation method for dollar valuations of library
services. The Library Quarterly, 78 (4), 437-458.
Holt, G. E., Elliott, D., & Moore, A. (1999). Placing a value on public library services.
Public Libraries, 38 (2), 98-99.
Kaser, D. (2010, June). Proving your worth. Information Today, 27 (6), p. 16.
Lee, S.-J., Chung, H.-K., & Jung, E.-J. (2010). Assessing the warm glow effect in
contingent valuations for public libraries. Journal of Librarianship and
Information Science, 42 (4), 236-244.
Lown, C., & Davis, H. (2009, April 1). Are you worth it? What return on investment can
and can't tell you about your library. Retrieved June 10, 2011, from In the
Library with the Leadpipe:
http://www.inthelibrarywiththeleadpipe.org/2009/are-you-worth-it-what-return-on-investment/
Mankiw, N. G. (2009). Principles of Economics (5th Edition ed.). Mason, OH:
South-Western Cengage Learning.
Matthews, J. R. (2011). What's the return on ROI? Library Leadership & Management,
25 (1), 1-14.
Mitchell, R. C., & Carson, R. T. (1989). Using Surveys to Value Public Goods: The
MLA. (2008). Value Calculator. Retrieved March 26, 2012, from Massachusetts Library
Association: http://69.36.174.204/value-new/calculator.html
Morris, A., Sumsion, J., & Hawkins, M. (2002). Economic value of public libraries in the
UK. Libri, 52, 78-87.
Neiburger, E. (Director). (2010). Eli Neiburger at the LJ/SLJ eBook Summit: Libraries
Are Screwed, Part 1 [Motion Picture].
Neiburger, E. (Director). (2010). Eli Neiburger at the LJ/SLJ eBook Summit: Libraries
are Screwed, Unless... Part 2 [Motion Picture].
Noonan, D. S. (2003). Contingent valuation and cultural resources: A meta-analytic
review of the literature. Journal of Cultural Economics, 27, 159-176.
OCLC. (2010). Perceptions of libraries, 2010: Context and community. Retrieved
November 30, 2011, from OCLC:
http://www.oclc.org/reports/2010perceptions/2010perceptions_all.pdf
Pung, C., Clarke, A., & Patten, L. (2004). Measuring the economic impact of the British
Library. New Review of Academic Librarianship, 79-102.
Simonsen, B., & Robbins, M. D. (2003). Reasonableness, satisfaction, and willingness to
pay property taxes. Urban Affairs Review, 38, 831-854.
Steffen, N., Lietzau, Z., Lance, K. C., Rybin, A., & Molliconi, C. (2009). Public
libraries-- A wise investment. Denver: Library Research Services.
Steyn, P. (2003). Exxon Valdez. In S. I. Kutler (Ed.), Dictionary of American History
(3rd ed. ed., Vol. 3, pp. 305-306). New York: Charles Scribner's Sons.
Wharton School. (2002, November 25). Will consumer be willing to pay for their
formerly free lunch on the internet? Retrieved March 25, 2012, from Knowledge
at Wharton:
http://www.wharton.universia.net/index.cfm?fa=viewArticle&id=407&language=
Appendix A: List of Variables
Factor Variable How measured
Frequency of using resources
Frequency of visiting library in person
More than once a week Once a week
More than once a month, but less than once a week
Once every 1-2 months Once every 3-6 months Once
Not at all I don’t know
Frequency of using online library resources
More than once a week Once a week
More than once a month, but less than once a week
Once every 1-2 months Once every 3-6 months Once
Not at all I don’t know
Frequency of using a paid substitute (Amazon, Netflix,
iTunes)
More than once a week Once a week
More than once a month, but less than once a week
Once every 1-2 months Once every 3-6 months Once
Not at all I don’t know
Satisfaction with online library services Selection Poor Below average Average Above average Excellent
We haven’t used these I don’t know
Ease of use
Very easy Somewhat easy Somewhat difficult Very difficult
We haven’t used these I don’t know
Purpose Purpose for using resources
To meet needs as a student For entertainment or personal interests
To meet needs as an educator For job searching
Factor Variable How measured
General importance of library services
Importance of library services for family
Not important at all Somewhat unimportant Neutral
Somewhat important Very important
Importance of library services for community
Not important at all Somewhat unimportant Neutral
Somewhat important Very important
Personal and family characteristics Age 18-24 25-34 35-44 45-54 55-64
65 years and over
Ages and number of family members
Indicate number within specified ranges: 0-5 6-11 12-17 18-24 25-34 35-44 45-54 55-64 65 and over
Income
Less than $15,000 $15,000-$24,999 $25,000-$34,999 $35,000-$49,999 $50,000-$74,999 $75,000-$99,999 $100,000-$124,999 $125,000-$149,999 $150,000-$199,999 More than $200,000 I prefer not to answer I don’t know
Education
Less than high school High school/GED Some college 2-year college degree (Associate’s degree) 4-year college degree (Bachelor’s degree)
Master’s/Doctoral/Professional degree
Other
I prefer not to answer
Gender
Male Female
Factor Variable How measured
Personal and family
characteristics (cont.) Ethnicity
White or Caucasian Black or African-American American Indian or Alaskan Native
Asian
Native Hawaiian or other Pacific Islander
Latino Other
I prefer not to answer
Library-specific characteristics
Access to OverDrive resources Yes/No (Data from OverDrive.com)
Total operating expenditures per capita
Data from State Library of North Carolina
Legal service population Data from State Library of North Carolina
Value
Willingness to pay
No opinion because we don’t use these $0 $.10 $.25 $50 $1.00 $2.00 $5.00 >$5.00
Explanation of $0 valuation
We would like to use these, but cannot afford to pay for them We would like to use these, but prefer to spend money on other things
We would get these from another service
We are not interested in using these
We do not like paying a fee to use a library resource
Appendix C: Participating Libraries
Library Name Number of
Respondents
Albemarle Regional Library 1
Appalachian Regional Library 14
Beaufort-Hyde-Martin Regional Library 4
Buncombe County Public Libraries 38
Cabarrus County Public Library 20
Catawba County Library 8
Chatham County Public Libraries 9
Cleveland County Library 3
Cumberland County Public Library 35
Davidson County Public Library 9
Davie County Public Library 4
Durham County 79
Edgecombe County Memorial Library 4
Farmville Public Library 0
Gaston-Lincoln Regional Library 26
Granville County Library 4
Greensboro Public 32
Harnett County Public Library 3
High Point Public 12
Kings Mountain/Mauney Memorial Library 0
Neuse Regional Library 3
New Hanover County Public Library 15
Public Library of Johnston County & Smithfield 8
Randolph County Public Library 5
Roanoke Rapids Public Library 3
Robeson County Public 3
Sheppard Memorial Library/Pitt County 15
Transylvania County Library 10
Union County Public 12
Wake County Public Libraries 67
Warren County Memorial Library 15
Wayne County Public Library 2
Wilson County Public Library 8
Figu
re
4: M
ap
of P
ar
tic
ip
at
in
g Li
b
rar
Appendix D: Splash Page Survey Invitation
Figure 5: Regular splash page