Technical Report
Are Wastewater Treatment Residuals Applications The Major Source Of
Perfluorienated Compounds (PFC) Contamination? An Analysis of Two
Counties in The Cape Fear River Basin, North Carolina
By: Jianhan (Vance) Wang
In partial fulfillment of the requirements for degree of
Masters of Science in Environmental Engineering
University of North Carolina Chapel Hill
1
Abstract
An initial database of wastewater sludge application is built to test whether wastewater
sludge application is the major source of Perfluorinated Compounds (PFC) contamination in
Cape Fear River Basin. A Land use regression (LUR) model is framed to analyze the association
between wastewater sludge applications and PFC contamination based on three approaches:
Euclidean distances, River distances, and Flows. The wastewater sludge application database
covers a 10-year time period consisting of 2001-2002 and 2004-2011, and two counties with the
highest PFC contamination in Cape Fear River Basin. The database indicates that the wastewater
sludge applications have been on the rise during the study time period. Statistically insignificant
LUR results indicate that (1) sludge application is not the main source of PFC contamination, or
(2) sludge application is the main source of PFC contamination, but more data are needed to test
2 Introduction
Perfluorienated Compounds (PFCs) are environmental persistent contaminants, which are
resistant to water, oil, and heat [1]. At the same time, they are found in wildlife and human
bodies due to bio-accumulation processes [2]. The U.S. Environmental Protection Agency (EPA)
claimed that PFC exposure can cause endocrine disruption and even cancer in animal studies;
however, the acute health outcome on human has not been fully studied [1] [2]. Human can be
exposed to PFC through consuming contaminated water or food [1]. Kanan et al. reported that
PFCs have been detected in human blood samples regularly in the last decade [3]. In January
2015, the EPA published the Significant New Use Rule to reinforce PFC regulations. The rule
requires manufacturers to report any use of long chain PFC 90 days prior to the EPA for
evaluation purpose after December, 2015 [4]. The EPA has the right to prohibit or limit the use
of PFC if necessary [4]. In North Carolina, PFC monitoring data indicated that the Cape Fear
Basin has been contaminated since 2006. The Cape Fear River Basin is the largest basin in North
Carolina, covering 9300 km2 in space and 20% total population of the state [5]. Thus, it would be meaningful to discover the polluting sources of PFC in order to better regulate and control the
emission in the upcoming future.
Since PFCs are persistent compounds, they are likely to remain in wastewater treatment
sludge during the treatment processes at wastewater treatment plants. Lindstorm et al. indicated
that previous studies have found the presence of PFCs in wastewater treatment residuals (herein
also referred to as wastewater sludge) [6]. Therefore, the wastewater sludge applied in
3
contamination in the river waters. The PFC sampling sites used by the EPA are primarily located
along the Cape Fear Basin River with a predominance of sampling in Alamance County and
Chatham County. However less information is readily available about the land application of
wastewater sludge. This information is contained in paper copies of wastewater treatment
residuals application reports, but not in an electronic format that is publicly available. The lack
of a publicly available database of wastewater treatment residuals application hinders the ability
to study whether wastewater treatment residual land application is a source of PFC in the river
waters, which in turn makes it difficult to regulate this possible source of contamination.
The goal of this work is it to take a first step at quantifying the impact of wastewater sludge
application on PFC levels. Since there does not exist a database of sludge applications, an
important part of the work will be to start the construction of a database of wastewater treatment
residuals applications in a limited area of the Cape Fear River Basin, and then using this limited
database to test whether wastewater sludge applications are associated with PFC contamination.
An adequate framework to test this association is to develop a land use regression (LUR) model.
In this work we will test the association between wastewater sludge applications and PFC levels
using a land use regression based on Euclidean distances, river distances, and flows. Hence, the
specific objectives of this work are to (1) construct a database of wastewater sludge land use
applications in a limited area of the Cape Fear River Basin, (2) apply Quality Assurance/ Quality
Control (QA/QC) methods to assure data quality, (3) visualize the spatial and temporal
distribution patterns of wastewater sludge applications, (4) construct a land use regression model
using three approaches, which are based on (2a) Euclidean distances, (2b) river distances, and
4
wastewater treatment residuals applications are the major source of PFC contamination in the
Cape Fear River Basin.
Materials and Methods
PFC and Land Use Application Data Sources.
PFC monitoring data were originally acquired from the EPA as an Excel spreadsheet. The
database contained 600 valid measurements of PFC concentration in Cape Fear River Basin and
crossed the time period of 2006 to 2013 (Table 1). Monitoring sites’ geographical location and
the monitoring dates are also recorded in the Excel spreadsheet. The spatial distribution of the
PFC data is shown in Figure 1 across the Cape Fear River hydraulic network.
Table 1. PFC Monitoring Data Acquired From EPA
Year # Valid Measurements
2006 79
2010 12
2011 17
2012 48
2013 444
5
Figure 1. PFC Monitoring Data Mapped Across The Cape Fear River Basin.
Wastewater sludge land use application data includes two components: land use application
permits and land use application annual reports. The land use application permits contain
information on the geographical coordinates, permit number, unique identifier, and the applying
county for each permitted field. The permits were acquired as an Excel spreadsheet from Ed
Hardee, Environmental Specialist at the North Carolina Department of Environmental and
Natural Resources (NC DENR), Division of Water Resource, Water Quality Permitting Section,
Non-Discharge Permitting Unit. The spatial distribution of permits issued in Cape Fear River
6
Figure 2. PFC Monitoring Data Mapped With Wastewater Sludge Land Use Application Permits.
Land use application annual reports record the actual amount of annual land use application
for each permitted field only if at least one application has been applied on the field during the
year. In this work, the annual reports were acquired mainly for three counties: Alamance,
Chatham, and Cumberland. Since the PFC monitoring data spanned a relatively long time period
(2006-2013), the land use application annual reports were collected for a 10 year period (2001 to
2011) to provide information on wastewater land applications that matches that for the PFC
monitoring data.
The reports were obtained from three different sources depending on the time period. (a)
2008 to 2011 Land use application annual reports were acquired from NC DENR, Division of
7
Ed Hardee provided access to these reports. (b) 2005 to 2007 land use application annual reports
were originally acquired from Alexander Keil, currently a post-doc fellow in the Department of
Epidemiology at University of North Carolina Chapel Hill [7]. (c) 2001 to 2004 land use
application annual reports were acquired from the North Carolina State Records Center, North
Carolina Department of Cultural Resources (Table 3). The State Records Center does not have
any sludge application data on file for year 2003, so sludge application data that for that year are
missing.
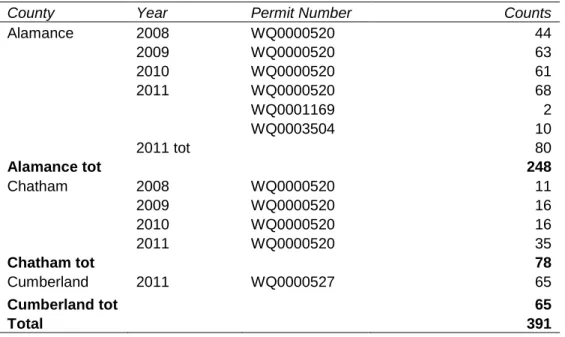
Table 2. 2008-2011 Annual Reports Collected from NC DENR
County Year Permit Number Counts
Alamance 2008 WQ0000520 44
2009 WQ0000520 63
2010 WQ0000520 61
2011 WQ0000520 68
WQ0001169 2
WQ0003504 10
2011 tot 80
Alamance tot 248
Chatham 2008 WQ0000520 11
2009 WQ0000520 16
2010 WQ0000520 16
2011 WQ0000520 35
Chatham tot 78
Cumberland 2011 WQ0000527 65
Cumberland tot 65
Total 391
Table 3. 2001-2004 Annual Reports Collected from State Records Center
County Year Permit Number Counts
Alamance 2001 WQ0000520 52
2002 WQ0000520 4
2004 WQ0000520 26
Alamance tot 82
Chatham 2001 WQ0000520 0
2002 WQ0000520 13
2004 WQ0000520 7
8
Total 102
The annual reports filed with the NC DENR and the State Records Center are archived as
paper hard copies and sorted by the permit number and year of application. The annual reports of
Alamance County, Chatham County, and Cumberland County were scanned and turned into
electronic PDF documents for further data entry purpose. A total number of 391 and 102 annual
reports were scanned from NC DENR and the State Records Center, respectively. An electronic
database of the 2005 to 2007 annual reports for the whole state were acquired as Excel file from
Alexander Keil, and a total number of 46 land use applications located in Cape Fear River Basin
were selected from that database. In summary, for year 2001-2004 and 2008-2011, 493
(102+391=493) land use application annual reports were scanned and saved as PDF documents,
and 46 data reports were selected from the 2005-2007 land use application Excel file, resulting in
a total number of 539 reports that were collected from different sources.
Database Construction
All the PDF files created by scanning land use application annual reports were named after
the corresponding unique identifiers, and were sorted by county of application, the year of
application, and lastly the permit numbers. A wastewater sludge land application database was
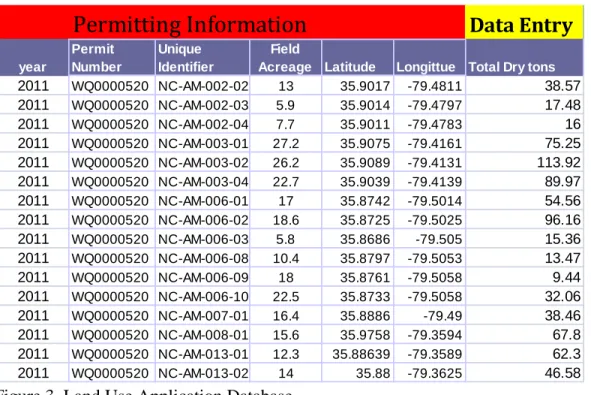
created by data entry of information abstracted from these scanned land use application reports.
The database includes the Permitting Information and the Data Entry of the Total Dry Tons
applied (Figure 3). The permitting information was directly acquired from the permits Excel
spreadsheet, which includes the information of the permit numbers, application field unique
identifiers, and permitting year. Data Entry was performed by manually identifying the amount
9
report (PDF files), and typing that value into the corresponding row of the Data Entry Column by
matching the unique identifier.
For the 2005-2007 land use application data reports, a total number of 381valid land use
application reports spreading the whole state were identified; however, only 46 out of the 381
reports were located in Cape Fear River Basin and were added into the land use application
database.
Figure 3. Land Use Application Database
In summary, a total number of 539 land use application data reports have been used to
construct the database; however, a certain amount of the reports were unable to match the
corresponding permitting information and therefore they were eliminated from the database. The
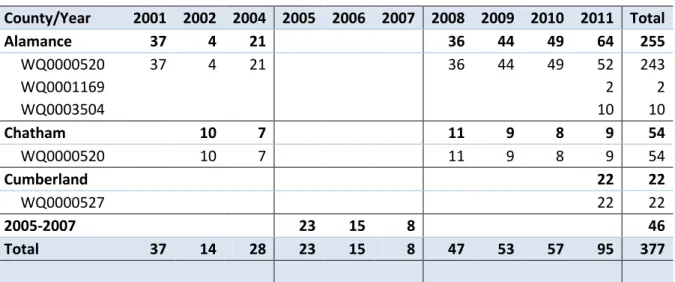
remaining 377 valid reports, covering a 10 year time period in the Cape Fear River Basin, were
selected to create the land use application database (Table 4). The database consists of 255 land
use application reports for Alamance County, 54 reports for Chatham County, 22 reports for
Cumberland County, and 46 reports spread in other parts of the Cape Fear River Basin.
Permitting Information
Data Entry
year Permit Number Unique Identifier Field
10
Table 4. Total Summary Table of the Land Use Application Database
County/Year 2001 2002 2004 2005 2006 2007 2008 2009 2010 2011 Total
Alamance 37 4 21 36 44 49 64 255
WQ0000520 37 4 21 36 44 49 52 243
WQ0001169 2 2
WQ0003504 10 10
Chatham 10 7 11 9 8 9 54
WQ0000520 10 7 11 9 8 9 54
Cumberland 22 22
WQ0000527 22 22
2005-2007 23 15 8 46
Total 37 14 28 23 15 8 47 53 57 95 377
Land Use Regression (LUR) Modeling.
The LUR model provides a statistical framework to quantify the impact of plausible
contaminating sources on PFC levels in the surface water. In this study, we only focus on land
use sludge application as the sole point source of PFC contamination. Future works should
consider the combined effect of land use sludge application and other (net yet determined)
potential sources. The LUR model is constructed using various hydrological distances between
the point source and the PFC monitoring sites. The LUR framework allows investigating the
value of the decay range, defined as the distance over which a given point source (i.e. sludge
application field) impacts PFC levels in the surrounding surface waters. We replace PFC
monitoring data measured below detection limits with half of the smallest value detected above
zero.
In the LUR model, the estimated PFC level Z is expressed as
11
where Zi is the log transformed estimated PFC concentration for sample i with the unit of ppt;
are linear regression coefficients, and is the linear regression model error term with
units of ppt.
For the (Euclidean or river) distance based LUR, the explanatory variable Xi (expressed with
units of tons) is calculated as the sum of exponentially decayed contribution from each
surrounding sludge application field, which can be expressed as [8]
(2)
where is a proxy for the effluent PFC concentration, which is approximated as PFC mass
(e.g. dry ton of sludge) at application field j, Dij is the Euclidean or River distance (km) between
monitoring site i and sludge application field j, n is the number of sludge application fields
surrounding monitoring site i, and a is the exponential decay distance (km) defining the range of
influence of the pollution source. This model accounts for the exponential decay of PFC
concentration as a function distance traveled from the polluting source.
For the flow based LUR model, Xi with units of ton/deg is re-defined as
(3)
where is a proxy for PFC mass (e.g. dry ton of sludge) applied at application field j, Qi is a
proxy for the river flow at monitoring point i which we approximate as the accumulative river
length upstream of PFC monitoring site i (with units of degrees), and is an indicator value
that is equal to 1 if site i and field j are flow-connected and 0 otherwise. This model ensures that
12
mass as a function of downstream distance as well as the exponential decay of PFC mass as a
function of travel distance (primarily due to removal processes as opposed to degradation since
PFC are environmentally persistent compounds).
Compared to the distance based (Euclidean and River) LUR models, the flow based LUR
model should be able to better predict modeling results in theory. However, due to the limitation
of the flow data used in this work, all three models will be tested to select the best model of
predicting PFC contamination in surface water.
Selection of the Decay Distance Parameter and Comparison of Models
For each model, the decay distance parameter α will be selected by choosing the value that
leads to a statically significant model (p<0.01) that is physically plausible ( >0) and maximizes
the coefficient of determination R2 between modeled and observed values. The three models
developed in this work will then be analyzed based on the R2 corresponding to the decay distance
parameter α selected for each model.
Results
Land Use Application QA/QC
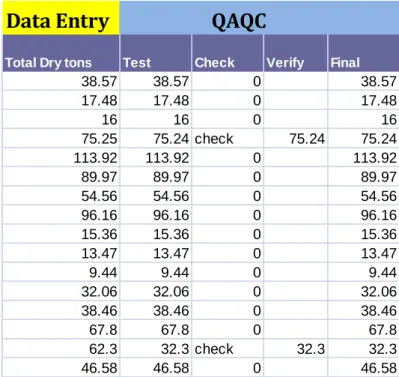
A QA/QC procedure was performed as follow: Every data entry from the Data Entry column
was manually entered a second time (in the Test column) without looking of the first data entry
in order to check for data entry errors. An Excel programming command
(“=IF(HX-GX:=0,0,"check")”) was used to detect numeric differences between the two inputted values, and
to output the word “check” in the Check column if a numeric difference is detected. In such
13
verified. The finalized values are listed in the “Final” column (Figure 4). A total number of 15
errors were detected by applying the QA/QC method, which means the initial error rate was 4%
(15/377), which can be reduced to 0.16% (0.6/377) by applying the QA/QC method.
Figure 4. Land Use Application Database QA/QC
Land Use Application Statistics.
This work created an electronic database of the wastewater sludge land applications that
occurred in an area of the Cape Fear River Basin comprised of two counties (Alamance and
Chatham) and a portion of a third county (Cumberland) over a ten year period (2001-2002,
2004-2011). This is the first database that makes this information available in an electronic format and
provides a detailed listing of the yearly amounts of land applied sludge (dry tons) over a 10 year
period. This database provides the ability to describe the spatial distribution of amounts applied
for any time periods of interest, or for the overall study period.
Data Entry
QAQC
Total Dry tons Test Check Verify Final
38.57 38.57 0 38.57
17.48 17.48 0 17.48
16 16 0 16
75.25 75.24 check 75.24 75.24
113.92 113.92 0 113.92
89.97 89.97 0 89.97
54.56 54.56 0 54.56
96.16 96.16 0 96.16
15.36 15.36 0 15.36
13.47 13.47 0 13.47
9.44 9.44 0 9.44
32.06 32.06 0 32.06
38.46 38.46 0 38.46
67.8 67.8 0 67.8
62.3 32.3 check 32.3 32.3
14
Based on the wastewater sludge application database created in this work, we find that the
mean amount of wastewater sludge applied per field throughout 2001-2002 and 2004-2011 is 56
dry tons, with a corresponding standard deviation of 50 tons (Table 5). The amount of
wastewater sludge applied per field ranges from 0.2 tons to 397 tons, corresponding
approximately to a 2000 fold difference between smallest to largest application amounts, which
indicates that land application of sludge is highly variable from field to field and year to year.
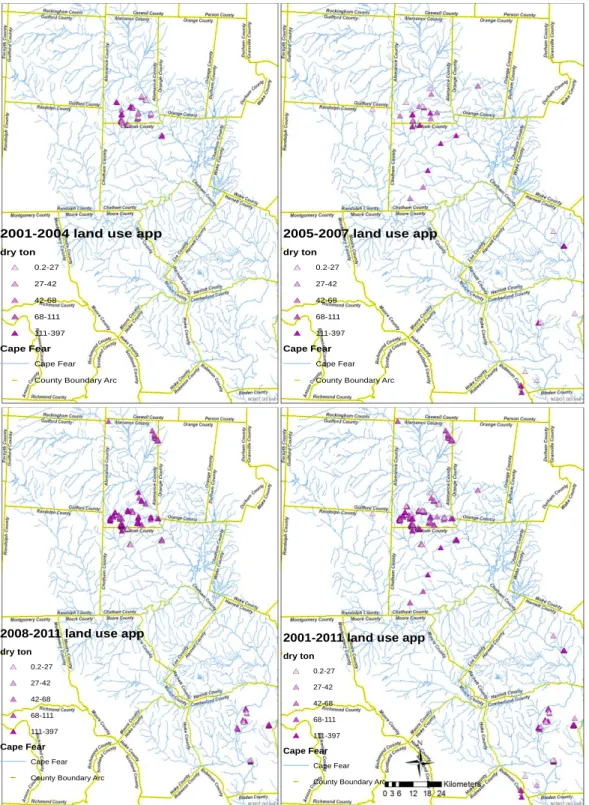
The temporal variability of applications can be explored by dividing applications in three time
periods: 2001-2002 and 2004, 2005-2007, and 2008-2011 (Table 5). The application data were
further mapped in ArcGIS (Figure 5). The mean statistics indicates that wastewater sludge
applications during 2008-2011 have the smallest average amount at 51 tons/field, which is
smaller than that of the other two preceding periods, and indicates that the amount of sludge
applied per field decreased in the last period. However, the number of applications/year indicates
that sludge applications happened most frequently during the later period (2008-2011), which
experienced 63 applications/year. This rate of applications is approximately 2 to 4 times that of
the preceding time periods, indicating that there was a substantial increase in the total number of
applications in the last period (252 applications) compared to the two preceding periods (79 and
46 applications, respectively).
According to the information collected from the non-discharge permitting system at NC
DENR, the amount of land use application permits remain at approximately 115 permits each
year during 2001-2011. As noted above, the number of applications increased, while the number
of permits remained the same. This means that the rate of usage of permitted fields has increased.
Indeed, the fraction of permitted fields that were used for land application of sludge was only
15
and this usage rate increased considerably to reach about 55% (63 out of 115) in the last time
period.
The overall effect of applying slightly less sludge on each field, but substantially increasing
the number of fields used for land application, resulted in a net increase of the total amount of
sludge applied over time. Put in other words, the total amount of sludge applied during the whole
study period (21,112 dry tons applied during 2001-2002 and 2004-2011) comes predominantly
from applications during the last time period (i.e. from the 12,845 dry tons applied in
2008-2011).
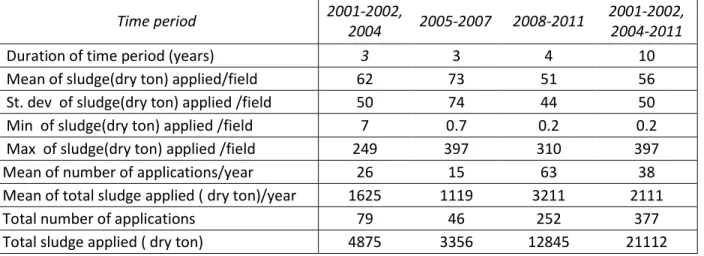
Table 5. Statistics for the amount of sludge (dry tons) applied on each agricultural field for different time periods
Time period 2001-2002,
2004 2005-2007 2008-2011
2001-2002, 2004-2011
Duration of time period (years) 3 3 4 10
Mean of sludge(dry ton) applied/field 62 73 51 56
St. dev of sludge(dry ton) applied /field 50 74 44 50
Min of sludge(dry ton) applied /field 7 0.7 0.2 0.2
Max of sludge(dry ton) applied /field 249 397 310 397
Mean of number of applications/year 26 15 63 38
Mean of total sludge applied ( dry ton)/year 1625 1119 3211 2111
Total number of applications 79 46 252 377
16
2005-2007 land use app
dry ton # * 0.2-27 # * 27-42 # * 42-68 # * 68-111 # * 111-397 Cape Fear Cape Fear County Boundary Arc
2001-2004 land use app
dry ton # * 0.2-27 # * 27-42 # * 42-68 # * 68-111 # * 111-397 Cape Fear Cape Fear County Boundary Arc
2008-2011 land use app dry ton # * 0.2-27 # * 27-42 # * 42-68 # * 68-111 # * 111-397 Cape Fear Cape Fear County Boundary Arc
2001-2011 land use app dry ton # * 0.2-27 # * 27-42 # * 42-68 # * 68-111 # * 111-397 Cape Fear Cape Fear County Boundary Arc
17 LUR Results
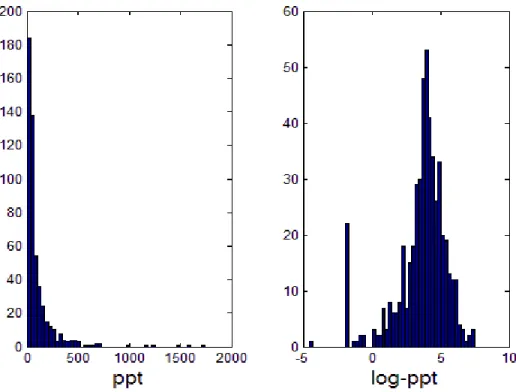
The PFC distribution is skewed toward high values; however the skewness of the data largely
disappears after log transformation (Figure 6, 7). This provides evidence supporting the use of
the log transform of PFC concentrations as the dependent variable in our models (equations 1-3).
Figure 6. Histogram of PFC concentrations (ppt) Figure 7. Histogram of PFC log concentrations (log-ppt)
The coefficient has units of log-ppt/tons for the Euclidean or River distance based LUR
models (equation 2), and units of log-ppt/(tons/deg) in the flow based LUR (equation 3). The
magnitude of the coefficient cannot therefore be directly compared across distance and flow
models, however they keep the same physical plausibility constraint that they must be positive in
the case that land applications of sludge results in increased PFC concentrations in the vicinity,
18
The decay distance parameter α is not known a priori and it will be selected for each model
by choosing the value that maximizes the R2 while being physically plausible ( >0). However
the maximum value of the decay distance parameter α that can be tested in this work is limited
by the extent of the area for which we have sludge land application data. Hence, for each model,
we will limit the maximum value of decay distance parameter α to be within the scope of the
area for which we have land application data.
The , R2 and p-value obtained with the Euclidean distance model are shown in Figure 8 as
a function of the decay distance parameter α, when α ranges from 0.1 km to 40 km. The
maximum value of 40 km was chosen because that is approximately 50% larger than the
Euclidean distance diameter of Alamance County for which we have sludge application data.
The R2 value reaches a maximum of 0.0125 when the decay distance α is equal to 40 km (the
maximum α-value allowed), while having a corresponding positive coefficient and a
significant p-value (p<0.01). However, a 40 km decay distance α exceeds the diameter of
Alamance County. Setting α at 25 km results in a poor R2
(0.003) with a p-value greater than 0.1.
Therefore, the results of Euclidean distance based LUR suggest that PFC contamination in
surface water is likely to have a decay distance greater than that which we can test with our
limited dataset. Within the 25km study region, there is an insufficient amount of evidence to
support the hypothesis that elevated PFC contamination is associated with Euclidean distance
19
Figure 8. Plots of , R2 and p-value obtained as a function the decay distance α for the
Euclidean distance based model.
The , R2 and p-value obtained with the river distance model are shown in Figure 9 as a
function of the decay distance parameter α, when α ranges from 0.1 km to 70 km. The maximum
value of 70 km was chosen to account for tortuosity (i.e. the fact that the river distance between
two points at the opposite end of Alamance County is longer when traveling along the river than
across land). The R2 value reaches a maximum of 0.028 when the decay distance α is equal to 70
km (the maximum α-value allowed here), while having a corresponding positive coefficient
and a significant p-value (p 0.01). However, a 70 km decay distance parameter α exceeds the
river-distance based diameter of Alamance County. Setting α at 40 km results in a poor R2 (0.006)
20
PFC contamination in surface water is likely to have a decay distance greater than that which we
can test with our limited dataset. Within the 40km river based distance study region, there is an
insufficient amount of evidence to support the hypothesis that elevated PFC contamination is
associated with river distance proximity to, and amounts of sludge applied on, application fields.
Figure 9. Plots of , R2 and p-value obtained as a function the decay distance α for the river
distance based model.
The , R2 and p-value obtained with the flow based model are shown in Figure 10 as a
function of the decay distance parameter α, when α ranges from 0.1 km to 80 km. The maximum
value of 80 km was chosen to account for flow connectivity (i.e. the fact that two points at the
opposite end of Alamance County have a reduced flow connectivity that acts in the same way as
21
equal to 17 km and the coefficient is positive, however the p-value indicates that this result is
very insignificant (p>0.5), or put in other words, that the positive value that we obtained is
most likely due to chance.
Figure 10. Plots of , R2 and p-value obtained as a function the decay distance α for the flow
based model.
Table 6 summarizes the performance of the three models that we tested. Both of the distance
based models have results that are statistically significant, however their decay distance
parameter α probably exceeds the scope of the area for which we have land application data. The
flow based model has results obtained for a decay distance parameter α that might be within the
22
Table 6. Values of α, , R2 and p obtained for the Euclidean, river and flow LUR models
α (km) R2 β p-value at a
Euclidean distance based
LUR
40 0.003 positive <0.01
River distance based
LUR
70 0.006 positive 0.01
Flow and river
distance based LUR
17 0.43 positive >0.5
Findings and Discussion
The main contribution of this project is the creation of a wastewater sludge application
database covering a 10-year time period consisting of 2001-2002 and 2004-2011. Since land use
application annual reports are achieved in government facilities, permission is required for
accessing these annual reports. Contacting staffs, requesting permission, and scanning reports are
the preparation steps for creating the database. A total number of 539 scanned reports were
converted to electronic PDF documents, which were named after the corresponding unique
identifiers and were well organized in folders for further access. The land use application
database contained 377 valid land use application reports with complete information, including
each field’s geographical coordinates, unique identifier, amount of application, and year of
application. According to the database data analysis, land use applications have been on the rise
in the 10-year period under study. It is very likely that the demand will keep increasing in future
23
needs to be studied carefully in the future. Another contribution is the successful implemention
of LUR models with the three approaches. The implementation provides a tool to analyze the
association between land use applications and PFC contamination based on available dataset.
However, the insignificant LUR modeling results indicate that either (1) the research
hypothesis is not true (which means that wastewater residual applications are either (1a) not a
source or (1b) not the main source of PFC contamination); or (2) the research hypothesis is true
(which means that wastewater residual applications are the main source of PFC contamination),
but limitations in the data and the models resulted in a non-statistically significant association
between proximity to wastewater residual applications and elevated PFC contamination. As a
result, addressing these limitations would need to be addressed to better test whether wastewater
residual applications are the major source of PFC contamination in the Cape Fear River Basin.
The limitations of the data identified by the results of the LUR models are described next.
These identified limitations are an important contribution of this work. Because other source of
PFC contamination have not been widely suggested in the current literature, rejecting the
research hypothesis is premature and not prudent, and therefore the recommendation of this
study is that the limitations outlined next be addressed in future works.
Limitations and Future Work
The results of both distance based LUR models (Euclidean and River) suggest that PFC
contamination in surface water has a non-statistically significant association with increased PFC
contamination for a decay distance that exceeds the area of our study domain. Considering PFCs
24
rivers. Therefore, flow dilution may be the major factor causing PFC concentrations to decrease
away from polluting sources, which explains why the decay distance parameter value α might
take a large value. Under that scenario we hypothesize that the decay distance parameter value α
for the two distance-based models was greater than what could be tested with our limited dataset.
To address these limitations, the database of wastewater treatment sludge applications should be
extended so that (a) the area for which we have sludge application data extends further upstream
of the PFC sampling domain (e.g. in Counties such as Guilford, Rockingham, and Caswell), or
(b) the time period of sludge applications should be extended back in time to account for the
legacy effect of sludge applied on land.
The results of the flow based LUR model indicates that the flow-based decay distance
parameter value α might be equal to 17km, though this result is not statistically significant. This
value of 17km cannot be directly compared to that obtained for the distance-based models
because it factors both distance and flow connectivity. Nevertheless, this value of α is within the
scope of our study domain, and therefore the non-statistical significance of our results could be
due to a lack of data within our study domain. Addressing this limitation would require obtaining
more PCF sampling data within our current study domain (rather than expanding the study
domain). Another contributing factor for the lack of statistical significance of the flow based
method might be that the flow data we used was not specific enough. Hence future works should
also improve the specificity of the flow data by using daily flows rather than cumulated upstream
length.
Another limitation of this work is that we assumed that the dry ton of sludge applied can be
used as a proxy for the mass of PFC applied on the fields. In reality, the concentration of PFC in
25
may produce sludge containing different levels of PFC. Therefore, adding a specified PFC
concentration modifier to each land use application may improve the modeling results.
A temporal refinement of the model may enhance modeling accuracy as well. Currently the
models include sludge applications that occurred within a fixed 10 year period (2001-2002,
2004-2011) regardless of the PFC sampling time. The sludge applications used as predictors for
a specific PFC sample could be refined to (a) occur over a long (multiyears) period of time
preceding the sampling date (to test legacy effects of sludge applications resulting in long term
contamination of soils), or (b) occur over a short (days) period of time preceding the sampling
date (to test short term effects of sludge applications resulting in runoff to the receiving river
26
REFERENCES
1. EPA PFC Research http://www2.epa.gov/chemical-research/perfluorinated-chemical-pfc-research
2. CDC PFC Factsheet http://www.cdc.gov/biomonitoring/PFC_FactSheet.html
3. K.Kannan, S. Corsolini, J. Falandysz, G. Fillmann, K.S. Kumar, B.G. Loganathan, M.A. Mohd, J. Olivero, N. Van Wouwe, J.H. Yang, K.M. Aldous, Perfluorooctanesulfonate and related
fluorochemicals in human blood from several countries Environ. Sci. Technol., 38 (2004), pp. 4489–4495
4. U.S. Environmental Protection Agency, Long-Chain Perfluorinated Chemicals (PFC) Action Plan,12/30/2009, http://www.epa.gov/oppt/existingchemicals/pubs/PFC_action_plan1230_09.pdf
5. Eric S. Money, Dana K. Sackett, D. Derek Aday, and Marc L. Serre*,Using River Distance and Existing Hydrography Data Can Improve the Geostatistical Estimation of Fish Tissue Mercury at Unsampled Locations, Environ. Sci. Technol., 2011, 45 (18), pp 7746–7753
6. LINDSTROM, A. B., M. STRYNAR, A. DELINSKY, AND S. F. Nakayama. Application of WWTP Biosolids and Resulting Perfluorinated Compound Contamination of Surface and Well Water in Decatur, Alabama, USA. ENVIRONMENTAL SCIENCE AND TECHNOLOGY. John Wiley & Sons, Ltd., Indianapolis, IN, 45(19):8015-8021, (2011).
7. Keil, Alexander, Steven Wing, and Amy Lowman. “Suitability of Public Records for Evaluating Health Effects of Treated Sewage Sludge in North Carolina.”North Carolina medical journal 72.2 (2011): 98–104.