Climate Action Plans: What Traits and Strategies Should Be
Employed to Produce Results?
by
Ryan Parzick
A Master’s Project submitted to the faculty of the University of North Carolina at Chapel Hill
in partial fulfillment of the requirements for the degree of Master of City and Regional Planning
in the Department of City and Regional Planning.
Chapel Hill
2012
Approved by:
Acknowledgements
I would like to thank the following people for their invaluable help on this research project:
Professor Nikhil Kaza – my master’s project advisor. His patience with me during this process was very much appreciated. Additionally, he provided guidance and ideas that helped shape this project into a legitimate research document. Without his aid, this project would still be in the idea phase.
Marianna and Jacob Parzick – my two wonderful children. There were nights they went to bed without me tucking them in so that I could stay at the library and work on this project. Their smiles and senses of humor always put a smile on my face, even when sleep was the only thing on my mind. My hope is that this research will be useful to communities so that Marianna and Jacob can live their lives without being adversely impacted by the effects of climate change. We must keep trying!
Table of Contents
Introduction ... 1
Abstract……….. ... 1
Climate Change and the Local Government ... 2
Organizations and Initiatives with Strong Influence on CAPs ... 3
Design of Study ... 4
Previous Studies’ Purposes ... 4
Methodology of this Study ... 4
Sample Selection ... 4
Plan Evaluation Process ... 5
Analysis of the Effectiveness of the Plans ... 7
Achievement of GHG Emission Reduction Goals ... 7
Implementation of Strategies ... 8
Local Government Emissions ... 9
Community Emissions ... 12
Strategies Not in Bassett and Shandas, But Applicable to GHG Emission Reduction ... 16
Table 1: Austin, TX Climate Change Mitigation Strategies ... 17
Table 2: Boston, MA Climate Change Mitigation Strategies ... 21
Table 3: Boulder, CO Climate Change Mitigation Strategies ... 28
Table 4: Seattle, WA Climate Change Mitigation Strategies ... 33
Conclusions and Recommendations ... 42
Conclusions….. ... 42
Recommendations ... 43
Bibliography ... 45
Appendices ... 54
Appendix A: Tang et al’s Definitions for the ‘AAA’ Components ... 54
Appendix B: Tang et al’s Indicators ... 55
Appendix C: Basset and Shandas Action Strategies ... 56
Appendix D: Bassett and Shandas’ Strategies Mentioned in CAPs (with Tang et al scores) ... 57
Appendix E: GHG Inventory Results for Each City Studied... 58
Introduction
Abstract
This study aims to continue previous research on climate action plans (CAPs). There have been few studies on municipal CAPs since they are a relatively new endeavor for municipal governments to undertake. Even less research has been conducted evaluating these plans on quality. This study uses three analyses by Wheeler (2008), Tang et al (2008), and Bassett & Shandas (2010) as its foundation for the quality of content of a CAP. According to Tang et al, “local climate change action plans should indicate a comprehensive awareness of climate change, make a thorough analysis of these impacts, and translate awareness and concerns into concrete action policies” (Tang et al, 2010, p. 44). This statement does not mean much if the strategies of the plan do not get implemented. This project will continue beyond the previously mentioned studies to determine if the quality of content correlates to the actual effectiveness of the plan. Effectiveness will not fully be measured by the tonnage of GHG emissions reduced, but also by the actual number of strategies in the plan that have been implemented. It has been determined that many plans have lofty strategies that are not seen to fruition when it comes time to employ them (Wheeler, 2008).
The overall goal of this study is to address the question of what strategies are the most effective in mitigating climate change. The study will determine the best practices that can be incorporated into future climate action plans, providing governments and planning departments a resource that can act as a base set of requirements that can be built off of and improved upon. Additionally, the hope is that this study can help facilitate discussion within the local governments regarding the attainable execution of strong climate change action plans.
Austin, TX; Boston, MA; Boulder, CO; and Seattle, WA are the four cities selected for this study based on a set of criteria determined by the author. This report collected data for each city from published city CAP assessments, city greenhouse gas (GHG) emission inventories, other published documents from the city (i.e. website, announcements, reports, city budgets, subsequent updated CAPs, etc.), newspaper and internet articles, blogs, industry newsletters, and any other documentation that related to each city’s efforts. The data collected for this study is meant to verify whether the strategies listed by each city in their CAPs were implemented or not.
Climate Change and the Local Government
There is scientific consensus that human activity has played a significant role in exacerbating climate change (Doran & Zimmerman, 2009). This global threat covers a multitude of effects caused by the increasing atmospheric concentrations of GHGs, including: average temperature increases and decreases, changes in precipitation patterns, and increases in the number and severity of storm events (Wheeler, 2008). These events have major impacts on the communities in which humans live. Governments are now starting to think of climate change and are trying to account for it in their planning activities. The threat of sea level rise, extreme droughts, food production/supply disruptions, and severe storms are just a few of the events that municipalities are worried about.
Much of the international community has banded together with the adaptation of the Kyoto Protocol to cut GHG emissions, while the United States has decided not to participate. Nevertheless, these effects are becoming a greater concern to the federal, state, county, and local governments. In order to mitigate the effects of climate change, these governments are attempting to reduce the GHG emissions and overall energy consumption of their citizens. The mitigation efforts are being primarily reflected in plans of counties and their local jurisdictions. “[T]he federal and state governments have diverged in their awareness and willingness to act on climate change in the U.S. The balance of environmental federalism has shifted decidedly toward lower-level government action on climate change policy. The federal government has focused on research and voluntary programs, while lower-level governments have intensified their emissions mitigation actions” (Lutsey & Sperling, 2008, p. 673).
The focus of this study is on plans at the municipal government level. The U.S. local governments have the potential to greatly aid in the international effort towards slowing the pace of climate change because of their ability to: control day-to-day operations of the municipal activities that control energy consumption and waste production; use long-term planning tools – zoning, comprehensive planning, building codes and licensing, infrastructure investments, preservation of habitats and farmland, etc.; and incentivize its citizens to adopt beneficial behaviors (Salkin, 2009; Tobin, 2009). Additionally,
… local governments are utilizing policy levers available to them to act on climate change and, in part, to help encourage or influence more widespread federal action. The April 2007 US Supreme Court (Massachussetts et al. v. US EPA et al., 2007) ruling could put to rest many of the legal challenges against subnational climate change initiatives. The numerous actions at lower levels of government can now more solidly be considered the first steps of the US toward climate change mitigation (Lutsey & Sperling, 2008, p. 673).
Cities for Climate Protection Five Milestone Process
Following a political commitment statement of the representative of their local governments, participating cities are expected to:
1.) Conduct a baseline inventory of global warming pollutants 2.) Establish a target to lower
emissions
3.) Develop a local Climate Action Plan to implement actions that reduce global warming pollution 4.) Implement the local Climate
Action Plan
5.) Measure, verify and report performance
Figure 1: (ICLEI, n.d.)
Organizations and Initiatives with Strong Influence on CAPs
There are a number of organizations and initiatives that aim to aid local governments in the task of creating and following through with CAPs. Three of the larger influencers are the Local Governments for Sustainability (ICLEI), U.S. Conference of Mayors Climate Protection Agreement (The Agreement), and the United Nations Conference on Environment and Development (UNCED) Local Action 21 initiative.
The ICLEI instituted the Cities for Climate Protection (CCP) campaign in 1993 to assist in the emissions reduction of local governments using its “five milestone process” to hold municipalities accountable. According to the ICLEI, as of 2009 there are more than 1,000 local governments worldwide, and over 600 in the U.S., that are incorporating climate change mitigation into their decision-making processes.
The CCP campaign has developed the Harmonized Emissions Analysis Tool (HEAT) online software that aids in local GHG and air pollution emission reduction planning. The software does the following:
• Build an emissions inventory based on local energy use, transportation demand, and waste practices
• Help a user/city build a simple emissions forecast
• Set a target/goal for reducing emissions (e.g., reduce GHG emissions by 10%)
• Quantify emission reduction activities and their co-benefits
• Develop, report, and track progress made in meeting that target
The U.S. Conference of Mayors Climate Protection Agreement was created in 2005 by the challenge of Seattle Mayor Greg Nickels the day the Kyoto Protocol went into law for the nations that had ratified it. The Agreement is meant to advance the goals of the Kyoto Protocol by committing signees of The Agreement to meet or beat the targets set forth in the international agreement. As of March 2, 2012, there are 1,055 U.S. mayors who have signed The Agreement.
The CCP, The Agreement, and Local Action 21 do not have the ability to bind a municipality to their terms, but are motivating factors. “Metropolitan regions do not only compete with each other, cities may also co-operate with their peers, at home and abroad, and may serve as a focal point for the development of best practices that can spread within and beyond such regions” (Kern & Alber, 2008, p. 172).
Design of Study
Previous Studies’ Purposes
The purpose of Wheeler’s study was to analyze climate change plans that he deemed “first generation.” He assessed the goals set, the strategies implemented and left out, the politics surrounding the enactment of the strategies, and the strengths and weaknesses of the of state and local climate change mitigation plans he studied (Wheeler, 2008). Tang et al published a study, following up on Wheeler’s work, applying an empirical model to evaluate local plan quality. This study scored aspects of climate action plans based on the ‘AAA’ components1 deemed as critical to a plan’s success: Awareness, Analysis, and Action (UKCIP, 2003). Tang et al’s study also determined which strategies received the greatest and least attention by municipalities. Bassett and Shandas studied: the purpose of why municipalities create CAPs, the main drivers and obstacles of the implementation of the plans, how the plans are structured, the most frequent actions that appear in CAPs, and how communities determine which actions to adopt (Bassett & Shandas, 2010).
Methodology of this Study
Sample Selection
Austin, TX; Boston, MA; Boulder, CO; and Seattle, WA are the four cities selected for this study. The criteria used in this research for CAP selection was based on the following factors, in order of preference:
• Availability of Plan: As Bassett and Shandas noted, there isn’t a centralized source that lists all local government that have completed a CAP. Therefore, the methodology employed for this study was to use the cities researched in the Wheeler, Tang et al, and Bassett and Shandas articles as a starting point. These were all known cities that had already produced a CAP. All of the plans studied in this investigation were included in Wheeler’s and Tang et al’s studies. The cities ranged from strong plans to very poor plans according to Tang et al’s study (Austin had the lowest overall score while Boulder earned the 8th highest score). Boulder was the only city selected for this study not researched by Bassett and Shandas.
• Enactment of Plan: The end of 2007 was the cutoff time used by this study for the latest a CAP could be adopted and enacted. This deadline provides ample time for the plans to have taken root and show progress, or a lack thereof. The negative aspect of this criterion is that there are few CAPs to choose from that were adopted prior to 2008.
• Availability of Follow-Up Data: Since the purpose of this study is to examine CAP strategies and action items that are being carried out, the obtainability of follow-up reporting was imperative in the selection process. There are a number of cities that have enacted CAPs, but have not followed up to show advancement. Progress reports and GHG inventories beyond two years out were required in this study to show sufficient progression.
• CAP Commitment: The four cities selected have all signed on to The Agreement and to the Agenda 21 protocol. All of the cities, with the exception of Boulder, are a part of the CCP campaign. This shows a level of commitment to climate mitigation and not just political posturing. Additionally, the cities selected all have strong political will stemming from the top and/or the grassroots of the municipal government. Seattle’s former Mayor Nickels, who presided during the majority of this study, issued the initial challenge for mayors to sign the U.S. Mayors Climate Protection Agreement. Boston’s Mayor Menino has a strong record on climate change mitigation. Both Austin and Boulder have very active communities that are progressive and concerned about the environment.
The cities selected for this study all fit the criteria listed above. Because this sample size is small, the findings of this report may not necessarily be representative all plans in existence. The hope is that in future years, when more cities have CAPs that are mature enough to be analyzed thoroughly, this study will provide the starting point for further research on the topic.
Plan Evaluation Process
Implemented Strategies/Action Items Data Collection
This study recorded each strategy listed in the original climate action plans for each city. All of the selected CAPs had at least one follow-up progress report that indicated the status of the goals provided in the plan. Austin, Boulder, and Seattle have annual progress reports, whereas Boston has an updated climate action plan that includes item progress from the 2007 CAP.
Progress reports and GHG inventories were collected for each analyzed city in conjunction with news articles and blogs, city correspondence, municipal budgets, other city documents relating to initiatives presented in the CAPs, industry newsletters, and any other source that provided information on the most recent state of the strategies presented. This was done to verify whether each city followed through on the objectives presented in their CAPs. For any specific numerical goals, the progress towards these goals was catalogued. It has been noted if the goals have been completed by the municipality, if there is still progress to be made, or if the strategy has yet to be implemented.
Additionally, Tang et al’s scoring system was used for the selected cities. This score was calculated by applying a score on a 0 – 2 scale to indicators2 in each of the components, where ‘0’ meant the indicator was not mentioned in the plan, ‘1’ meant the indicator was not considered comprehensively, and ‘2’ meant the indicator was fully considered. The scores were summed and standardized for each component. The components’ scores were then summed to give the total plan quality score. This was done to determine whether Tang et al’s plan quality scoring system correlated to the performance of CAPs.
Analysis Procedure
Much of the evaluation of the plans has already been conducted in the Tang et al and the Bassett and Shandas research, so this study will not be redundant. The Bassett and Shandas research provided action strategies3 that are considered to be general themes used by CAPs as a “best practice” of climate action planning. The public policies identified by their study were viewed by them as likely candidates to be adopted by the most committed municipalities. The actions were split into those that the local government could take to reduce GHG emissions they produced and those that the city residents could take to reduce their own GHG emissions. In the table found in Appendix C, a number was assigned to each of these strategies. This study took the tactics adopted by each city and categorized them with the Bassett and Shandas strategy numbers4. The status of each strategy was researched, recorded, and inserted into the table. If the status was left blank, updated information for the strategy could not be found.
A summary table6 was created to show the Bassett and Shandas strategy numbers and which cities implemented tactics that were categorically congruent to these numbers. The total sum of strategies utilized by each city was tallied for comparison. This summary table also includes Tang et al’s calculated score for each city. The purpose of doing this is to determine which of the strategies presented by Bassett and Shandas lend themselves to actually being implemented while also checking to see if Tang et al’s scoring system is an indicator of whether a CAP is able to proceed in an effective manner in its efforts to mitigate GHG emissions.
The quantified GHG emissions by the municipalities (both government and community emissions, when available) were used in this study as another barometer of climate change mitigation success. The reasoning behind this selection is that analysis methodologies for GHG emissions are relatively standardized (Boswell
et al, 2010) and because of the overall availability of the data from municipalities. The inventories for each city were aggregated and placed into a single table7. Each city’s population for the years an inventory was taken was included to determine a per capita GHG inventory. During the analysis of the GHG emission data, the communities’ emissions were assessed on a per capita basis. This is meant to standardize the data between cities by accounting for differing population change and total quantities. The municipalities were evaluated on pure GHG tonnage since the immediate change in the size of government is not necessarily directly correlated to the immediate change in population. The total emissions of a community were calculated by adding the community emissions to the municipal emissions. The analysis of the total emissions is done on a per capita basis since the volume of total emissions is heavily influenced by the communities’ outputs.
3 See Appendix C
Analysis of the Effectiveness of the Plans
Achievement of GHG Emission Reduction Goals
The standard methodology of municipalities to judge whether their CAPs are performing adequately is to look at the GHG emission inventories and compare the quantities to the goals presented in the plan. This is a tangible technique since it is a basic comparison between sets of numbers. Either the values are on target or they are not. As noted earlier in the report, this is one way to determine whether or not a CAP is effective, but not the only way. The next section will address the actual implementation of the strategies, but for now the focus will be on the GHG emissions.
In general, each of the cities showed a trend of decreased GHG emissions from the first year of the plan’s implementation to the final year of data collected. Some of the decreases were on pace to match the city’s long-term goals of GHG emission reduction, while others fell well short of a pace that would allow achievement of goals.
The Austin plan was extremely short and vague on strategies used to achieve the city’s goals. Their CAP was essentially a nicely formatted version of the passed city resolution to create a climate action plan. The original plan’s brevity is the primary reason the Tang et al score for the CAP is so low. This vagueness could be the reason why the follow-up progress reports were very detailed and expanded upon the original goals with precise strategies. Both Austin’s community and municipal emissions have decreased since 2007. Since Austin is the only city studied that did not set a specific GHG emission target, there is not a benchmark goal to determine if the city is on target to meet its emissions goals. The unique thing about Austin’s plan is that instead of using GHG emissions as standards for success, the sole quantifiable targets are in energy production and consumption8. Although the plan is poorly rated by Tang et al and has the least number of strategies fulfilled from the Bassett and Shandas study, there was an 18.22% reduction in GHG emissions from the performance of the municipality from 2007 to 2010. Austin also had the largest decrease (-10.20%) in the in the total GHG emissions per capita over the time from plan implementation to the last year of data collected9. In 2010, the City of Austin adopted a CO2 reduction goal of 20% below 2005 levels by 2020 (Austin Energy, 2010).
The City of Boulder’s effectiveness in GHG emission reductions, on the other hand, was just the opposite. Tang et al scored Boulder very high in their study and the city has 22 out of 29 strategies fulfilled from the Bassett and Shandas study, but the city had the lowest decrease in total GHG emissions when measuring from the year the plan was implemented to 2010. The Boulder Climate Action Plan also had a goal of being 7% below the 1990 levels of GHG emissions by 2012, but the city has actually increased its production of GHGs through 2010 by 13.21% on a per capita basis. Part of Boulder’s calculated high mark in Tang et al’s study was the inclusion of funding sources for the Climate Action Plan’s strategies. Out of all of the cities
8 Austin Energy is a municipality owned energy provider. The City of Austin has been able to reduce GHG emissions from
energy production that other cities without this relationship are able to do.
studied by Wheeler, Boulder was the only plan to incorporate cost estimates and sources of funding in its plan. In 2007, the citizens of Boulder passed an initiative to create the Climate Action Plan Tax, marking the first time in the nation that a municipal government imposed an energy tax on its residents to directly combat climate change. The Climate Action Plan Tax fully funds the activities associated with the CAP by providing an estimated $1 million per year in tax revenue. With a funding source as self-sustaining as the Climate Action Plan Tax, it would be assumed that the CAP would be more effective in implementing GHG reduction strategies. As it will be noted in the following section, there were some strategies that were put in place that later needed to be rescinded and replaced with other programs due to the lack of benefit towards achieving the CAP goals.
The City of Boston set a standard of reducing the emissions of GHGs 80% of 1990 levels by 2050. Additionally, the mayor of Boston signed the U.S. Mayors Climate Protection Agreement, which sets the goal of being 7% below the 1990 levels of GHG emissions by 2012. As of the 2010 emissions inventories for Boston, it is almost at this goal. The calculated 1990 total GHG emissions, from both the community and the municipality, was roughly 8.6 MMTCO2e. In 2010, the calculated combined total of GHGs was roughly 8,050,000 tons of CO2e. This is about 6.4% below 1990 levels. Considering that in the twenty years between 1990 and 2010, Boston’s population increased by over 43,000 people, this is a solid start to the GHG reduction goals set forth in the CAP. It remains to be seen if the current trajectory of GHG reductions will allow Boston to meet its 2050 goal, but without incremental goals between the present and 2050, it may be very hard for the goal to be met (Wheeler, 2008).
Seattle was the first city to sign the U.S. Mayors Climate Protection Agreement, so it also is striving to reach levels of GHG emissions 7% below the 1990 levels by 2012. In 2008, the GHG emissions for just the community had already met the goals set forth in the CAP. Without having published the 2011 community GHG inventory report (Seattle conducts an inventory every three years for the community GHG emissions), it has yet to be seen if the city has maintained or exceeded this goal. The City of Seattle’s government is a shining example of how a municipality can reduce GHG emissions. It had reduced its GHG production by 49% in the three years between the CAP’s adoption in 2006 and 2008. Overall, the City has reduced its GHG production a staggering 77.45% between 1990 and 2010. The community increased its overall GHG emissions between 2005 and 2008, but decreased the per capita production by 6.44% over the same time period. This city was in the bottom half of Tang et al’s scoring matrix, but had strategies in 24 of the 29 strategies provided by Bassett and Shandas.
Implementation of Strategies
Please note that the cities included in this study have a strong record of considering the environment when making decisions. This allows many of the initiatives set forth to take place, even when budgets are tight. Other cities that are not included in this study may have less political will towards implementing strategies that may pull money away from other projects that are politically more popular.
Local Government Emissions
Transportation
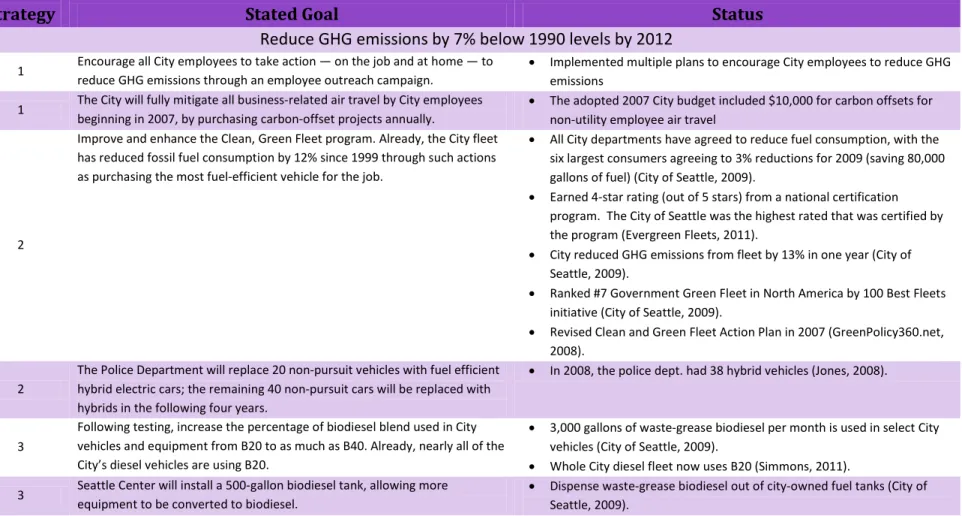
Bassett and Shandas have three strategies dealing with transportation for local governments to employ that reduce emissions. Their study noted that employee commuting, city fleet fuel efficiency, and city fleet low carbon fuel usage were the most commonly used approaches by cities examined in their report. Only Boulder and Seattle have strategies that incorporate municipal employee commuting. Providing transit passes for free, or at a heavy discount, is a way to encourage taking more cars off of the road and promote public transit. Boulder employs this tactic for its public employees and has determined that for each person that holds a transit pass, roughly 1.19 million tons of CO2e are saved each year when compared to a person who does not own a transit pass (City of Boulder, 2011). The City of Seattle uses a strategy that allows them to purchase carbon offsets for all non-utility employee air travel. For every 10,000 miles traveled on a commercial airplane, 33% more CO2e is produced than a one person car rated at 20 mpg traveling the same distance would generate (Drake R. , 2009). Due to the format of the City’s budget where only the departments’ budgets are listed, but not specific line items for the departments, it is unknown if the program is still in effect. Overall, municipal employee commuting does not have many strategies associated with it in this study. That corresponds with the percent of plans that incorporated Strategy 1 in the Bassett and Shandas study.
All four cities10 studied had some type of strategy in their CAPs addressing the fuel efficiency and/or the lowering of carbon in the fuel of the cities’ fleets. Austin set a goal to have its entire fleet of vehicles to be carbon-neutral by 2020 and, as of early 2011, has 55% of its fleet there (Green Fleet Magazine, 2011). This puts the city on pace to achieve its goal. Boston and Seattle have started implementing their goals of making new purchases for their fleets be alternative fuel vehicles or the most efficient vehicles available.11 The purchase and use of alternative fueled vehicles is highly visible to the public, which is a strategy many cities that have a CAP tend to adopt in order for the public to see and endorse (Bassett & Shandas, 2010). Not only does is elicit public support and reduce GHG emissions, this strategy benefits municipalities financially with savings on fuel. There are also some more subtle examples of reducing fleet emissions. Boston is employing a relatively novel idea of incorporating car sharing into its municipal fleet. From a GHG emission perspective, the idea is to increase the fuel efficiency of the city’s fleet without having to make large investments in the purchase of these vehicles (Moore, 2012). Additionally, Boston has retro-fitted 500
10 Boulder shows up in categories 2, 3, and 10 – 16 with one strategy. This strategy states that it will “incorporate GHG
emissions reduction strategies into the Transportation Master Plan.” It does not elaborate on what the strategies are, nor do any strategies show up in the 2008 Transportation Master Plan. Only categories 2 and 3 have a mention in the plan with alternative fuel usage and fuel efficiency on the existing fleet. There is indication that future plans for expansion of these actions will be conducted.
buses that have reduced the emissions of these vehicles by 90%. Seattle had a goal of trying to incorporate biodiesel into other city operations, but it is unknown whether this initiative ever started.
Solid Waste and Recycling
Only Seattle included this category in their CAP. Seattle created a team within their City Purchasing group that focuses solely on environmentally friendly products for several city departments. This category may be lightly represented in this study due to the lack of knowledge by consumers of green products in the marketplace and how the packaging of goods is handled by manufacturers. A resource for local governments to overcome this barrier is a guide produced by Alameda County for purchasing products that are environmentally friendly (StopWaste.org, 2010).
Energy Efficiency
Bassett and Shandas determined that there were three best practices for municipalities to achieve better energy efficiency: through existing building, new buildings, and streetlights and amenities.
Boston had a focus on affordable housing efficiency standards for its existing buildings. The Boston Redevelopment Authority is in charge of the City’s affordable housing program, so the units are considered publicly funded facilities. The City has already performed the implementation of their energy efficiency techniques. Additionally, the City requires all renovation of City facilities, including affordable housing, to meet LEED Silver criteria. Boston requires all new City facilities, or any building or land receiving City funding, to meet LEED Silver criteria. The City also has strategies of performing energy audits with the appropriate follow-up actions to accommodate the recommendations. These have already been completed or are in the process of doing so. After converting all traffic lights to LEDs, Boston is piloting a program that will test LEDs in the streetlights and will also be reducing the gas needed in gas streetlights. These strategies will help Boston attain its goal of a 40% reduction in energy usage of streetlights (City of Boston, 2011). The City received funding from the local utility to help pay for this program.
Before the adoption of their CAP, Boulder already had a provision in its building codes that required LEED Silver standards to be met for all new City facilities. Therefore, they did not have this as a strategy. Boulder also launched a campaign to educate and motivate city employees to reduce their energy consumption at the office when they are not there. This is an easy and inexpensive way to lower GHG emissions by reducing energy use of computers and other office equipment that is not being used for hours on end.
Austin’s energy savings strategy of decreasing demand 700 MW is very ambitious and was actually revised to save 800 MW of power12. Unfortunately, it does not have much detail associated with it on how it will be accomplished. As of 2009, the City claims that 7.5% of the original goal has been met in the three years since the plans adoption, which would put it on pace to finish well short of either of their goals.
Like Boston, Seattle has already (or is in the process of) implemented strategies of performing energy audits with follow-up actions. Seattle also came up with a strategy to hire an energy specialist and focus more
resources towards energy efficiency. It is unknown by this study whether the City of Seattle actually hired for the position and what steps have been subsequently been taken to increase resources towards improving energy efficiency in its existing buildings. Seattle doesn’t have a strategy in their CAP for new municipal buildings or major renovations, but it has been a requirement since 2000 that all new municipal buildings and major renovations over 5,000 ft2 must meet LEED Silver standards. In 2010, it was announced that this standard has been increased to LEED Gold. The City has also taken on some strategies that reduce gasoline and energy consumption in their Parks Department. Even though the savings in usage were nothing major, they were still improvements. Additionally, Seattle changed requirements of building materials that reduce energy needed during production of the material. These strategies were simple to implement and not too costly.
Renewable Energy
Bassett and Shandas grouped strategies involving municipal energy production and purchasing together in this category. Austin and Seattle hold an advantage in this category since both cities run their own utilities and have more control over the energy that is produced, though all four cities focused on renewable energy as a major contributor in its GHG reduction strategies.13 Austin has an aggressive strategy of having all new energy producing plants be carbon neutral, have all City facilities be run with renewable energy by 2012, and have 30% of all energy needs be met with renewable sources by 2020. These strategies have either been attained or are close to being fulfilled. Wind and solar energy generation are the predominant renewable energy sources focused on by the cities in this category, but have led to mixed results in their effectiveness of being employed. Boston had a setback in wind generation due to political opposition from a neighboring town. Boston also observed that the barriers to solar installation in the city are related to the energy grid, which is not an easy fix. Some successes can be found, though. All four cities have been able to create some energy from renewable sources and expect to continue to grow their programs.
Both Boston and Boulder had strategies for renewable energy purchasing for which the statuses of are unknown. As of 2011, Austin has 100% of its City facilities powered by a green-pricing energy program. The City has also signed contracts that bring the utility’s energy portfolio up to 30% of energy needs by the end of 2012. This is a major accomplishment for the relatively short amount of time the City had between the implementation of the CAP and 2011. Seattle has also achieved a milestone in its power generation. It has achieved zero net GHG emissions through the purchase of carbon offsets, generation, and reducing demand.14 Again, this is impressive given the short amount of time to attain this strategy’s goal. As noted previously, both Seattle and Austin have municipal owned utilities and can be more aggressive with their actions.
13 Boulder is still in the process of municipalizing its energy production after a ballot initiative was passed in November 2011.
This will have a major impact on future strategies for renewable energy.
14 The City of Seattle does not count its carbon offsets purchased through Seattle City Light in its inventory. Therefore,
Community Emissions
Transportation
The Bassett and Shandas study determined six strategies that would reduce GHG emissions in the category of transportation. They are as follows: reduce carbon content of fuels, increase fuel efficiency, reduce vehicle miles traveled with infrastructure for bicycling and pedestrians, transit service, alternative transportation, and travel demand management policies.
Seattle and Boulder are the only cities in this study to have strategies that address the reduction of carbon content in fuels. Seattle focused its attention on private fleets and ships by reaching deals to help these entities reduce their GHG emissions. Boulder eschewed deal-making and intends to provide the infrastructure to allow citizens easier access to alternative fueling stations. It is assumed the intent is to make fueling easier, therefore people will be enticed to purchase alternative fueled vehicles. Seattle also wanted to track biofuel sales, but it is unknown whether this has actually been able to be brought to fruition. This strategy would allow the City to understand the vehicle demographics of its citizens and be able to proactively react to the fueling needs of these vehicles.
Both Boston and Seattle concentrated their fuel efficiency efforts on anti-idling policies and taxi emission improvements. Boston had strategies for reducing idling with enforcement of laws and education, but this study could not verify if the strategy was carried out. Seattle, on the other hand, had a very basic strategy of installing signs urging visitors at many of its parks to reduce idling. This was implemented at a relatively low cost. Both cities had success with their taxi strategies, though. Boston originally used incentives to push the city’s taxi fleets towards more fuel-efficient vehicles. The City then passed a requirement for better fuel efficiency standards, which was later ruled invalid. Seattle negotiated a deal with the city taxis by allowing more cabs to operate within the city, but all taxis needed to adhere to 10% more stringent fuel efficiency standards. Seattle also started a program that would help traffic flow more efficiently for both the general public and for freight movement, which can be a rather intricate undertaking.
Boston and Seattle led the way in the strategy dealing with bicycle infrastructure. Both cities expanded their networks for bike trails/lanes and increased bicycle parking capacity. Seattle created a Bicycle Master Plan, which will further improve bicycling conditions by providing specific strategies. Seattle also invested in a bicycle transportation center to help facilitate citizens’ desires to bike in the city. Boston helps make biking in the city easier by mapping initiatives that aid bicyclists in finding their way around the metropolitan area. All of these initiatives are aimed at reducing cars on the street. Without the proper infrastructure in place for bicycling, residents of a city are less likely to use their bikes (Handy et al, 2010).
pedestrian facilities, fewer people walk and those who do are in far more danger of pedestrian injuries and fatalities” (Otak, Inc., 2003, p. 12).
Seattle invested heavily in improving its transit service and has seen great rewards. According to the U.S. Census, 21% of Seattle workers took transit to and from work from 2006 to 2010. This is a larger number than Portland, which is often credited as being a model city for transit (Williams-Derry, 2012). Part of this high ridership may be due to the high price of gas that started in the middle of this time period, as well as the economic crisis. Having the infrastructure in place, though, helps facilitate the ability for people to actually use transit, though.
Alternative transportation was not addressed in detail by any of the cities studied in this report. This could be due to a possible belief by the governments that the private sector will determine what the viable options are for alternative transportation, if any. Also, there could have been a sense that what was currently being offered and what was already proposed in the CAP would be sufficient to meet the cities’ goals.
Seattle considered the idea of introducing congestion pricing as a travel demand management tool to mitigate GHG emissions, going as far as conducting a study of such a program. Even though the study showed positive benefits to having a congestion pricing system, nothing was ever implemented. There are public policy issues that need to be addressed before anything could be employed (Pryne, 2008). Seattle did implement a commercial parking tax that was raised on an annual basis. The tax is imposed on commercial parking operators based on their receipts. It has been argued that this method of taxing parking is not very effective and may actually encourage more trips to the suburbs and/or increase free parking (Litman et al, 2010). Boston also uses parking as a deterrent for driving in the city. Boston has had a parking freeze in specific locations of the city since the 1970s, where a maximum number of spaces are available in the whole geographic area. More spaces are not allowed to be created, thus producing a shortage of parking, which is an inconvenience for drivers. Also, since the CAP was adopted, the city raised parking rates and increased operability of the existing meters to further deter drivers.
Solid Waste and Recycling
Both Boston and Seattle made a concerted effort to increase recycling in their cities. They employed a number of methods to do this (as listed in Table 2 and Table 4) and seem to have been successful. In general, recycling is a strategy that is familiar to many U.S. citizens and should not be hard to implement and encourage. Convenience (as Boston’s plan noted) encourages more recycling, so both cities had strategies to make the process easier.
Energy Efficiency
The Bassett and Shandas study differentiated between residential and commercial/industrial buildings and new and existing buildings.
of energy history upon sale of residence, and technical assistance and incentives from the City. The energy audits and efficiency upgrades are relatively inexpensive and easy to perform. In some of the cities, they are subsidized by the local government, especially for those with lower income. Boulder’s Residential Energy Audit Program (REAP) had to be discontinued after three years due to its lack of effectiveness. The idea was that energy audits would be conducted for residents and businesses and the recommendations made by the auditor would be completed by the owner of the property. The upfront costs of carrying out the recommendations and the process of determining the next steps to install the suggestions end up turning people off. Only five percent of the recipients of the audits actually applied the recommendations (McNatt, 2012). Austin’s mandate that residential units provide an energy efficiency audit upon the sale of the property is a method that may entice current homeowners to upgrade their home’s energy efficiency in order to help them sell it. Seattle has subsequently followed suit.
Boulder’s affordable housing energy efficiency policies are a stark contrast to Boston’s. Boulder’s affordable housing is privately held, so it does not fit into Strategies 5 and 6 like Boston’s did. The city has chosen to provide rebates for upgrading with energy efficiency measures instead of actual building code changes for affordable housing. The SmartRegs program (energy efficiency standards for existing rental housing units) in Boulder was controversial when it was originally presented for passage due to perceptions of rental rate increases stemming from the implementation of the standards, so there was not much public support behind the plan. It is assumed in this study that the affordable housing component was exempted from the eventual passage of the ordinance due to these concerns from the property owners, even though there would be savings to the residents in energy consumption.
Boulder’s loan program15 for energy efficiency and renewable energy upgrades is an innovative idea that could entice business owners and homeowners to improve their buildings without much upfront capital, which can be a big hurdle. The program was suspended in 2010 after Fannie Mae and Freddie Mac changed their policies (McNatt, 2012).
All four cities have improving energy efficiency of new residential buildings included in their CAPs. This shows the importance of energy efficient homes in reducing GHG emissions. For Boulder, residential units produce 17% of its GHG emissions from energy usage. Austin’s successful Green Building program has been in place since 1991, but has been updated since then to reflect new technologies and increase the stringency of the codes. The program has different requirements for multiple building types in different zones to meet rating requirements in Austin’s own rating system. To encourage affordable housing, the program gives points to a development that has affordable housing so that it can achieve the green rating while also making affordable housing more energy efficient. All of the other cities have increased their standards for residential building, as well. Boston has gone as far as requiring private developments over 50,000 ft2 to be LEED certifiable.16
All four cities also include strategies that address existing and new commercial/industrial buildings. Just as with residential, commercial and industrial buildings constitute a large percentage of a city’s GHG emissions.
In Boulder, the energy usage from these entities accounts for 57% of the city’s GHG emissions. If these types of buildings can be made more energy efficient, then a significant portion of GHGs can be reduced. Just as with residential buildings, Austin requires commercial buildings to perform an energy audit and produce it to the potential buyers when put up for sale. Boulder provides aid to businesses to become more efficient in their office buildings, which is cheap with potential for high reward and low financial risk for the City. Boulder had a number of strategies for this category that involved education, but it is unknown whether they were launched.
Renewable Energy
Renewable energy has two strategies associated with it in the Bassett and Shandas study, buying and using renewable energy. Carbon offsets were the primary tool used to address the purchasing of renewable energy. Both Austin and Boulder had strategies which made purchasing alternative energy through offsets easier for the residents of their respective cities. This strategy is a less capital intensive way for residents and businesses to purchase alternative energy, as opposed to the installation of their own energy suppliers that generally cost a lot of money.
Boston and Boulder applied strategies that focused on breaking physical barriers towards installing renewable energy on site and monetary barriers for residents and businesses to be able to afford the installation of these products. Renewable energy on small scale projects may not replace the energy the development needs, but it can supplement it and make a difference in the GHGs emitted.
Forestry
All cities but Austin in this study have specific strategies that call for more trees in the downtown area. Urban forestry is a category that is visually appealing to citizens and provides benefits beyond invisible GHG recapture. Politically, it is easy to justify spending money on projects for trees since the public gets immediate, aesthetic, and tangible benefits.
Land Use Planning
Bassett and Shandas identify two strategies of land use planning in their best practices: compact development and zoning ordinances that reduce automobile usage. Only Seattle has an explicit strategy for increasing compact development. This can be an arduous process since it could potentially require a city to change its zoning ordinances, which is often a lengthy process. In the case of Seattle, the zoning ordinance had already been changed by adding a new zone that creates density. The CAP strategy calls for an increase in the promotion of this zone to developers.
Education
Education is a cheap and relatively easy way of reducing GHG emissions. The three cities studied incorporating education into their CAPs, didn’t just have one or two programs, but rather multiple strategies aimed at different segments of the population. Some of these strategies could not, for the purposes of this study, be tracked to see if they were ever implemented. Many were initialized, though. The focus of these strategies covered transportation, waste and recycling, energy efficiency, renewable energy, and behavior change.
None of the cities in this study had an education component devoted to solid waste and recycling. This could be because recycling programs in many U.S. cities have been around since the 1990s. People may feel that they don’t need to learn anything more than what they already know.
Strategies Not in Bassett and Shandas, But Applicable to GHG Emission Reduction
Some of the cities studied developed recognition for individuals, businesses, and organizations that reach a particular level of GHG emissions. This is an incentive that could add a level of community pride to emission reduction efforts. Recognition is a relatively inexpensive strategy which can help keep the public more involved in the emission reduction process, instead of being bystanders of a government program.
Boston created a competition for members of the community to win grant money to implement projects that encourage reducing GHG emissions from motor vehicles. Since there would be multiple submissions, it is assumed by this study that not only the winning proposal would benefit the city. Competition can drive innovation and having the public involved at the same time, is a combination with high potential for quality results.
Table 1: Austin, TX Climate Change Mitigation Strategies
Austin, TX
Basset
and
Shandas
Strategy
Stated Goal
Status
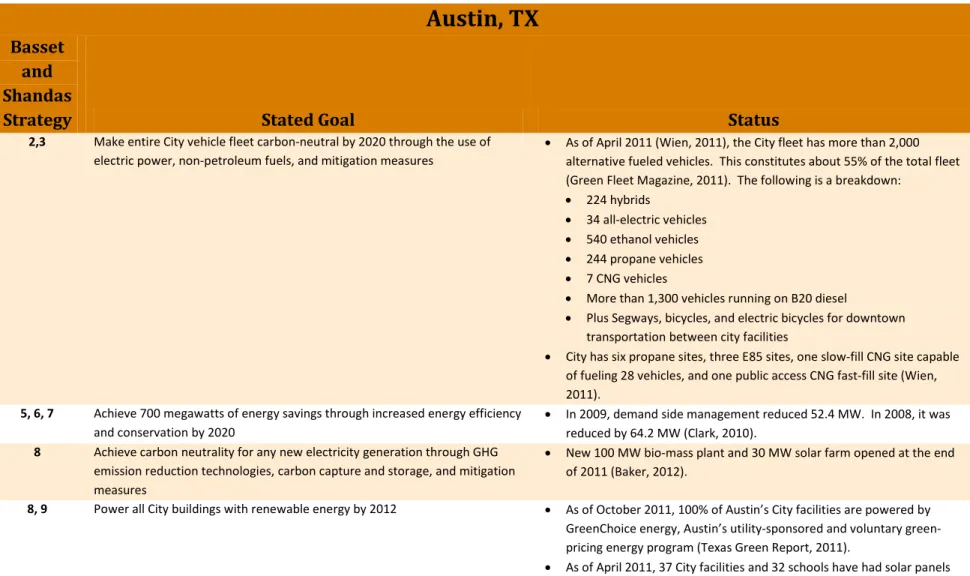
2,3 Make entire City vehicle fleet carbon-neutral by 2020 through the use of electric power, non-petroleum fuels, and mitigation measures
• As of April 2011 (Wien, 2011), the City fleet has more than 2,000 alternative fueled vehicles. This constitutes about 55% of the total fleet (Green Fleet Magazine, 2011). The following is a breakdown:
• 224 hybrids
• 34 all-electric vehicles
• 540 ethanol vehicles
• 244 propane vehicles
• 7 CNG vehicles
• More than 1,300 vehicles running on B20 diesel
• Plus Segways, bicycles, and electric bicycles for downtown transportation between city facilities
• City has six propane sites, three E85 sites, one slow-fill CNG site capable of fueling 28 vehicles, and one public access CNG fast-fill site (Wien, 2011).
5, 6, 7 Achieve 700 megawatts of energy savings through increased energy efficiency and conservation by 2020
• In 2009, demand side management reduced 52.4 MW. In 2008, it was reduced by 64.2 MW (Clark, 2010).
8 Achieve carbon neutrality for any new electricity generation through GHG emission reduction technologies, carbon capture and storage, and mitigation measures
• New 100 MW bio-mass plant and 30 MW solar farm opened at the end of 2011 (Baker, 2012).
8, 9 Power all City buildings with renewable energy by 2012 • As of October 2011, 100% of Austin’s City facilities are powered by GreenChoice energy, Austin’s utility-sponsored and voluntary green-pricing energy program (Texas Green Report, 2011).
Austin, TX
Basset
and
Shandas
Strategy
Stated Goal
Status
8, 9 Meet 30% of all energy needs with renewable sources, including 100 megawatts of solar power, by 2020
• As of 2011, Austin Energy has contracts that will bring the utility’s renewable portfolio to about 30% of energy needs by the end of 2012 (Longoria, 2011). These contracts include energy from wind turbine farms, a 100 MW bio-mass plant, and a 30 MW solar farm
18, 20 Require disclosure of historic energy use and cost-effective energy efficiency improvements upon the sale of all buildings
• City ordinance passed in November 2008 requiring residential units to provide an energy efficiency audit to potential buyers when selling property. Commercial properties must have an audit conducted by a prescribed date depending on the size of the building and must make audit available once property goes on sale (Austin Energy, 2011).
19 Update building codes to make all new single-family homes capable of meeting 100% of their energy needs with on-site generation of renewable energy by 2015
• The first phase of the Zero Energy Capable Homes initiative was the adoption of the 2006 International Energy Conservation Code (IECC) with local amendments as City of Austin Energy Code. The 2006 IECC became effective on January 1, 2008 (City of Austin, 2011).
• The second phase was the adoption and implementation of the 2009 IECC with local amendments as the Austin Energy Code in 2010 (City of Austin, 2011).
Austin, TX
Basset
and
Shandas
Strategy
Stated Goal
Status
19, 21 Enhance technical assistance, standards, and incentives for Austin Energy’s Green Building program
• Austin Energy Green Building (AEGB) prepared the Mandatory Green Building Zones Report and Recommendations. A compilation of all the programs, initiatives and negotiations that have resulted in a green building mandate being placed on a building project in Austin. Included in the report is an analysis of the various mandates’ successes and weaknesses (City of Austin, 2011).
• AEGB staff working with Energy Efficiency Section to develop new commercial construction incentives based on energy modeling of the entire building through the design phase rather than based on component efficiency (City of Austin, 2011).
21 Enhance building codes to increase energy efficiency in all other new buildings by 75% by 2015
• Implementation of the 2006 and 2009 IECC with local amendments as the City of Austin Energy Code addresses this strategy.
22 Develop options for citizens, businesses, and organizations to reduce their carbon footprint through local GHG emission reduction projects
• In 2011, the City created Carbon Offset Challenge Grants which are designed to highlight local projects doing their part to reduce GHG emissions. $40,000 will be divided among projects, and up to $10,000 can be awarded to one project. A City of Austin team will review proposals for the grants, selecting projects that demonstrate a clear methodology for delivering verifiable local carbon reductions. Austin Energy will then give residents and visitors the opportunity to purchase offsets that result using the Austin Climate Protection Program Carbon Calculator (City of Austin, 2011).
22, 27 Promote carbon neutrality among visitors by providing mechanisms and incentives for reducing the carbon footprint of airport travelers, conventions, trade shows, and festivals
• Kiosks in place at Convention Center and Airport. Carbon Offset Challenge Grants available for visitors to purchase offsets through (City of Austin, 2011).
27 Create a City employee climate protection education program including (1) information and incentives to help employees reduce their carbon footprint and (2) training on how to educate other community members on ways to reduce their carbon footprint
• 1,162 City employees were trained in 2009 using Carbon Footprint Calculator (City of Austin, 2011).
Austin, TX
Basset
and
Shandas
Strategy
Stated Goal
Status
27 Create an Austin-specific online carbon calculator for citizens, businesses, and organizations to calculate their GHG emissions and provide customized assessments for more complex organizations and entities
• Unveiled in January of 2010 at the Austin Climate Protection Conference and Expo (City of Austin, 2011).
28 Cooperate with other local and regional entities to provide technical and investigational assistance and to coordinate region-wide GHG reduction strategies.
• In 2009, trained a total of 3,648 students, City Employees, and members of the community through public outreach programs (City of Austin, 2011).
Establish a City employee Climate Action Team to (1) inventory GHG emissions from all municipal operations and (2) develop comprehensive emission reduction plans
• Completed a 2007 and 2010 GHG inventory for the entire community.
• Completed municipal GHG inventories for the City’s facilities, fleets, and operations in the years 2007 – 2010.
• As of 2010, there were 23 departmental and 5 building climate protection plans adopted and in implementation phase (City of Austin, 2011).
Establish a carbon dioxide emissions cap and reduction plan for existing utility emissions
• Austin Energy’s Generation and Resource Climate Action Plan establishes a CO2 reduction goal of 20% below 2005 level.
• In FY 2009, energy efficiency reduced 62,000 metric tons of pollution (City of Austin, 2011).
Establish a Community Climate Protection Committee of stakeholders and technical advisors to (1) inventory GHG emissions from activities community-wide and (2) recommend short-term and long-term GHG emission reduction targets and implementation strategies
• Community GHG emission inventories were completed for 2007 and 2010.
• Climate Action Report 2011 has a “community greenhouse gas roadmap” which provides GHG emission reduction strategies.
Establish a program for recognition of households, businesses, and organizations that achieve carbon neutrality
Table 2: Boston, MA Climate Change Mitigation Strategies
Boston, MA
Basset
and
Shandas
Strategy
Stated Goal
Status
Reduce GHG emissions by 80% by 2050
2
All new vehicles purchased by the City will be alternative fuel vehicles or the most fuel-efficient vehicles available
• In 2007, the mayor issued an executive order that all municipal
departments must purchase hybrid, alternative fueled, or high-efficiency vehicles whenever possible (City of Boston, 2011).
• In September 2011, the City received 10 plug-in hybrid pickup trucks as part of a national test with Chrysler (Atiyeh, 2011).
• In February 2012, various departments of City government will began sharing cars using technology provided by Zipcar. Vehicles once dedicated to specific city departments have been pooled into a citywide fleet, outfitted with special equipment and linked to an online booking system. The program, dubbed FleetHub, is intended to help the City of Boston buy hybrid and alternative fuel vehicles, and dispose of old or underused vehicles (Moore, 2012).
• In April 2010, it was announced that a fleet of 25 emission-controlled, eco-friendly buses were purchased for use in Boston neighborhoods (Automotive Fleet, 2010).
• As of 2011, the City had had 80 fleet vehicles that were hybrid electric vehicles (City of Boston, 2011).
• The City's 450 diesel vehicles all run on a cleaner blend of biodiesel and ultra-low sulfur fuel reducing emissions by 12% - 17% (City of Boston).
3 Requirement for the use of B5 in all municipal diesel vehicles • Requirement in 2007 to use 5% biodiesel blend in all City diesel vehicles (Raab, 2009).
3
Boston, MA
Basset
and
Shandas
Strategy
Stated Goal
Status
5
Implement the recommendations of the energy audits of the Boston Public Library and City Hall, the two largest consumers among municipal facilities.
• City of Boston secured a $6.2 million commitment from NStar to support retrofits of City Hall, the Copley Library, and several smaller library buildings through 2012 (City of Boston, 2011).
5
Boston Housing Authority (BHA) to make energy improvements at 63 developments covering 14,300 apartments
• In March of 2010, the City announced a $63 million initiative to make energy efficiency improvements to facilities in the BHA. The
implementation of water and energy conservation measures will be for approximately 4,300 apartments at 13 public housing developments. Efficiency measures will include replacing water closets, showerheads and faucet aerators, installing energy efficient lighting, converting electric heat to gas, upgrading or replacing old central heating plants and installing co-generation and Photovoltaic Electric systems, Energy Star rated fiberglass windows, high reflective “cool” roof membranes and healthy apartment improvements. An extensive resident education, training, and employment program will complement and reinforce the program over the life of the project (Mayor's Press Office, 2011).
5
Implement more energy performance contracts (EPCs). EPCs allow the cost of the capital improvements to be paid for from the savings generated by energy and water conservation measures.
• EPCs paid for with $63 million initiative announced in March 2010. At the time, it was the largest EPC in the nation for public housing (Ryan, 2010).
5, 6
Incorporate LEED standards and Energy Star products into affordable housing projects
• In January 2007, the City required all new affordable housing developments to be LEED Silver certified and meet Energy Star for Qualified Homes standards (or the equivalent) (City of Boston, 2011).
5, 6 LEED Silver for renovation and construction of all City facilities or any building projects receiving City funding or land • In 2007, a requirement was made for all new and renovated municipal buildings to meet LEED Silver requirements (City of Boston, 2011).
7
Convert all City traffic signals to LEDs (light-emitting diodes) • All traffic signals have been converted to LED lights (City of Boston).
Boston, MA
Basset
and
Shandas
Strategy
Stated Goal
Status
8 Investigate, in detail, the possibility of cogeneration or photovoltaics in police headquarters, City Hall, fire headquarters, and other facilities. • As of 2011, there were 200 kW of PV installed on municipal facilities (City of Boston, 2011).
8
Study the feasibility of installing wind turbines on Long Island in Boston Harbor
• The Federal Aviation Authority did not approve originally proposed turbines due to possible interference with radars at Logan International Airport. Smaller turbines were suggested for further study (Bolgen).
• In February 2012, the City of Boston withdrew its application to install a wind turbine on Moon Island in Boston Harbor because the mayor of Quincy (turbine would have been in City of Quincy’s city limits) withdrew his support of the project (City of Boston).
8, 9
By 2012, at least 15% of electricity purchased by municipal departments shall come from renewable sources
• As of April 2011, the City had purchased 12% of its energy needs from wind power (City of Boston).
• As of 2011, there were 200kW of photovoltaics installed on municipal facilities (City of Boston, 2011).
8, 23
Examine barriers to solar’s widespread deployment and establish the basis for the comprehensive installation of solar technology throughout Boston
• As of 2011, there was 3.2 MW of solar PV capacity in the public and private sectors of the city (City of Boston, 2011).
• “A significant obstacle to the expansion of photovoltaic installations, particularly in the downtown area, is the technical problem of safely connecting distributed generation facilities to the complex electrical grid in that part of the city. The City continues to work with its utility and state partners to resolve this issue” (City of Boston, 2011).
• In 2010, the City released a Solar Boston Permitting Guide and the City Council approved a reduction in construction permit fees for solar energy projects (City of Boston, 2011).
Boston, MA
Basset
and
Shandas
Strategy
Stated Goal
Status
9
Update and streamline the administration of energy purchasing, and create a central database of financial, property, and utility information in order to analyze energy use
11 Enforce law against the excessive idling of vehicles and conduct an extensive education campaign on idling vehicles
11
CleanAir Cabs coalition to establish incentives for more hybrid and alternative fuel cabs and inform drivers and companies of the opportunities presented by these vehicles
• In 2006, incentives were created ($1,000 grants and “head-of-the line” privileges) to encourage taxicab owners to increase the number of hybrid and high-mileage vehicles in their fleets (City of Boston, 2011).
• In 2008, the “Clean Taxi” requirement was enacted that required the conversion of all Boston taxis to high-efficiency vehicles by 2015. In 2009, this requirement was rescinded due to a court ruling stating the regulation was invalid (City of Boston, 2011).
• As of January 2011, 586 of the City’s 1,800 cabs were hybrid vehicles (City of Boston, 2011).
• Pedicabs (cyclist-powered taxis) are now licensed by the City (City of Boston, 2011).
12
Install more bike racks, conduct a mapping project for planning bike routes, and undertake a count of the number of bicycle commuters and other riders in the city
• For new developments, residential buildings with nine or more dwelling units need to provide space for one bicycle for every three dwelling units. Non-Residential uses must provide a bicycle rack near the entrance or include space for bicycles if the development has a public parking garage (Boston Transportation Department).
• Inaugural bicycle route map, Bike Routes of Boston, was created in 2009. Updated annually and is a free publication by Boston Bikes.
• Interactive map on the internet, ridethecity.com, is based on the Bike Routes of Boston map and user feedback. This website allows users to plan routes using the safest routes available.
Boston, MA
Basset
and
Shandas
Strategy
Stated Goal
Status
12
Expand network of bike trails • In 2011, there were 50 miles of bike lanes in the city compared to 60
yards in 2007. This brings the total of on-road and off-road network to over 100 miles (Boston Bikes, 2012).
13 Invest in road and sidewalk repair projects and repaint crosswalks to provide safe pedestrian access • According to the City budgets, $11,254,052 was spent between the fiscal years 2007 and 2010 on sidewalk repair.
16, 26
Administer several complementary parking programs to discourage commuters from driving into the city
• Parking freeze for new development specific areas of the city has been active since the 1970s. The freeze was designed to limit the amount of parking spaces. It aims to reduce vehicular traffic into the CBD, promote the use of public transit, and encourage transit oriented development by restricting the number of off-street parking spaces. Boston’s zoning code regulates parking requirements for uses exempt from the parking freeze residential buildings and developments that provide parking spaces to be used only by users of the building). The policy is comprised of two components: the cap and parking bank. Each district has a cap on the number of parking spaces that may be built. The difference between the amount of existing parking spaces and what the parking cap allows is included in the parking bank. Developers must submit an application to withdraw parking spaces from the parking bank for non-exempt uses (NYC Department of City Planning, 2011).
• In 2011, the City raised parking meter fees from $1 per hour to $1.25 per hour. The first increase since the mid-1980s (Andersen, 2011).
Boston, MA
Basset
and
Shandas
Strategy
Stated Goal
Status
17
Increase recycling of all materials by 10% by 2012 • Tonnage of recycling in FY 07 was 27,000 tons. In FY10, it was 41,000. (City of Boston, 2011)
• In 2009, the City switched to a single-stream recycling collection method, which made it easier for residents in the city to recycle (City of Boston, 2011).
• In 2008, the City passed an ordinance that requires waste haulers in the City to provide recycling to all customers (Drake & Ailworth, 2008).
19, 20
Develop checklists on green building standards for homeowners and residential contractors and a program to recognize best practices and design innovation in residential construction and renovation
19, 21 Boston’s zoning code requires that private projects over 50,000 square feet be LEED certifiable • Added into building code in January 2007 that all private and public building over 50,000 ft2 must be LEED certified (City of Boston, 2011).
19, 21
Use energy efficiency standards developed for the Integrated Energy Management Plan
• The City of Boston Energy Reduction Plan was created from recommendations by the Integrated Energy Management Plan from 2004 and on more recent developments in the energy marketplace. The Energy Reduction Plan describes how the City will reduce its energy use 20% below FY2010 levels within five years (City of Boston, 2011).
• In 2010, the City adopted Massachusetts’ Stretch Energy Code which requires developments to be 10% more energy efficient than the state’s standard building codes (Mayor's Press Office, 2010).
19, 21
Develop a resource guide to provide technical assistance to developers and to introduce green building practices at the earliest possible stage of planning
• An energy protocol has been developed for the City’s development review process, which now requires project developers to provide energy load, source, and infrastructure information for new buildings and develop strategies to reduce energy loads and infrastructure (City of Boston, 2011).
24
Boston, MA
Basset
and
Shandas
Strategy
Stated Goal
Status
Award Transportation and Air Quality grants for demonstration, education, and research projects related to reducing air pollution emissions from on-road and off-on-road motor vehicles. Winning projects will encourage the use of mass transit and hybrid vehicles, work to make existing vehicles less polluting, and determine more precisely the relationship between local traffic and local air quality.