ABSTRACT:
Objectives: To compare the effects of two types of information, prevention and response, presented in medication guides and on patients’ perception of medication risks/benefits. Methods: Participants (N=215) were recruited using Amazon Mechanical Turk. The study utilized a 2x2 factorial design. The medication guide used in this study informed participants on the use of a hypothetical DMARD named Xelba. There were four versions of the medication guide that included variations of response and prevention information to a common side effect of a DMARD: infection. Data were collected via the internet. Results: Providing prevention and response information on the side effect of infection with the use of a DMARD did not affect participants’ perception of the medication.
Conclusions: We found no evidence that providing prevention and response information about risks of a medication affects participants’ perception of the medication. More research on this topic should be completed to determine how to better format medication guides. Using a larger sample size to increase the power of the study, focusing on risk and prevention strategies that are less well known to
participants, and using methods more similar to real life communication of medication information may reveal larger effects.
INTRODUCTION:
When a prescription is dispensed, written medication information is usually provided. These resources are paper handouts that contain information meant to educate patients on the risks and safe use practices of the drug being dispensed. A major purpose of a medication guide is being able to provide enough information to the patient so that he/she can avoid serious adverse events related to drug use.1 This information also provides instructions on how to prevent these serious adverse effects associated with taking the medication, warn individuals about significant health risks that could affect one’s decision to take the medication, and the need for proper adherence. If a pharmacist or physician
misses the opportunity to counsel patients on appropriate use of the drug, these materials can become a sole resource in conveying important information to the patients.2
This written medication information also comes in the form of a medication guide, one of the few forms of patient information mandated by the FDA. Medication guides are not required to be
improvement during this time period.3 Many of the studies that have assessed medication guides suggest that patients have an overall limited understanding of drug risks although receiving the information. 1-5 These studies also propose that medication guides are too complex and difficult for patients to comprehend due to the insufficient utilization of risk communication strategies.
However, one research study looked at the effectiveness of a medication guide in conveying safety information to patients and found that a high percentage (93%) of patients remembered receiving medication guides and 86% had read at least part or the entire medication guide.7 Those who reported reading the medication guide had a higher percentage of correct responses to questions about
information regarding potential risks of the medication, signifying enhanced knowledge of the drug’s side effects derived from the medication guide. This indicates that medication guides may be a resource to patients in understanding the potential risks of their medications, but are only the results of one study.
Findings such as these demonstrate that patients are receiving written medication information, but they also encourage a push in improving medication guides and seeking a solution in the most effective way for them to provide useful medication information. There is a need for more research on the way information is communicated to patients through medication guides and patients’ ability to comprehend this information. The usefulness of a medication guide depends on its ability to provide information to a patient that is helpful in understanding and managing their medication. The high demand for research in this area leads to this study.
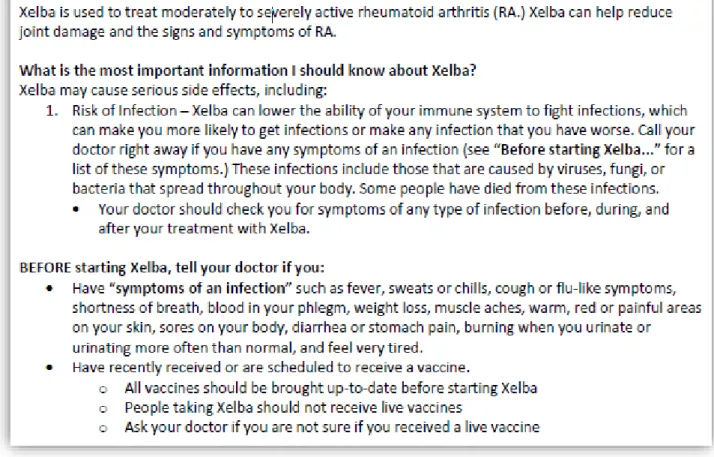
In the medication guide for Enbrel (etanercept), a DMARD used for active rheumatoid arthritis, risk of serious infection is emphasized as the first item mentioned under the header: “What is the most important information I should know?” The medication guide also explains how Enbrel can cause serious infections, describes symptoms of an infection to watch out for, and informs the user of things to tell their doctor before starting Enbrel. However, in the six page medication guide, this information is not organized or easy to find because it is broken up by other information and not placed in a clearly logical sequence. It is important for medication guides to explain the risks of a medication, but also how to minimize these risks (prevention) and what do to if risks appear (response) in a clear format where information is easy to find. The specific aim of this project is to compare the effect of two types of information, prevention and response, and their effect on the patients’ perception of medication risks/benefits.
and response information would result in a multiplicative effect on participant willingness to take the medication, or an effect on any of the secondary outcomes.
STUDY DESIGN & EXPERIMENTAL MATERIALS:
This study utilized a 2x2 factorial design with participants randomized to view variations of a medication guide for a hypothetical medication based on Enbrel. The medication guide used in this study informed participants on the use of a hypothetical DMARD by the name of Xelba. There were four versions of the medication guide that included variations of information.
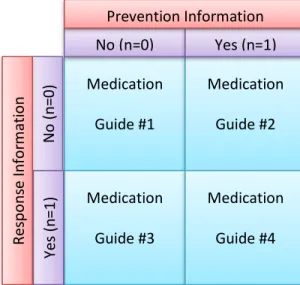
The first section of every medication guide had information that could be found in the Enbrel medication guide. This information included what the medication is indicated for and how it works. It then explained that the most important information to know about Xelba is its risk for serious side effects, especially risk of infection. Also, all medication guides included what participants should tell their doctor before starting Xelba, including their vaccine schedule/history and if the participant is currently displaying “symptoms of infection.” Medication guides 2 and 4 additionally had prevention information. This section of the medication guide gave the participant tips on ways to prevent infections while taking Xelba. Medication guides 3 and 4 additionally had response information. This segment explained to participants the importance of monitoring for symptoms of an infection and contacting their doctor if any of these symptoms occur while taking the medication. By responding to these symptoms, participants can treat an infection early on and prevent it from getting worse.
Figure 1 below demonstrates what information was in each of the four Xelba medication guides. Figures 1a-3a in the Appendix contain screenshots of the different parts of our hypothetical medication guide.
Figure 1: Information Provided in each “Xelba” Medication Guide Medication Guide #1 Medication Guide #2 Medication Guide #3 Medication Guide #4 No (n=0) Yes (n=1)
DATA COLLECTION METHODS:
This research study used Amazon Mechanical Turk to recruit participants to take a Qualtrics survey. Amazon Mechanical Turk is a crowdsourcing web service that coordinates the activities of individuals who need tasks performed and workers who are paid for performing the tasks. Each participant was assigned to read one of the four variations of the medication guides for Xelba and answered follow-up questions. These questions included demographic questions and questions assessing willingness to take the medication, perception of the medication’s risks and benefits, and perception of the likelihood of developing a serious infection when taking Xelba. The study population was limited to people over the age of 45. Patients who had rheumatoid arthritis were excluded due to potential bias. The Qualtrics survey included a timer so that we could assess the amount of time participants spent reading the medication guide. The Qualtrics survey also had an attention check question early in the questionnaire to allow us to exclude bots. Based on power calculations, we estimated that a sample size of 64 per group would provide a power of 0.8 to detect group differences equivalent to a standard deviation of 0.5. Therefore, a sample size of 256 was necessary to adequately power the study.
MEASURES:
The primary outcome was willingness of the participant to take the medication. This was assessed by asking individuals: “If you had rheumatoid arthritis and your doctor prescribed this
medication for you, how likely is it that you would take it?” Responses were recorded on a 7-point scale that ranged from 0=Very unlikely to 6=Very likely. Participants were also asked to indicate the most important reason for their response. Options provided were: a) most of the adverse events are not very serious; b) any serious adverse events are preventable; c) prefer to avoid taking medications and will do something else; d) the risk for infection is too likely; e) the risk of infection is too serious; and f) other.
Five secondary outcome variables were assessed. First, we assessed participants’ perception of whether medication benefits outweigh the risks by asking whether the participant agreed or disagreed with the statement, “The potential benefits of taking this medication outweigh the potential risks.” Responses were recorded on a 7-point scale that ranged from 0=Strongly disagree to 6=Strongly Agree. Second, we assessed participants’ perception of the safety of the medication by asking: “How safe or dangerous is this medication?” Responses were recorded on a 7-point scale that ranged from 0=Very dangerous to 6=Very safe. Third, we assessed participants’ perception on the likelihood of the
medication, how likely is the medication to help you?” Fourth, we assessed participants’ perception on
the likelihood of getting a serious infection by asking: “If you had rheumatoid arthritis and took this medication, how likely are you to get a serious infection.” Finally, we assessed participants’ perception
on the likelihood of recommending the medication to someone else with rheumatoid arthritis by asking: “How likely are you to recommend this medication to somebody else with rheumatoid arthritis?” Responses to these last three questions were recorded on a 7-point scale that ranged from 0=Very unlikely to 6=Very likely.
The following socio-demographic characteristics were also assessed: age (in years), gender, race (White/Caucasian, Black/African American, Hispanic/Latino, Asian/Pacific Islander, Arab American, or other), highest level of education (Grammar School, High School or equivalent, Associate’s Degree, Bachelor’s Degree, Master’s Degree, Doctoral Degree, or other), and self-identification as a health care professional (yes/no). Race was dichotomized as White/Nonwhite and education was dichotomized as University Graduate/Not University Graduate. Lastly, perceived personal health status was assessed on a 5-point scale that ranged from 1=Poor to 5=Excellent. Participants were asked whether they were currently taking any regular prescription medications (yes/no) and whether they had ever had serious side effects from taking medication (yes/no).
STASTICIAL ANALYSIS:
RESULTS:
Data were collected from 321 participants, however only 303 passed the attention check question and were over the age of 45 years old. We also excluded 88 participants because they did not spend sufficient time reading the study materials, bringing the total sample size down to 215. The mean age of study participants (N=215) was 53.6 (SD=6.02). Most participants were female (71.16%), white (88.37%), and have received a form of a college degree (71.63%). The percentage of participants reporting being in excellent, very good, good, fair, and poor health were 6.05, 32.09, 43.26, 15.35, and 3.26, respectively. About half (50.97%) of study participants were currently using a prescription medication and 38.60% reported having experienced a serious medication side-effect in the past. All demographic information can be found in Tables 1a-9a in the Appendix. None of these variables differed significantly across the experimental conditions.
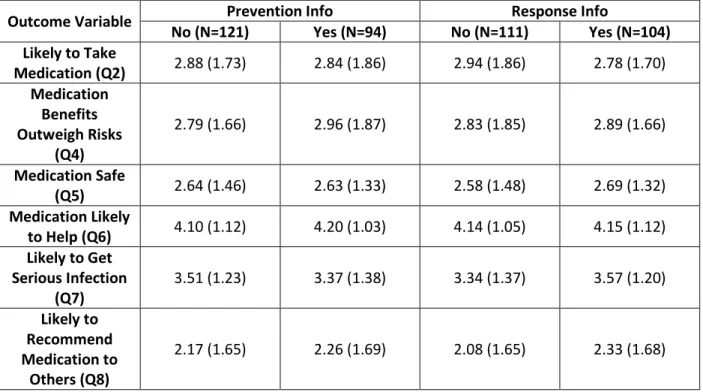
Table 1: Means (SE) for Outcome Variable by Format of Information (N=215)
Outcome Variable Prevention Info Response Info
No (N=121) Yes (N=94) No (N=111) Yes (N=104) Likely to Take
Medication (Q2) 2.88 (1.73) 2.84 (1.86) 2.94 (1.86) 2.78 (1.70) Medication
Benefits Outweigh Risks
(Q4)
2.79 (1.66) 2.96 (1.87) 2.83 (1.85) 2.89 (1.66)
Medication Safe
(Q5) 2.64 (1.46) 2.63 (1.33) 2.58 (1.48) 2.69 (1.32) Medication Likely
to Help (Q6) 4.10 (1.12) 4.20 (1.03) 4.14 (1.05) 4.15 (1.12) Likely to Get
Serious Infection (Q7)
3.51 (1.23) 3.37 (1.38) 3.34 (1.37) 3.57 (1.20)
Likely to Recommend Medication to
Others (Q8)
2.17 (1.65) 2.26 (1.69) 2.08 (1.65) 2.33 (1.68)
Results for both the primary and secondary outcomes are displayed in Table 1 above.
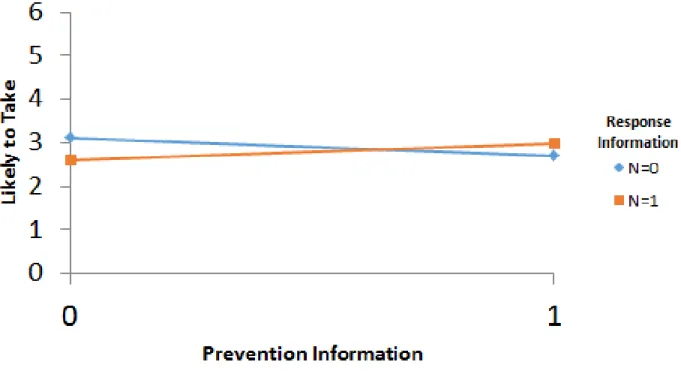
shows the interaction. This interaction suggests that participants were most likely to take the
medication when provided with neither response nor prevention information or if provided with both response and prevention information compared to being provided with either response or prevention information alone.
Figure 2: Interaction between Response and Prevention Information on Willingness of Participant to Take the Medication (Q2)
DISCUSSION:
Unfortunately, we did not obtain a large enough sample size to adequately power our study which could result in not having enough participants to show anything of statistical significance. Therefore, it is difficult to determine if our hypothesis of adding prevention and/or response
information about the risk of a medication increases participant willingness to take the medication is, in fact, false. Replicating this study with a larger sample size could provide more power to the study and consequently different results.
prevention information or only response information, then they are less willing to take the medication than if receiving both forms of information. Therefore, participants may be more willing to take the medication when provided neither of the extra information, or if provided with both how to prevent and how to respond to the explained side effect. However, to reiterate, this is only a suggestion of a possible interaction and it would be interesting to see if this interaction would reach statistical significance if replicated with a larger sample size.
Also, the inability to reach statistical significance in this study could be because of the generally well-known perception of infection as a side effect to participants. Perhaps the information on how to prevent or how to respond to signs of infection are already common knowledge for participants. For example, we are taught at a young age how to prevent getting serious infections by practicing good hygiene, avoiding contact with sick people, getting enough sleep, etc. Also, we may already respond to signs of infection by contacting our doctor even without it being a side effect from a medication. Participants may already know that, by responding to these symptoms, they can treat an infection early on and prevent it from getting worse. Therefore, the results may be different on how prevention and response information affects participants’ risk of their medication if participants were presented information on a side effect with uncommon prevention and response information. For example, the study could be replicated using the side effect of suicidality when taking antidepressants or the development of thrush when using an inhaled corticosteroid.
Lastly, the methods of our study could be a limitation. This study used a convenience sample by recruiting participants with Amazon Mechanical Turk and collecting data using the Internet. Although we tried to limit potential bias by excluding participants less than 45 years old or with rheumatoid arthritis, the generalizability of this patient population is unknown. It is always possible that making our methods more similar to how medication guides are distributed and communicated in real life could strengthen the study and make a difference in the results.
In conclusion, we found no evidence that providing prevention and response information about risks of a medication affects participants’ perception of the medication. More research on this topic
REFERENCES:
1. Knox C, Hampp C, Willy M, Winterstein AG, Dal Pan G. Patient understanding of drug risks: An evaluation of medication guide assessments. Pharmacoepidemiol Drug Saf. 2015;24(5):518-525. doi: 10.1002/pds.3762 [doi].
2. Wolf MS, Davis TC, Shrank WH, Neuberger M, Parker RM. A critical review of FDA-approved medication guides. Patient Educ Couns 2006; 62(3): 316–322.
3. Wolf M. Usability of FDA‐approved medication guides. Journal of general internal medicine : JGIM. 2012;27(12):1714; 1714-1720; 1720.
4. Allen LaPointe NM, Pappas P, Deverka P, Anstrom KJ. Patient receipt and understanding of written information provided with isotretinoin and estrogen prescriptions. J Gen Intern Med 2007; 22(1): 98– 101.
5. Shiffman S, Gerlach KK, Sembower MA, Rohay JM. Consumer understanding of prescription drug information: an illustration using an antidepressant medication. Ann Pharmacother 2011; 45(4): 452– 458.
6. Enger C, Younus M, Petronis KR, Mo J, Gately R, Seeger JD. The effectiveness of varenicline medication guide for conveying safety information to patients: A REMS assessment survey. Pharmacoepidemiol
APPENDIX:
Figure 1a: Information Provided in Medication Guides 1, 2, 3 & 4
Figure 3a: Response Information Provided in Medication Guides 3 & 4
Table 1a: Age
Age 45 46 47 48 49 50 51 52 53 54 55 56 57 58
Percent 6.35 3.70 6.88 6.88 4.76 5.82 5.29 5.82 6.35 7.41 5.82 5.82 3.70 1.59
Age 59 60 61 62 63 64 65 66 67 68 69 70 71 72
Percent 5.29 4.23 3.70 1.06 1.06 4.59 2.12 1.06 1.06 0.53 1.06 0 0.53 0.53
Table 2a: Gender
Gender Percentage Male (1) 28.84% Female (2) 71.16%
Table 3a: Race
Race Percentage
White/Caucasian (1) 88.37% Black/African American (2) 5.58%
Hispanic/Latino (3) 3.26% Asian/Pacific Islander (4) 0.93% Arab American (5) 0.47%
Other (6) 1.40%
Table 4a: Education
Education Percentage Grammar School (1) 0% High School or equivalent (2) 28.37%
Associate’s Degree (3) 18.14% Bachelor’s Degree (4) 30.70% Master’s Degree (5) 16.28% Doctoral Degree (6) 3.72%
Table 5a: Health Care Professional Health Care Professional Percentage
Yes (1) 1.40%
No (2) 98.60%
Table 6a: Health Rating Health Rating Percentage
Excellent (1) 6.05% Very Good (2) 32.09%
Good (3) 43.26% Fair (4) 15.35% Poor (5) 3.26%
Table 7a: Prescription Medication Use
Currently taking regular prescription meds? Percentage
Yes (1) 59.07%
No (2) 40.93%
Table 8a: Previous Side Effect from Medication
Serious side effects from taking a med? Percentage
Yes (1) 38.60%
No (2) 61.40%
Table 9a: Participants per Medication Guide Med Guide 1 65