Evaluating Intrusion Detection Systems:
The 1998 DARPA Off-line Intrusion Detection Evaluation*
*This work was sponsored by Rome Laboratory and the Department of Defense Advanced Research Projects Agency under Air Force Contract F19628-95-C-0002. Opinions, interpretations, conclusions, and recommendations are those of the author and are not necessarily endorsed by the United States Air Force.
Richard P. Lippmann, David J. Fried, Isaac Graf, Joshua W. Haines, Kristopher R. Kendall, David McClung,
Dan Weber, Seth E. Webster, Dan Wyschogrod, Robert K. Cunningham, and Marc A. Zissman
Lincoln Laboratory MIT, 244 Wood Street, Lexington, MA 02173-9108
Email: [email protected] or [email protected]
ABSTRACT
A intrusion detection evaluation test bed was developed which generated normal traffic similar to that on a government site containing 100’s of users on 1000’s of hosts. More than 300 instances of 38 different automated attacks were launched against victim UNIX hosts in seven weeks of training data and two weeks of test data. Six research groups participated in a blind evaluation and results were analyzed for probe, denial-of-service (DoS), remote-to-local (R2L), and user to root (U2R) attacks. The best systems detected old attacks included in the training data, at moderate detection rates ranging from 63% to 93% at a false alarm rate of 10 false alarms per day. Detection rates were much worse for new and novel R2L and DoS attacks included only in the test data. The best systems failed to detect roughly half these new attacks which included damaging access to root-level privileges by remote users. These results suggest that further research should focus on developing techniques to find new attacks instead of extending existing rule-based approaches.
1. Introduction
Heavy reliance on the internet and worldwide connectivity has greatly increased the potential damage that can be inflicted by attacks launched over the internet against remote systems. It is difficult to prevent such attacks by the use of security
policies, firewalls, or other mechanisms because system and application software always contains unknown weaknesses or bugs. In addition, complex, often unforeseen, interactions between software components and/or network protocols are continually exploited by attackers. Successful attacks inevitably occur despite the best security precautions. Intrusion detection systems have become an essential component of computer security to detect these attacks before they inflict widespread damage. A review of current approaches to intrusion detection is available in [1]. Some approaches detect attacks in real time and can stop an attack in progress. Others provide after-the-fact information about attacks and can help repair damage, understand the attack mechanism, and reduce the possibility of future attacks of the same type. More advanced intrusion detection systems detect never-before-seen, new, attacks, while the more typical systems detect previously seen, known attacks.
Evaluations of developing technologies such as those used for intrusion detection are essential to focus effort, document existing capabilities, and guide research. For example, yearly DARPA-sponsored evaluations in the speech recognition area have contributed substantially to rapid technical progress [2]. Periodic speech evaluations have focused research on difficult technical problems, motivated researchers to build advanced systems, facilitated information sharing, provided common corpora, and made it easier for new researchers to enter this field and explore alternate approaches [2].
researchers, (2) Evaluated many intrusion detection systems, (3) Included a wide variety of attacks, and (4) Measured both attack detection rates and false alarm rates for realistic normal traffic. Most prior research in this area evaluated individual systems using a small number of attacks and little background traffic (e.g. [3,4,5]) or evaluated systems using confidential in-house red-teaming experiments where attacks are launched by teams of experts against a test or operational network. An evaluation of many systems with a shared corpus is difficult for many reasons. First, operational networks can not normally be used for evaluations due to service disruptions caused by attacks and the need to maintain privacy and security which mitigates the possibility of sharing network traffic data with others. Second, intrusion detection systems use a variety of non-standardized input data sources including host-based audit data and network traffic data. Finally, existing and new attacks must be developed and successfully launched against a wide range of hardware and software. The goal of the research reported in this paper was to address these issues and perform careful evaluations in support of the DARPA Information Survivability and Information Assurance Programs which have been developing new approaches to intrusion detection [6]. These evaluations were planned to serve the same role for the field of intrusion detection that the DARPA Speech Recognition evaluations serve in the field of speech recognition. The remainder of this paper focuses on the 1998 off-line intrusion detection evaluation. The design goals of this evaluation are reviewed, the approach taken to develop an evaluation test bed is described, the approach taken to developing attacks on this test bed is presented, and results of the 1998 off-line evaluation are then reviewed. A summary and discussion of future plans follow.
2. GOALS AND OVERVIEW
The 1998 off-line intrusion detection evaluation was the first in a planned series of annual evaluations conducted by MIT Lincoln Laboratory under DARPA sponsorship. These evaluations are designed to focus research efforts on core technical issues and provide unbiased measurement of current performance levels. The primary purpose of the evaluations is to drive iterative performance improvements in participating systems by revealing strengths and weaknesses and helping researchers focus on eliminating weaknesses. To insure that the greatest numbers of researchers can participate, common shared corpora are created that can be distributed and used by a wide range of researchers. Such corpora simplify entrance into this field and make it possible to compare alternate approaches. To make sure the evaluation could uncover weaknesses in many types of intrusion detection systems, widely varied attacks were developed that span the types of attacks which might be used by both novice and highly skilled attackers. Efforts were also made to keep the evaluation simple and to
encourage the widest participation possible by eliminating security and privacy concerns and providing data types used by the majority of intrusion detection systems. Simplicity and more widespread participation were obtained in the first 1998 evaluation by focusing on UNIX hosts and outside attacks originating from remote hosts.
A novel feature of this evaluation is the use of receiver operating characteristic (ROC) techniques to evaluate intrusion detection systems. The ROC approach analyzes the tradeoff between false alarm and detection rates for detection systems. ROC analysis was originally developed in the field of signal detection [7,8]. More recently, it has become the standard approach to evaluate detection systems and have been used in fields as diverse as language and speaker identification [9] and medical risk prediction [10]. ROC curves for intrusion detection indicate how the detection rate changes as internal thresholds are varied to generate more or fewer false alarms to tradeoff detection accuracy against analyst workload. Measuring the detection rate alone only indicates the types of attacks that an intrusion detection system may detect. Such measurements do not indicate the human workload required to analyze false alarms generated by normal background traffic. False alarm rates above 100’s per day make a system almost unusable, even with high detection accuracy, because putative detections or alerts generated can not be believed and security analysts must spend many hours each day dismissing false alarms. Low false alarm rates combined with high detection rates, however, mean that the putative detection outputs can be trusted and that the human labor required to confirm detections is minimized.
concerns such as memory requirements, system processor requirements, and ease of use were not measured. A second real-time evaulation was performed in tandem with this off-line evaluation to address these practical issues. This real-time evaluation used four hours of background traffic and included a smaller number of complete packaged systems that could be delivered and run on a test network [11]. It made use of many of the traffic generation tools and attacks developed for the off-line evaluation.
3. Evaluation Test Bed
Three approaches were initially explored to generate a corpus that could be widely distributed and that included both background traffic and attacks. The first proposal was to capture operational traffic both during normal operations and with controlled live attacks against selected components of an actual network. This was not possible because it would release private information, compromise security, and it could damage systems and stop important network activities. A second proposal was to sanitize sampled operational data and insert attacks into this sanitized data. A few simple analyses showed that this again was not possible due to the difficulty of removing all security-related and private information from network traffic and the complexity of preventing the introduction of artifacts when attacks are inserted. Sanitization alone would require examining every email message, file transfer, and browser interaction to eliminate private or confidential information. It would also require changing all user names, IP addresses, file names, system names, and any other site-specific information. The final proposal, which we followed, was to recreate normal and attack traffic on a private
network using real hosts, live attacks, and live background traffic.
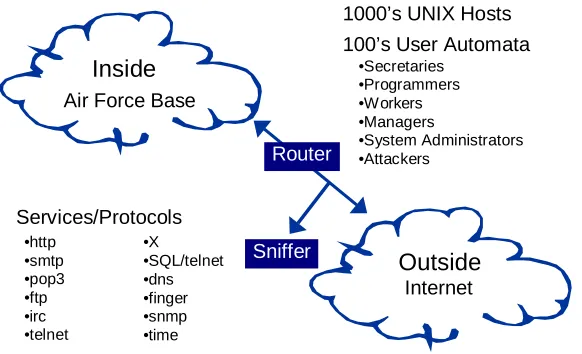
Figure 1 shows a conceptual view of the evaluation test bed that was created. This test bed generates live traffic similar to that seen between a small Air Force base and the Internet. Custom software automata simulate hundreds of programmers, secretaries, managers, and other types of users running common UNIX application programs. In addition, custom software allows a small number of actual hosts to appear as if they were 1000’s of hosts with different IP addresses. Many types of traffic are generated which use a variety of network services. User automata send and receive mail, browse web sites, send and receive files using FTP, use telnet to log into remote computers and perform work, send and receive IRC messages, monitor the router remotely using SNMP, and perform other tasks. The overall proportion of traffic from different services and the variability of traffic with time of day are similar to that observed on Air Force Bases. Protective devices such as firewalls were omitted because the focus was on detecting attacks, and not preventing attacks. All attacks are launched from the outside of the simulated base and thus evidence of each attack is available in the network traffic captured by the sniffer positioned at the entrance to the base.
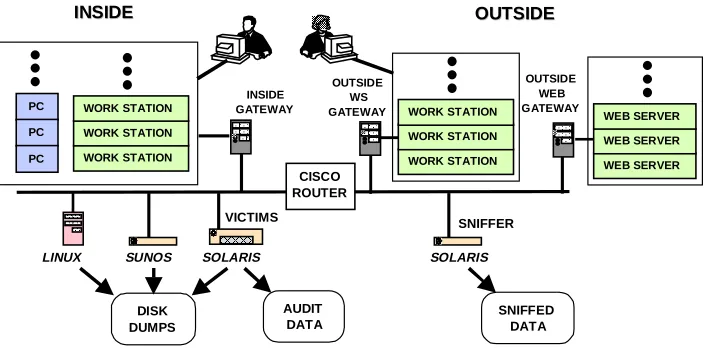
Figure 2 shows a more detailed block diagram of the evaluation test bed. The inside of the simulated Air Force base contains three machines which are the most frequent victims of attacks (Linux 2.0.27, SunOS 4.1.4, Sun Solaris 2.5.1), and a gateway to hundreds of other inside emulated PCs and workstations. The outside of the simulated base simulates the Internet. It contains a sniffer to capture traffic, a gateway to hundreds of emulated workstations on many other subnets and a second
Outside
Internet Air Force Base
•http •smtp •pop3 •ftp •irc •telnet
•X •SQL/telnet •dns •finger •snmp •time
Services/Protocols
Inside
Router
1000’s UNIX Hosts
Sniffer
•Secretaries •Programmers •Workers •Managers
•System Administrators •Attackers
[image:3.612.157.448.88.265.2]100’s User Automata
gateway to thousands of emulated web servers. Data collected to evaluate intrusion detection systems include network sniffing data from the outside sniffer, Sun Basic Security Module (BSM) audit data collected from the Solaris host, and nightly full disk dumps from the three UNIX victim machines. In addition to automatic traffic, human actors sometimes generate background traffic and attacks from the gateways when the traffic or attack is too complex to automate.
4. Background Traffic Generation
Background traffic was necessary to determine the false alarm rates of intrusion detection systems. A large amount of web, telnet, and mail traffic was generated between the inside PC’s and workstations and the outside workstations and web sites. In addition, there are many user automata of various types (e.g. secretaries, programmers, managers) on outside workstations who perform work using telnet and other services on the three inside victim machines and the other inside workstations. The three gateway machines contain operating system kernel modifications similar to those used in [11] in conjunction with custom software web, mail, telnet, and other servers to allow a small number of actual hosts to appear as if they were 1000’s of hosts with different IP addresses. The contents of network traffic such as SMTP, HTTP, and FTP file transfers are either statistically similar to live traffic, or sampled from public-domain sources. For example, some email message contents are created using statistical bigrams frequencies to preserve word and two-word sequence statistics from a sampling of roughly 10,000 actual email messages to and from computer professionals filtered using a 40,000 word dictionary to remove names and other private information. Other email messages are actual messages from a variety of public-domain mail list servers. Similar approaches were used to produce content for FTP file transfers.
Content of the web servers was initially captured using a custom web automaton that was run on the real Internet. This automaton was programmed to visit thousands of web sites popular with university and government personnel with a frequency that depended on the site’s popularity and to visit a random number of links at each site before traversing to another site. It generated a large database of public-domain site content, which was transferred to the evaluation test bed. This was necessary because the evaluation test bed was disconnected from the Internet for security reasons and live web sites could thus not be accessed. When the test bed was run, browsing automata accessed web pages through the outside web gateway. This gateway used custom software to emulate thousands of web sites. Telnet sessions were generated from statistical profiles of user types that were used to generate interactive sessions. These statistical profiles indicated the frequency of occurrence of different UNIX commands (e.g. mail, lynx, ls, cd, vi, cc, and man), typical login times and telnet session durations, typical source and destination machines, and other information. For example, programmers primarily edited C programs, compiled these programs, sent mail, read UNIX manual pages, and ran programs. Secretaries edited documents, and sent mail. There were also a large number of users who primarily sent and received mail and browsed web sites. Public domain sources were used to obtain software programs created by simulated programmers, documents created by secretaries, and other content. As suggested in [3], a modified version of the expect language was used to create user automata which behaved as if they were users typing at keyboards. Human actors performed more complex tasks. They upgraded software, added users, changed passwords, remotely accessed programs with graphical user interfaces, and performed other system administration tasks. INSIDE
GATEWAY
INSIDE
INSIDE OUTSIDEOUTSIDE
SNIFFER LINUX SUNOS SOLARIS SOLARIS
OUTSIDE WS GATEWAY
CISCO ROUTER
AUDIT DATA
SNIFFED DATA DISK
DUMPS
VICTIMS
PC PC
PC WORK STATION WORK STATION WORK STATION
WORK STATION WORK STATION WORK STATION
OUTSIDE WEB GATEWAY
[image:4.612.131.484.82.256.2]WEB SERVER WEB SERVER WEB SERVER
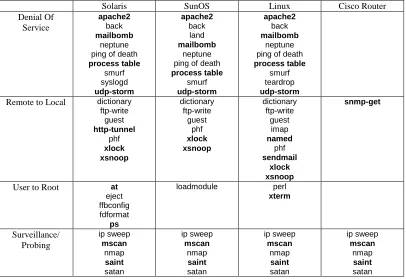
5. Attacks
The 32 different attack types shown in Table 1 were used in the evaluation. Attacks used during both training and testing are shown using normal type. New and novel never-before-seen attacks used only in the test data are shown in bold. Detailed information on these attacks is available in [12]. Attacks were selected to permit evaluation of UNIX intrusion detection systems that protect Sun Solaris, SunOS, and Linux hosts and routers. The attacks had a variety of goals. The upper row of Table 1 contains denial of service (DoS) attacks designed to disrupt a host or network service. Some DoS attacks (e.g. smurf) exessively load a legitimate network service, others (e.g. teardrop, Ping of Death) create malformed packets which are incorrectly handled by the victim machine, and others (e.g. apache2, back, syslogd) take advantage of software bugs in network daemon programs. The second row of Table 1 contains Remote to Local (R2L) attacks. In these attacks, an attacker who does not have an account on a victim machine, sends packets to that machine and gains local access. Some R2L attacks exploit buffer overflows in network server software (e.g. imap, named, sendmail), others exploit weak or misconfigured security policies (e.g. dictionary, ftp-write, guest) and one (xsnoop) is a trojan password capture program. The snmp-get R2L attack against the router is a password
guessing attack where the community password of the router is guessed and an attacker then uses SNMP to monitor the router.
The third row of Table 1 contains user to root (U2R) attacks where a local user on a machine is able to obtain privileges normally reserved for the UNIX root or super user. Some U2R attacks exploit poorly written system programs that run at root level which are susceptible to buffer overflows (e.g. eject, ffbconfig, fdformat), others exploit weaknesses in path name verification (e.g. loadmodule), bugs in some versions of suidperl (e.g. perl), and other software weaknesses. The bottom row of Table 1 contains probe or scan attacks. These include many programs that can automatically scan a network of computers to gather information or find known vulnerabilities. Such probes are often precursors to more dangerous attacks because they provide a map of machines and services and pinpoint weak points in a network. Some of these scanning tools (e.g. satan, saint, and mscan) enable even an unskilled attacker to check hundreds of machines on a network for known vulnerabilities.
[image:5.612.111.517.104.383.2]Attack development was a major effort that involved many components. First the attack mechanism was analyzed and a working attack was developed on the evaluation test bed for analysis and tuning. This analysis was performed to determine whether the attacked worked in the test bed or whether new software and/or services are required to support the attack. It
Table 1. Attack types used in the evaluation. New attacks that occurred only in the test data are bold.
Solaris SunOS Linux Cisco Router
Denial Of Service apache2 back mailbomb neptune ping of death
process table smurf syslogd udp-storm apache2 back land mailbomb neptune ping of death
process table smurf udp-storm apache2 back mailbomb neptune ping of death
process table
smurf teardrop
udp-storm Remote to Local dictionary
ftp-write guest http-tunnel phf xlock xsnoop dictionary ftp-write guest phf xlock xsnoop dictionary ftp-write guest imap named phf sendmail xlock xsnoop snmp-get
User to Root at
enabled us to capture the types of network traffic generated by the attack, to develop stealthy versions of the attack, and to design additional background traffic to run during the evaluation that provides normal usage of services and/or programs required by the attack. For example, to make attacks that generate X-windows traffic more difficult to detect, normal users also generate some X-windows traffic during the evaluation. The attack was then automated, stealthy versions of some attacks were developed and tested, procedures were developed to verify that the attack worked, required background traffic was generated, and documentation was created. This process required from one week to one month per attack. In some cases, transcripts of actual Air Force intrusions were used to develop attack scenarios. When such transcripts were not available, attacks were developed using publicly known attacks and accounts of intrusions on civilian computer systems
Novel attacks were developed by looking for unexploited system or network weaknesses. The new HTTP-tunnel attack used what looked like normal web browsing to create a covert channel between an attacker and a victim machine. Custom software installed on a victim browsed the web once a day and contacted what looked like a normal web server. This server, however, was a remote attacker who could interact with the victim, download files from the victim, and run UNIX commands on the victim using what looked like normal HTTP replies to queries. This attack was difficult to detect within the large amount of normal HTTP traffic. The novel sendmail buffer overflow attack exploited a weakness in the MIME translation code of a particular version of sendmail. One carefully crafted email message containing a buffer overflow sent to a victim created a new entry in the victim’s password file that allowed an attacker to telnet in and login as root. The novel process-table attack uses up all process table entries on a victim machine. It continuously opens finger connections to the victim at a rate that is fast enough to eventually fill up the process table, but not too fast to trigger system thresholds that would disallow new connections. Finally, the at attack is a
normal buffer overflow that is installed, but then set to run at a later time using the UNIX “at” command. This attack was included to determine whether intrusion detection systems could trace a delayed “time bomb” style attack back to the original network connection where the attack was installed.
Half of the U2R and R2L attacks included actions after the attacker achieved root or local access on the victim machine. Actions included modifying or examining the password, shadow, or .rhosts file, creating a suid root shell, using telnet to connect to other sites, and installing trojan executables, a sniffer, or a server on a high level port. Roughly 25% of the U2R attacks were stealthy. The attack source code and outputs of commands issued from root shells were encrypted using uuencode or small custom C programs, wildcards were used to hide critical UNIX commands, actions were delayed, and the setup, attack, and post-attack actions were spread over multiple telnet sessions. In addition, roughly 10% of the probes were made stealthy by running sweeps slowly and by examining ports and/or IP addresses in random instead of sequential order.
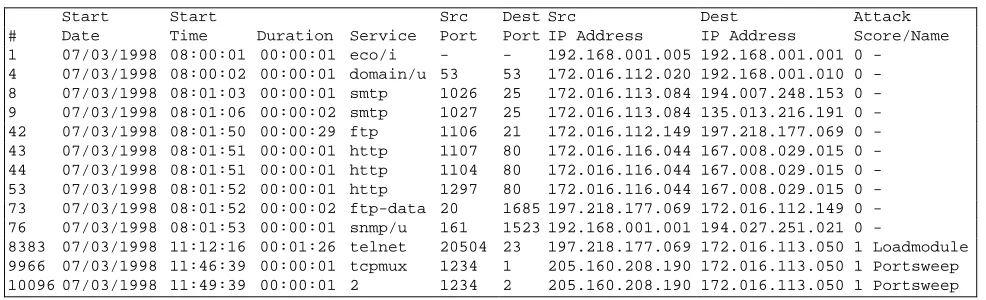
6. Labeling Training and Test Data
[image:6.612.53.546.559.709.2]Training data with labeled attacks was first provided to participants from July to mid September 1999 to allow them to tune and train their intrusion detection systems. Unlabeled test data was then provided in late October for a blind evaluation. List files were used to both label attacks in training data and score network connections in unlabeled test data. These files contain entries for every important TCP network connection as well as for ICMP, and UDP packets. Table 2 shows selected lines from a list file containing more than 287,000 entries from one day of training data. List files provided with training data indicated those connections which were parts of attacks and list files returned by participants for test data indicated those network connections selected to be parts of attacks by intrusion detection systems. A separate line in each list file describes each TCP connection and each UDP or ICMP packet. Each line begins with a unique identification number, the start date and
Table 2. Entries extracted from a training list file that labels network connections and attacks for one day.
Start Start Src Dest Src Dest Attack
# Date Time Duration Service Port Port IP Address IP Address Score/Name 1 07/03/1998 08:00:01 00:00:01 eco/i - - 192.168.001.005 192.168.001.001 0
-4 07/03/1998 08:00:02 00:00:01 domain/u 53 53 172.016.112.020 192.168.001.010 0 -8 07/03/1998 08:01:03 00:00:01 smtp 1026 25 172.016.113.084 194.007.248.153 0 -9 07/03/1998 08:01:06 00:00:02 smtp 1027 25 172.016.113.084 135.013.216.191 0 -42 07/03/1998 08:01:50 00:00:29 ftp 1106 21 172.016.112.149 197.218.177.069 0 -43 07/03/1998 08:01:51 00:00:01 http 1107 80 172.016.116.044 167.008.029.015 0 -44 07/03/1998 08:01:51 00:00:01 http 1104 80 172.016.116.044 167.008.029.015 0 -53 07/03/1998 08:01:52 00:00:01 http 1297 80 172.016.116.044 167.008.029.015 0 -73 07/03/1998 08:01:52 00:00:02 ftp-data 20 1685 197.218.177.069 172.016.112.149 0 -76 07/03/1998 08:01:53 00:00:01 snmp/u 161 1523 192.168.001.001 194.027.251.021 0
time for the first byte in the connection or packet, the duration until the final byte was transmitted, and a service name. The service name contains either the common port name for TCP and UDP connections or the packet type for ICMP packets. Names for non-TCP protocols are terminated by a slash followed by a single letter that indicates the service (e.g. an “i” for ICMP and a “u” for UDP). Following the name are the source and destination port for TCP and UDP connections, the source and destination IP addresses, the attack score and the attack name. The attack score is zero and the name is a dash for connections that are not part of an attack. In the training data, the attack score is set to 1 and the name is a text string to label connections associated with attacks. In the test data, attacks are not labeled. Instead, all attack scores are zero and all attack names are “-“. It is the responsibility of participants to process the test data and then label list file entries corresponding to presumed or putative attacks. Scores of connections associated with attacks were to be set to non-zero values where more positive values indicated greater certainty of an attack. Attack names were to contain either the name of an old attack that was provided in the training data or a more generic attack category name (e.g. probe, DoS, U2R, R2L) for new attacks.
The list file in Table 2 shows examples of many types of Internet traffic as well as components of two different labeled
attacks in the training data. The first entry at roughly 8:00 AM is a normal ICMP echo packet. This is followed by normal domain name server, mail, FTP, and web traffic. There is a user to root loadmodule attack in telnet session labeled number 8383 at 11:12 AM and then a portsweep attack begins at 11:46 AM examining lower number ports first and sweeping up. There were more than 287,000 other entries in this list file. The other entries were omitted for clarity. List files also include a short hand notation to indicate when many packets of the same type occur (e.g. ICMP echo-reply packets that are part of a smurf attack) to reduce their size.
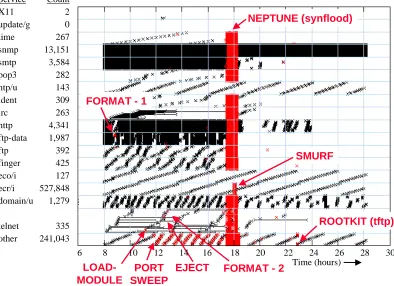
Figure 3 shows all the network connections in a single day of training data corresponding to the list file in Table 2. It illustrates the wide variety of network traffic types, the variation of traffic over a day, the visibility of some network attacks, the relative percentages of different types of traffic, and the duration of common TCP connections. The test bed runs each day from 8:00 AM until roughly 6:00 AM of the next day on every week day as shown by the horizontal axis of this figure. The two-hour gap in the morning is used to upload audit files and sniffer data, to download traffic generation files, to reboot all machines, and to prepare for the next day of the test bed run. The vertical regions in Figure 3 bounded by horizontal lines contain traffic for different services and protocols. The
PORT SWEEP
LOAD-MODULE FORMAT - 1
EJECT FORMAT - 2
NEPTUNE (synflood)
SMURF
ROOTKIT (tftp) Service Count
X11 2
update/g 0
time 267
snmp 13,151
smtp 3,584
pop3 282
ntp/u 143
ident 309
irc 263
http 4,341
ftp-data 1,987
ftp 392
finger 425
eco/i 127
ecr/i 527,848 domain/u 1,279
telnet 335
other 241,043
6 8 10 12 14 16 18 20 22 24 26 28 30
[image:7.612.103.497.385.671.2]Time (hours)
column entries at the left of each region specify the service or packet type and the number of connections or packets of each type. For example there were 3,584 SMTP mail transfer TCP connections, 4,341 web HTTP TCP connections, and 127 echo ICMP packets. Each line segment represents a single network connection and lines representing succesive sessions are displaced vertically slightly and wrap around within each vertical region. The length of the lines represents the duration of each network connection. Lines begin with a greater-than sign “>” and end with a less-than sign “<”, and thus form an “X” for short sessions. The majority of TCP/IP sessions are short and look like X’s. Telnet sessions created by automata that simulate users are shown as longer lines that range from two to six hours in duration. Solid black regions in Figure 3 correspond to services with the most traffic including mail (SMTP), web (HTTP), and FTP-data file transfers. They also include SNMP network monitoring which ran continuously, and domain name service which resolved IP address names required to deliver mail, send FTP files, telnet to remote hosts, and perform other network services. Figure 3 also shows where eight attacks occurred during this day of training. Many different types of attacks are shown. Most obvious are the neptune or synflood denial of service attack to all TCP ports which lasts for an hour starting at roughly 17:30 and the short overlapping smurf echo-reply flooding that runs for roughly 15 minutes around 18:00. The smurf attack accounts for the large number of “ecr/i” echo-reply ICMP packets (527,848) and the neptune attack accounts for many of the “other” packets because it swept all 1024 low-numbered ports multiple times. Other attacks are less obvious. The loadmodule and eject U2R attacks each occur in one telnet session. The format U2R attack includes an initial FTP session to download the attack script and a second telnet session to run the attack. Finally, a portsweep starts a little before 12:00 and the end of a rootkit sniffer installation is accomplished at roughly 23:00
.
7. Participants and Scoring
Six groups participated in the evaluation and submitted systems using a variety of approaches to intrusion detection. Details of these systems are provided in [13-18]. Three systems attempted to detect all four categories of attacks using tcpdump network packet data sometimes supplemented with BSM audit data. One of these three used data mining or pattern classification approaches to develop detectors for old attacks included in the training data [13]. The other two were expert systems composed of hand-crafted signatures and efficient pattern matching algorithms designed to detect old attacks or variants of old attacks [14,15]. An additional expert system used handcrafted signatures to find only probe and DoS attacks in tcpdump data [16]. Two other systems detected U2R attacks against the Solaris victim host. One performed automated nightly forensic analyses of file system dumps to detect
attacks [17], and the other detected anomalous behavior in BSM system-call sequences using neural networks [18]. In addition to these six submitted systems, a simple keyword system was included to provide a baseline reference for U2R attacks. The algorithm used to score the likelihood of an attack in each TCP session in this system is similar to that used in many existing commercial [19] and government-developed systems [20]. Occurrences of keywords are detected and counted in TCP network sessions reconstructed from network tcpdump data. The total number of keywords is the score assigned to each session. This score is placed in the test-data list files. Thirty keywords were selected that are representative of those used in existing keyword-based intrusion detection systems. These include keywords that detect suspicious actions (e.g. “passwd”, “shadow”, “permission denied”, “+ +”) and keywords that detect well-known attacks (e.g. “from: |”, “login: guest”, “loadmodule”, “CWD ~ROOT”). Keywords in the baseline system were not tuned to detect attacks in the training data, but represented common keywords in use at the time of the evaluation.
8. Results
Results are first presented for all UNIX victim hosts and systems that detected all four attack categories. Results are then presented for the Solaris UNIX victim host and systems that used BSM host-based audit data only or that examined file system dumps nightly. Overall results across all attacks are then presented followed by further comparisons of results for old attacks in the training data and new attacks only in the test data and for clear and stealthy attacks
8.1 Results for Four Attack Categories
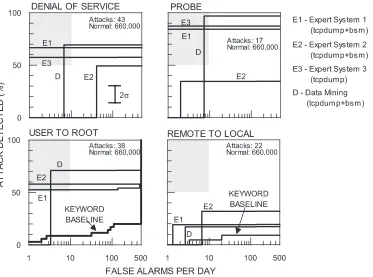
The majority of systems tested used either tcpdump network sniffing data alone or tcpdump data in combination with BSM audit data to detect attacks. ROCs for these systems are shown in Figure 4. Research groups responsible for systems are not explicitly identified in these or other figures, because the focus is on reviewing the state of the art and not on comparing individual systems. Information on the performance of individual systems is available in [13-18]. These ROCs plot the percentage correct attacks detected versus the number of false alarms per day produced by each system. ROCs look like non-varying straight lines when the false alarm rate is below 1 per day. ROCs are single steps or straight lines for most of the
systems in Figure 4 because many systems used rules and produced only a binary output that indicated whether an attack did or did not occur. The keyword system, however, produced a more continuous output and a multi-stepped ROC. The false-alarms-per-day axis is logarithmic. It ranges from 1 false alarm per day, which is a level easily handled by one system administrator, to 500 false alarms per day, which is an unacceptably high level that would require excessive time for validation. The maximum false alarm rate was roughly 66,000 per day. This is equal to the total number of normal network sessions divided by ten. Best performance is provided by curves that pass through the upper left shaded region which provide high detection accuracy with low false alarm rates. Curves in the shaded region correspond to systems that detect more than 50% of the attacks while producing fewer than 10 false alarms per day. Small differences in curves do not necessarily represent statistically significant differences between systems. Two standard deviations for these curves were determined by bootstrap sampling [21] to be 12 to 18 detection percentage points in detection accuracy.
[image:9.612.94.467.79.356.2]The upper left ROC in Figure 4 shows the results for the 43 denial of service attacks in the test data. The best system in this category detects only 65% of the attacks, but with very few false alarms. This relatively poor detection performance is σ
surprising for denial of service attacks which should be relatively easy to detect. The best systems missed new denial of service attacks that were not in the training data and also variants of old attacks in the training data. Almost all systems failed to detect the new process table, mailbomb, and UDP storm attacks and most systems also missed a variant of the old warez attack. Some of these attacks should have been relatively easy to detect. The process table attack opens up more than 100 simultaneous finger connections over a period of minutes, and the mailbomb attack sends roughly 10,000 identical mail messages to one user in a few seconds. The new UDP storm attack is visible in the outside sniffing data as only a single packet sent from the outside, but with a forged inside IP address. The warez attack in the test data was similar to that used in the training data, except the size of the files that were downloaded were smaller.
The upper right ROC in Figure 4 shows results for the 17 probe attacks that are in the test data. Performance is much better for the best systems. Two systems detect almost 90% of the probes with very few false alarms, and one system detects almost 97% of the probes while producing roughly eight false alarms per day. Systems performed well because the old probe attacks (ip sweep, nmap, and satan) were similar to the new probe attacks (saint and mscan) and because most probe attacks were easy to detect. They were directed against many IP addresses and/or ports (typically more than 100 ports or addresses) and happened over a short time interval. A small number of the port scans were made stealthy by scanning one port every 2.5 minutes, by randomizing the port order, and by using FIN scans instead of SYN scans. These scans were detected presumably because they still scanned many ports and all scan packets were sent from the same IP source. No extremely stealthy scans examining fewer than three ports from multiple IP sources over a long time span were used in this evaluation.
The bottom left ROC in Figure 4 shows results for the 38 user to root attacks that are in the test data. The two best systems detect roughly 60% to 70% of the attacks at false alarm rates below four per day. This performance still misses more than roughly 30% of the attacks, but it is much better than the performance of the baseline keyword-based system. This system detects fewer than 30% of the U2R attacks, even at a
false alarm rate of 500 false alarms per day. The poor performance of the keyword baseline system is consistent with results obtained by others with similar untuned keyword-based systems. The real-time evaluation described in [11] included a government-developed keyword system that was tested on less than a day of traffic. The false alarm rate of this system was more than 3,000 false alarms per day to detect roughly 5% of the approximately 30 attack instances. Experience with a commercial keyword-based system on many commercial sites also suggests that false alarm rates of thousands per day per site are required for good detection accuracy [22].
The bottom right ROC in Figure 4 shows results for the 22 remote to local attacks in the test data. All systems perform extremely poorly and the best detection rate is below 35% for this serious category of attacks where remote users obtain user or root privilege on the attacked machine. This poor performance is due to the widely varied range of attacks and to the many new attacks in this category. New R2L attacks include HTTP-tunnel, named, sendmail, snmp-get, xlock, and xsnoop which use different network services and different attack mechanisms. Http-tunnel is a covert channel that uses what looks like normal web browsing interactions to pass information and commands between a victim machine and an attacker machine using the HTTP network protocol. Named is a buffer overflow on a DNS name server achieved by sending a custom inverse-lookup query to a domain name server. Sendmail is a buffer overflow attack achieved by sending a custom mail message to a host running a vulnerable version of sendmail. Snmp-get involves obtaining information from the router illegally by using the simple network management protocol (SNMP) protocol. Xlock is a trojan password capturing screen lock program and xsnoop remotely captures keystrokes from a poorly configured host running the X window system. Systems missed almost all of these new attacks presumably because they were not similar to any of the attacks in the training data.
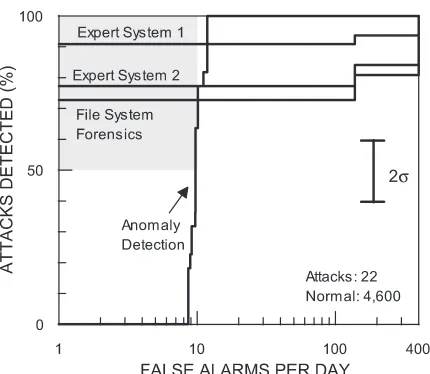
8.2 Host-Based Results for Solaris Victim
Four evaluated systems provided results using only BSM audit inputs. Two were expert systems, which also provided results with tcpdump data. A third was an anomaly detector that only was tested only using BSM data, and a fourth was a system that performed a nightly forensic analysis of Solaris file system dumps. The performance of these systems was compared for attacks launched against the Solaris victim, which
is the only operating system that supported auditing. Detection accuracy using BSM audit data is only presented for U2R attacks because there were too few Solaris attacks from the R2L category to perform a valid comparison and because little evidence for DoS and probe attacks is available in BSM audit records. For example, scans which don’t actually start TCP connections are not detectable in audit records because low-level TCP stack transitions related to reception of isolated SYN or RST packets do not generate audit records. Audit records are typically only generated from Internet connections after a TCP connection is established and inetd creates a new process to handle this connection. ROCs for the 22 user-to-root attacks against the Solaris host and the four systems that used BSM audit data or file system dumps are show in Figure 5. Detection accuracy is uniformly better with host-based BSM audit records than with network-based tcpdump data. Two expert systems that generated rules by hand using the training data detected 77% and 91% of all U2R attacks at low false alarm rates below one per day. The one system that used anomaly detection and only BSM audit records (labeled “anomaly detection” in Figure 5) detected all U2R attacks with only slightly more than 10 false alarms per day [18]. This system does not use hand-generated rules. It analyzes sequences of BSM audit records for specific UNIX system programs to identify anomalous behavior and uses training data to learn normal sequences. This system has a multi-step ROC that rises steeply in Figure 5. This stepped rise occurs because this system outputs a continuously varying score that increases as the sequence of audit records becomes more aberrant compared to normal training sequences. Results obtained with this one anomaly-based system suggest that anomaly detection approaches may provide slightly better detection than rule-based approaches with the expense of additional false alarms. The one system shown in Figure 5 that used only nightly file system dumps (labeled “file system forensics” in Figure 5)
[image:11.612.200.415.78.265.2]σ
provided reasonable performance with a detection rate above 70% correct while generating fewer than 1 false alarm per day. This system has the advantage that it could be applied to any Solaris host without turning on BSM auditing. It is somewhat surprising that it can perform so well by examining the contents of the host file system only once per day and suggests that high performance intrusion detection may not require custom auditing for some classes of attacks.
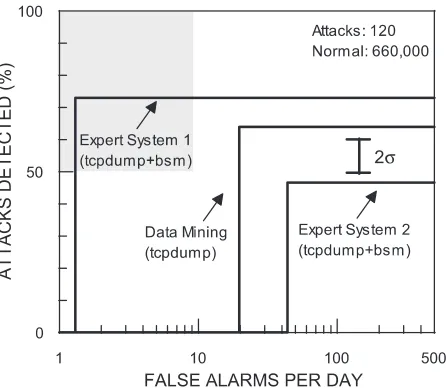
8.3 Overall Results
Three of the systems that processed tcpdump data or both tcpdump and BSM audit data were designed to detect all four categories of attacks. Figure 6 shows overall ROC curves for these systems for all attacks in the test data. The best system detects roughly 75% of the attacks in the test data with fewer than two false alarms per day. This expert system uses both tcpdump and BSM data with hand-created attack signatures generated using the training data. It uses highly tuned rules that output very few false alarms and detect almost all of the old attacks in the test data. It, however, misses many of the new attacks. The next-best system is able to detect 64% of the attacks with 20 false alarms per, even without BSM audit data. It uses rules learned using pattern classification or data mining approaches with hand-selected input features. The detection rate of this system is similar to that of the first expert system when the input to the expert system is tcpdump data alone. The third-best system is an expert system that uses both tcpdump and BSM data and hand-generated rules. It detects roughly 45% of the attacks at a false alarm rate of 46 false alarms per day. These results suggest that either learning systems (e.g. pattern classification or data mining) or expert systems (e.g. hand-generated rules) can provide good performance on
previously seen attacks. Neither approach, however, is capable of detecting new attacks with high accuracy.
8.4 Results with New, Novel, and Stealthy Attacks
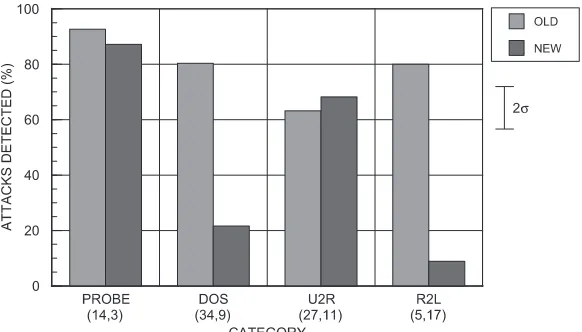
Many systems provided good detection accuracy for old attacks that were included in the training data, but poor detection accuracy for new attacks that were only in the test data. Figure 7 shows the difference in detection accuracy for these two types of attacks. This plot shows the average detection rate for the top two performing systems in each attack category from Figure 4 at a false alarm rate of 10 false alarms per day. The best performing systems detect old attacks with reasonable accuracies ranging from roughly 63% to 93% detections at 10 false alarms per day. Performance is much worse for new attacks. Detection accuracy for new attacks is below 25% for the R2L and DoS categories and not significantly different from performance with old attacks for the other two categories. This poor performance for new attacks in these two categories indicates that rules learned from the training data on old attacks do not generalize to the new attacks. Different approaches to intrusion detection may thus be required to obtain good performance on these new attacks. Performance with new attacks is not degraded for the probe and U2R categories because new attacks in these categories were not as different from old attacks as in the DoS and R2L categories. The new probe attacks used the same TCP/IP protocols and services as old probe attacks and did not include extreme approaches to stealthiness such as multiple IP sources, extremely slow scans, and scanning only two or three ports. The new U2R attacks used different mechanisms to obtain root-level privilege, but many of these attacks used the telnet service, included creation of an interactive root-level shell,
[image:12.612.178.401.81.275.2]σ
included similar approaches to encrypting attack scripts, and used similar buffer-overflow machine code.
Many new attacks were completely missed by all of the top three systems from Figure 4. All network connections for the following attacks were missed and labeled as normal traffic: mailbomb, process table, udp-storm, at, HTTP-tunnel, named, sendmail, snmpget, and xlock. This list includes all four novel attacks developed specifically for this evaluation and 5 of the 11 new or recent attacks that were not in the traning data. In general, systems didn’t detect attacks that differed substantially from attacks in the training data. Attacks were missed which used different TCP/IP services or different attack mechanisms than training attacks. Even a small variation in the attack (e.g. decreasing the size of the files downloaded in the Warez attack, or slowing down scans) sometimes made an attack undetectable for specific systems.
Stealthy techniques were used to make some of the U2R and probe attacks more difficult to detect. Attack scripts and outputs of U2R attacks were encrypted using the UNIX “uuencode” and “uudecode” commands and small custom C programs, attacks were distributed across multiple sessions, and the actual illegal action was delayed relative to the installation using the UNIX “at” command. Probes were spaced out over longer intervals (e.g. every 2.5 minutes) and used RST TCP/IP packets instead of SYN or other packet types. An analysis of all stealthy and normal probe and U2R attacks indicated that stealthy attacks were detected as well as normal attacks. There was no statistically significant difference between the average detection rate for stealthy and normal attacks at a false alarm rate of 10 false alarms per day. An analysis of individual attacks, however, shows that some of the stealthy U2R techniques were effective. None of the intrusion detection systems associated the delayed “at” attack with the original network session where this attack was installed. In
addition, stealthy encryption techniques used in the test data, but not in the training data were often effective in hiding attacks. Examples of approaches that were effective in hiding U2R attacks include using the UNIX “tr” command for encryption, using shell wildcards to hide commands, and issuing a unix “su” command to mask an illegal root shell. Performance on stealthy U2R attacks was high for three reasons. Examples of stealthy approaches were provided in the training data, many U2R attacks created interactive root shells which could be detected by the root prompt they exhibit, and some buffer overflow attacks issued a text message to indicate that a root shell was successfully created. Performance of stealthy probes was high because many test probes were similar to training probes and because the test data did not include extremely stealthy scans that come from multiple IP addresses against only two or three IP addresses or ports and that span many days or hours.
9. Summary and Future Work
Procedures, metrics, and a large corpus of normal traffic and attacks were developed that made it possible to successfullly evaluate eight widely different intrusion detection systems. The corpus included two months of background traffic generated using custom traffic generators that looked like 100’s of users on 1000’s of hosts. More than 300 instances of 38 different types of automated attacks were launched against three UNIX victim machines (SunOS, Solaris, and Linux). Seven weeks of training data with labeled attacks were provided for system development and then two weeks of unlabeled test data was used for a blind evaluation. Test data included novel new attacks developed specifically for this evaluation and recent new attacks not included in the training data. Results were analyzed by generating receiver operating characteristic curves (ROCs) to determine the attack detection rate as a function of
[image:13.612.158.449.81.247.2]σ
the false alarm rate for the previously unseen test data. Results were analyzed separately for user-to-root (U2R), remote-to-local (R2L), probe, and denial of service (DoS) attacks.
Best overall performance was provided by systems that used both tcpdump network data and BSM host-based audit data. These systems performed well for old attacks included in training data, but not for new attacks that were only in the test data. System developers made good use of the training data by creating hand-tuned rules or using learning approaches to generate rules that detect old attacks. Detection accuracy ranged from 63% to 93% correct for old attacks from four categories at a false alarm rate of 10 false alarms per day. Performance was much worse for attacks that were not included in the training data. Detection accuracy for new attacks was below 25% for the R2L and DoS categories where the new attacks were substantially different from the old attacks. All novel new attacks and roughly half of the new or recent attacks were completely missed by all of the top three systems. Many effective attack scenarios could be developed using the new and novel attacks that would not be detected by these research systems. These include attacks where remote users accomplish root-level actions by sending mail (sendmail), attacks where the attacker takes control of a router using SNMP (snmpget), and delayed time-bomb attacks (at). They also include covert channel attacks to exfiltrate simulated secret material off a protected host (HTTP-tunnel) and denial of service attacks where recovery requires a local reboot of the victim host (process table).
Systems that used host-based auditing performed well for U2R attacks against the single Sun Solaris host that provided BSM audit data. Performance of two rule-based systems was high (above 77% and 91% detection at 10 false alarms per day). A third anomaly-detection system detected all U2R attacks (100% detections) against the Solaris host using BSM audit data at a false alarm rate that was slightly above 10 false alarms per day. A fourth system, which examined the Solaris file system nightly, detected 73% of the U2R attacks with a false alarm rate below one false alarm per day and without any special auditing.
These results demonstrate that current research systems can reliably detect many existing attacks with low false alarm rates as long as examples of these attacks are available for training. All research systems could effectively use training data to improve detection performance and minimize false alarms for known attacks. Research systems, however, miss many dangerous new attacks, especially when the attack mechanism or TCP/IP services used differ from old attacks. These results, and the general success of the evaluation procedures, suggest two directions for further research. First, further research on intrusion detection should emphasize the need to develop
approaches that can detect new attacks with low false alarm rates. The promising performance of one system in this evaluation that examined file systems [17] suggests that systems should use more data sources than just audit data and network sniffer data. Poor performance on new attacks that used network services not used by attacks in the training data suggest systems should monitor all exploitable network services. Promising results with anomaly detection by one system [18] suggests that this approach as well as other approaches to detecting new attacks (e.g. specification-based approaches [4]) should be explored. Additional research is also required to develop systems that can detect old attacks and variants of these attacks because even old attacks were not detected perfectly. Systems should also provide more identification information instead of simply indicating where an attack occurs. The attack type, name, source, start time, and a list of all connections that were part of the attack would be useful information that could be used to stop an attack in progress, prevent future attacks, and repair or contain damage.
A second direction for future work is to extend intrusion detection systems and the evaluation procedures to include attacks against Microsoft Windows/NT hosts and inside attacks. Windows/NT hosts are becoming popular at both government and commercial sites and inside attacks can be more effective and easier to hide than the outside attacks used in this initial evaluation. We are currently in the middle of a second 1999 evaluation that extends the 1998 evaluation by adding new Windows/NT victims and background traffic and inside attacks. The primary focus of this second evaluation is to determine performance with new attacks. New attacks included in this evaluation include newly developed attacks as well as stealthy variants of existing attacks designed to circumvent systems that participated in the first evaluation. Results of this second evaluation should be available early in 2000.
ACKNOWLEDGEMENTS
REFERENCES
1. M. Bishop, S. Cheung, et al., "The Threat from the Net", IEEE Spectrum, 38(8), 1997.
2. J. Mariani, “Evaluation”, In R.A. Cole, J. Mariani, H. Uszkoriet, A. Zaenen, and V. Zue (eds.), Survey of the State of the Art in Human Language Technology, Cambridge University Press, 1997.
3. N. Puketza, K. Zhang, M. Chung, B. Mukherjee, and R. A. Olsson, “A methodology for testing intrusion detection systems,'' IEEE Transactions on Software Engineering, 22, 1996, pp. 719-729.
4. C. Ko, G. Fink, and K. Levitt, “Execution Monitoring of Security-critical Programs in Distributed Systems: A Specification-based Approach," in Proceedings of the 1997 IEEE Symposium on Security and Privacy, 1997, pp. 134-144.
5. G. Shipley, “ISS RealSecure Pushes Past Newer IDS Players”, Network Computing, 17 May 1999,
http://www.networkcomputing.com/1010/1010r1.html.
6. DARPA, The Information Survivability Program is described in http://www.darpa.mil/ito/research/is and the Information Assurance Program is described inhttp://www.darpa.mil/iso/ia/, Sept. 1999. 7. John A. Swets, “The Relative Operating Characteristic in Psychology”, Science, 182, 1973, pp. 990-1000.
8. James P. Egan, Signal detection theory and ROC-analysis, Academic Press, 1975.
9. A. Martin, G. Doddington, T. Kamm, M. Ordowski, and M. Przybocki, “The DET Curve in Assessment of Detection Task Performance”, in Proceedings EuroSpeech 4, 1998, pp. 1895-1898. 10. R. P. Lippmann, and David M. Shahian, “Coronary Artery Bypass Risk Prediction Using Neural Networks,” Annals of Thoracic Surgery, 63, 1997, pp. 1635-1643.
11. R. Durst, T. Champion, B. Witten, E. Miller and L. Spagnuolo, “Testing and evaluating computer intrusion detection systems”, Communications of the ACM, 42(7), 1999, pp. 53-61.
12. K. Kendall, “A Database of Computer Attacks for the Evaluation of Intrusion Detection Systems”, S.M. Thesis, MIT Department of Electrical Engineering and Computer Science, June 1999.
13. W. Lee, S.J. Stolfo, K. Mok, “Mining in a Data-flow Environment: Experience in Network Intrusion Detection”, in Proceedings 5th ACM SIGKDD International Conference on Knowledge Discovery & Data Mining (KDD '99), San Diego, CA, August 1999,http://www.cs.columbia.edu/~sal/JAM/PROJECT/. 14. G. Vigna and R. Kemmerer, "NetSTAT: A network-based intrusion detection approach”, in Proceedings of the 14th Annual Computer Security Applications Conference, Scottsdale, Arizona, December 1998, http://www.cs.ucsb.edu/~kemm/netstat.html/. 15. P. Neumann and P. Porras, “Experience with EMERALD to DATE”, in Proceedings 1st USENIX Workshop on Intrusion Detection and Network Monitoring, Santa Clara, California, April 1999, pp. 73-80, http://www.csl.sri.com/neumann/det99.html/.
16. R. Sekar and P. Uppuluri, “Synthesizing Fast Intrusion Prevention/Detection Systems from High-Level Specifications”, in Proceedings 8th Usenix Security Symposium, Washington DC, Aug. 1999, http://rcs-sgi.cs.iastate.edu/sekar/abs/usenixsec99.htm/. 17 . D. Moran, W. M. Tyson, “DERBI: Diagnosis, Explanation and Recovery from computer Break-Ins” project described in http://www.ai.sri.com/~derbi/, Sept. 1999.
18. A. K. Ghosh, A. Schwatzbard and M. Shatz, “Learning Program Behavior Profiles for Intrusion Detection”, in Proceedings 1st USENIX Workshop on Intrusion Detection and Network Monitoring, Santa Clara, California, April 1999, http://www.rstcorp.com/~anup/. 19. Cisco Systems, Inc., "NetRanger Intrusion Detection System Technical Overview”,http://www.cisco.com/warp/public/778/security/ netranger/ntran_tc.htm/, Sept. 1999.
20. Lawrence Livermore National Laboratory, "Network Intrusion Detector (NID) Overview," Computer Security Technology Center, http://ciac.llnl.gov/cstc/nid/intro.html/, Sept. 1999.
21. B. Efron and R. J. Tibshirani, Introduction to the Bootstrap, Chapman & Hall, 1993.
22. S. Manganaris, M. Christensen, D. Serkle, and K. Hermix, “A Data Mining Analysis of RTID Alarms,” in Proceedings of the 2nd International Workshop on Recent Advances in Intrusion Detection (RAID 99), West Lafayette, Indiana, Sept 1999.