Carbon balance as a mechanism for shade intolerance in American Sweetgum INTRODUCTION
Shade tolerance—the ability of a plant to persist in low light—affects forest community dynamics, and may drive succession from herbaceous to forest communities (Loach 1967). Considering how plants acquire and lose carbon may help explain survival in low resource environments like shade (Valladares & Niinemets 2008). To survive and grow, all plants must maintain a positive carbon balance, gaining more carbon through photosynthesis than they lose through respiration and tissue loss. Thus, plants must avoid or manage both low carbon gain due to light limitation, and high carbon loss due to loss of tissue and high respiration rates (Walters & Reich 1999). Plants can maximize net carbon gain by allocating resources preferentially to growth or to defense. Plants can also store resources belowground as carbohydrates, drawing on these reserves to maintain positive carbon balance and increase tolerance of carbon loss (Kobe 1997). When light availability limits carbon gain, high growth rate may not increase carbon capture enough to compensate for high carbon loss due to respiration—which increases with growth rate—and carbon loss due to disease and herbivory. Furthermore, each unit of allocated resources constitutes a greater fraction of total allocation when resources availability is low than when it is high. Therefore, when resources are limited, like light is in the shade, plants of a given species should allocate more resources to defend the tissue they have and store resources to regrow lost tissue in order to keep carbon balance positive (Reich 2014). Shade tolerance may thus measure not only a plant’s ability to deal with light-limited carbon gain, but also its ability to cope with carbon loss.
Persistence in low light can be influenced by other abiotic and biotic conditions, including levels of soil resources and natural enemies (Coley et al. 1985). Specifically, soil nutrients are required to make leaves and defensive compounds, thereby constraining patterns of resource allocation among different tissues and functions. Among soil nutrients, nitrogen
promotes carbon gain because it is necessary to build photosynthetic machinery and is often a limiting nutrient in temperate systems (LeBauer & Treseder 2008). Natural enemies, on the other hand, damage or remove tissue. Damage to leaves, in particular, can reduce shade tolerance in two ways: inhibiting carbon gain due to reduced photosynthesis, and increasing carbon loss due to lost tissue and upregulation of defense pathways. Moreover, maintaining a positive carbon balance is most precarious for seedlings, whose small size and lack of stored carbon leave them highly vulnerable to nutrient limitation and enemy damage in the light-limited environments they typically encounter (Imaji & Seiwa 2010).
Within a species, plants can manage light limitation in three ways that may also depend on nitrogen availability and foliar damage: preferentially allocating resources, tolerating damage, and resisting damage. First, plants can maximize growth by producing tissue to acquire limiting resources. Investment in leaves and stems increases light capture, while investment in roots increases soil nutrient capture. Thus, when light limits growth, typically in low light or high nutrient environments, plants should grow proportionately more leaves and stems; whereas when light is less limiting to growth, typically in high light environments, plants should grow
proportionately more roots. Second, plants can tolerate damage by reallocating their
belowground carbon stores to compensate for aboveground tissue loss (Kobe 1997). Because longer-lived leaves can accumulate more damage, high leaf turnover should promote a net decline in foliar damage. Third, plants can resist damage by producing defense compounds, and they may have more energy to synthesize these compounds in high light environments (Imaji &
Seiwa 2010). Therefore, high light and high nitrogen availability should increase both resistance to and tolerance of damage.By contrast, low light and high nitrogen availability may reduce resistance to damage. In this environment, plants may take up nitrogen without being able to convert it to defense compounds or have it contribute to growth, leaving older, nitrogen-flooded and poorly defended leaves more susceptible to fungal enemies (Stamp 2003).
For seedlings, which are not yet reproductive, biomass production may most accurately reflect performance because it quantifies net long-term carbon gain and affects later reproductive success (Imaji & Seiwa 2010). Both light and soil nitrogen can promote carbon gain; light increases carbon gain directly, and nitrogen does so indirectly by stimulating chlorophyll construction. Thus, increased nitrogen availability should increase biomass more when light availability is high. Enemy damage, by contributing to tissue loss, should reduce biomass. This reduction should be greater in the shade because seedlings will be less able to invest in defense or compensate for damage when carbon gain is limited (Price 1991).
Shade intolerant species may respond strongly to changes in light availability,
particularly if other abiotic and biotic conditions change. Conversely, these same abiotic and biotic factors may promote weaker responses in shade tolerant species. Indeed, shade intolerant species generally have higher photosynthetic capacities than shade tolerant ones regardless of light availability (Valladares & Niinemets 2008), indicating that their inability to persist is due to other factors. Thus, shade intolerant species may be ideal for testing whether abiotic and biotic factors can influence a species’ ability to persist in the shade. In this study, I manipulated light, nitrogen, and enemy pressure to examine the three mechanisms through which seedlings of a shade intolerant tree species may maintain a positive carbon balance. I asked the following questions:
1) How do light and nitrogen availability and enemy pressure affect total plant biomass? 2) How do light and nitrogen availability affect allocation to above- and belowground
biomass?
3) How do light and nitrogen availability affect reallocation of belowground biomass, and does this reallocation affect tolerance of damage?
4) How do light and nitrogen availability affect resistance to damage? METHODS
Study system
Liquidambar styraciflua, or American sweetgum, is a shade intolerant, early successional deciduous tree and a key transitional species during succession, competing well in early
successional systems but becoming less common when its seedlings are shaded out as succession proceeds (Addington et al. 2015). Sweetgum is common throughout the Southeastern US, where it is infected by the foliar fungal pathogen, Pseudocercospora liquidambaricola, which may reduce carbon gain by reducing leaf longevity and may increase carbon loss by upregulating defense pathways (Gommers et al. 2013). Its ecological prominence, shade intolerance, and abundant fungal enemy make sweetgum well-suited for studying shade tolerance.
We performed this study in an old field and adjacent forest in the North Carolina Piedmont (Duke Forest, Orange Co., NC). Since 1996, annual mowing has maintained herbaceous dominance of the old field. Sweetgum occurs throughout the field, primarily as seedlings, and becomes larger and more abundant toward the forest edge. This 40 year-old forest is dominated by early-successional trees such as loblolly pine (Pinus taeda), tulip poplar
(Liriodendron tulipifera) and American sweetgum. Later successional species like Acer rubrum and Quercus spp. also occur throughout the forest.
Experimental manipulations
We grew seeds purchased from Sheffield’s Seed Co. (Locke, NY) in flats in the greenhouse at the University of North Carolina at Chapel Hill for 10 days, then transplanted individual seedlings into 3 qt pots filled with 3:1 mix of potting medium (Fafard 3B; Sun Gro) and sterilized sand. To ensure that soil nutrients besides nitrogen would not limit seedling
growth, I added to the potting medium 10 g P m-2 as triple super phosphate, and 10 g K m-2 yr-1 as
potassium sulfate, and 100 g m-2 micronutrients (Scotts Micromax, Marysville, OH), which
corresponded to 1 g triple super phosphate plant-1, 0.45 g potash plant-1, and 2.0 g micronutrients
plant-1.
We conducted the study from July through mid-October 2014 using a split-plot design. I manipulated light availability at the whole plot level, and nitrogen availability and enemy damage at the subplot level.
At the whole plot level, I randomly assigned seedlings to levels of light (high, low, or a position along a light transect). In the high light treatment, I placed seedlings in the open field. In the low light treatment, I placed seedlings under the forest canopy. Each light transect ran between the high light treatment and the low light treatment, with seedlings at one of three points along the gradient from high to low light availability: ~10m from the forest edge, ~5m from the forest edge, or at the forest edge.
At the subplot level, seedlings were grouped into replicated 2×2 factorial manipulations of nitrogen (high or low) and enemy damage (high or low) treatments. Within each light treatment, replicates of the four nitrogen × enemy damage treatment combinations were spaced ~5m apart to avoid pseudoreplication (Hurlbert 1984) and surrounded with a wire cage to exclude deer. These treatments were replicated 10× in the high light treatment, 10× in the low light treatment, and 4× at each of the 3 light levels along the light transect for a total of 128 subplots within 32 whole plots (Fig. 1).
To quantify differences in light availability between light treatments, in early October I attached one Onset HOBO pendant light loggers (Onset Computer Corporation, Bourne, MA) to each replicate. The loggers measured and recorded light availability every 5 minutes for 10 days.
Seedlings in each nitrogen treatment received five applications of aqueous ammonium nitrate solution (NH4+NO3-) over the course of ten weeks, from July 24, before being moved to
the field, to September 18, four weeks before harvest. Seedlings in the high nitrogen treatment received 2 g N m-2 application-1 (10 g N m-2 total), which corresponded to 92 mg NH
4+NO3- plant -1 application-1, and seedlings in the low nitrogen treatment received 0.2 g N m-2 application-1 (1 g
m-2 total), which corresponded to 9.2 mg NH
4+NO3- plant-1 application-1. Seedlings in the low
enemy damage treatment were sprayed biweekly with a foliar fungicide for the duration of the field study, Mancozeb (Dithane DF, Dow AgroSciences, Indianapolis, IN), while seedlings in the high damage treatment were left unsprayed.
Plants did not show visual signs of fungal infection until their second month in the field, and mean damage was < 10% leaf area for all treatments. Therefore, to exacerbate carbon loss in the high damage treatment, I removed half of each leaf by clipping on October 3, 2014—two weeks before seedling harvest. Although this treatment prevented me from determining effects of fungal damage on seedling biomass directly, it allowed me to detect any interactive effects of
enemy damage, nitrogen, and light availability on seedling performance, which may not have been apparent given the low levels of fungal damage in the field.
Measurements
In this study, I measured height, foliar damage and seedling leaf, stem, and root biomass. To determine whether light or nitrogen availability influence foliar damage by pathogens, I visually quantified damage (Mitchell et al. 2002, Mitchell et al. 2003) for five leaves on each seedling on October 3, 2014, prior to the clipping treatment. I quantified damage to the youngest and oldest leaves as well as three leaves evenly spaced in age (e.g. on a seedling with 10 leaves, I selected leaves 1,3,6,8, and 10). For seedlings with five or fewer leaves, I measured damage on every leaf.
To determine whether resource availability and enemy pressure influence tolerance to carbon loss and biomass allocation strategies, I harvested seedlings in mid-October and separated their biomasses into three categories: leaves, stems, and roots. Roots were washed to remove soil. All biomass, including clipped biomass, was then dried at 60°C for at least 72 hours and weighed. Biomass was my main response for determining effects of the light, nitrogen, and enemy treatments on tolerance to carbon loss and biomass allocation strategies. In addition, to determine how these treatments affected seedling size over the duration of the experiment, I measured seedling height from the base of the stem through the end of the petiole of the highest leaf. This measurement reflects the highest point at which the seedling can photosynthesize. I measured height biweekly from one week after placing seedlings in the field until seedling harvest (6 observations).
Fungicide Experiment
To ensure that fungicide application had no direct effect on seedling biomass, I conducted a greenhouse experiment in the absence of fungal pathogens. The experiment took place in the UNC greenhouse and ran from September through mid-December 2014. All seedlings in this greenhouse study were handled similarly to the seedlings in the field experiment, except that all seedlings in the greenhouse study received the high nitrogen treatment—10 g N m-2 via five
aqueous applications over ten weeks (92 mg NH4+NO3- plant-1 application-1). I applied fungicide
biweekly to half the seedlings, and left the other half untreated. I estimated foliar damage from enemies to be zero for all seedlings, and therefore any differences in biomass could be attributed to direct effects of the fungicide treatment. In mid-December, I harvested and weighed biomass in a procedure identical to the one described for the field study. The greenhouse fungicide experiment indicated that the fungicide treatment itself did not significantly influence total biomass (P = 0.19), or root biomass (P = 0.17).
Data Analysis
We analyzed these data with linear mixed effects models in the nlme package (Pinheiro et al. 2014) in R version 3.0.3 (R Foundation for Statistical Computing, Vienna 2008). Light was a categorical whole plot effect, while nitrogen and enemy treatments were categorical subplot effects. Because both maximal and total daily light availability in transect subplots were similar to high light subplots (Fig. 2), and because there were no significant differences in biomass or height between the transect and high light treatments, I combined transect subplots with high light subplots for all analyses. I performed two sets of analyses on foliar fungal damage. To assess the efficacy of the fungicide treatment in reducing foliar damage, I included light,
nitrogen, and enemy treatments as predictors. To assess the effects of resource availability (light and nitrogen) on foliar fungal damage, I only included plants that had not been sprayed with fungicide. Therefore, the analyses of damage that are presented in the Results focused only on unsprayed seedlings. Light and nitrogen availability jointly altered how visual fungal damage responded to the spraying treatment (Light × Nitrogen × Spraying, P = 0.03). In high light, fungal damage was unaffected by spraying or nitrogen treatment. In low light, fungal damage was near zero for all sprayed plants in both nitrogen treatments (Tukey HSD: P = 0.48), but for unsprayed plants fungal damage was 3× greater for plants in the high nitrogen treatment than the low nitrogen treatment (Tukey HSD: P = 0.04).
For my analyses of total biomass and aboveground proportion—the ratio of aboveground biomass to total biomass, my measurement of allocation patterning—I added clipped leaf mass to the harvested leaf mass. For my analysis of belowground reallocation, I took root biomass as my measure. Because the clipping treatment obscures interpretation of differences in aboveground biomass, I also used root biomass for my measures of tolerance. Further, because tolerance is typically measured by examining interactions between resource availability and damage level, this measurement is sensitive to discrepancies between the type of scale used (additive versus multiplicative). To account for this, I measured foliar damage on a multiplicative scale (proportion of leaf area damaged) and converted my performance metric (root biomass) to a multiplicative (natural log transformed) scale when calculating tolerance (Wise & Carr 2008). Tolerance, therefore, is calculated as the interaction between nitrogen and damage treatments, and the interaction between the light and damage treatments, using the log-transformed root biomass (Wise and Abrahamson 2005, 2007).
In order to meet the normality assumption for linear models, the response variables of foliar fungal damage, height, and all biomasses were cube-root transformed; root biomass for the tolerance analysis was natural log transformed; and LMA was log10 transformed. To reduce
heteroscedasticity of variances in all biomass analyses, I used the varIdent function in ‘lme’ to allow variances to differ between light treatments (Zuur et al. 2009). Similarly, in the plant height analysis, I used the varFixed function to allow variance to increase over time and accounted for temporal autocorrelation in seedling height across measurements with an auto-regressive correlation structure of order 1 (AR1).
RESULTS
How do light and nitrogen availability and enemy pressure affect total plant biomass?
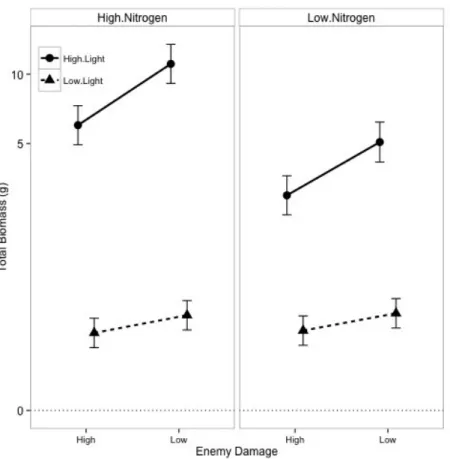
Total biomass, the sum of leaf, stem and root biomass, was 20× larger in high light than in low light (Light, P < 0.0001; Table 1; Fig. 3). Light availability also altered the response of plant biomass to nitrogen (Light × Nitrogen, P < 0.0001). The high nitrogen treatment doubled biomass in high light (Tukey HSD: P < 0.0001), but had no effect on biomass in low light (Tukey HSD: P = 0.91). Light also altered the response of biomass to damage treatment (Light × Damage, P = 0.0079). In high light, plants in the low damage treatment were twice as large as those in high damage (Tukey HSD: P < 0.0001); in low light, however, plants in the low damage treatment were not significantly bigger (Tukey HSD: P = 0.13). Overall, biomass increased with light availability; high nitrogen increased biomass more in high light, when nitrogen was more limiting to growth than light; and the damage treatment decreased biomass more in high light. How do light and nitrogen availability affect allocation to above- and belowground biomass?
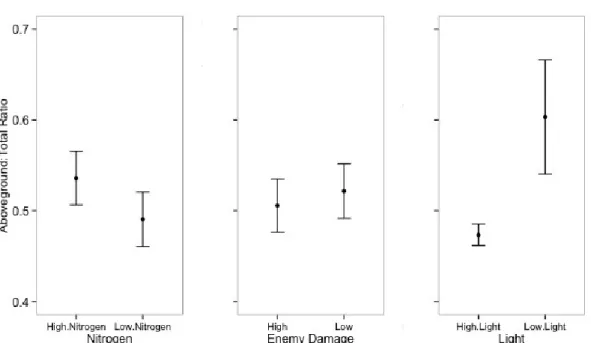
Aboveground proportion (ratio of aboveground to total biomass), which primarily
represents resource allocation to light capture as opposed to nitrogen capture or carbon storage, was higher for seedlings in the low light and high nitrogen treatments. Plants in low light allocated 28% more biomass aboveground than plants in high light (Light, P = 0.0004; Table 2; Fig. 4). Plants in high nitrogen pots allocated 10% more biomass aboveground than in low nitrogen pots (Nitrogen, P = 0.0003). Aboveground proportion did not differ between damage treatments (Damage, P = 0.33). To summarize, plants allocated proportionally more resources to aboveground biomass in low light and high nitrogen treatments, where light is expected to be the most limiting resource.
How do light and nitrogen availability affect reallocation of belowground biomass, and does this reallocation affect tolerance of damage?
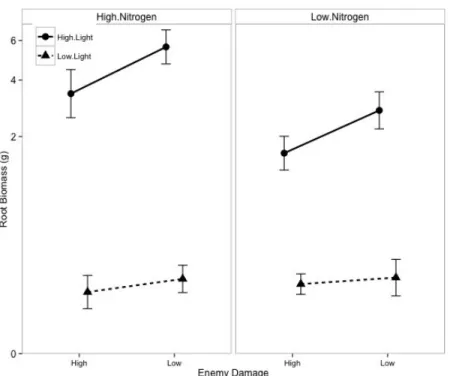
Root biomass was lower in the high damage treatment than in the low damage treatment (Enemies, P < 0.0001; Table 3, Fig. 5). Furthermore, light availability altered the response of root biomass to damage (Light × Damage, P = 0.0044). In high light, the high damage treatment reduced root biomass by over 40% (Tukey HSD: P < 0.0001), but had no effect on biomass in low light (Tukey HSD: P = 0.18). Light availability also altered the response to nitrogen (Light × Nitrogen, P < 0.0001). In high light, the high nitrogen treatment increased root biomass (Tukey HSD: P < 0.0001), but had no effect on biomass in low light (Tukey HSD: P = 0.22).
Tolerance of foliar damage was unaffected by light and nitrogen availability (Light × Damage, P = 0.67; Nitrogen × Damage, P = 0.55; Table 4; Fig. 6). This indicates that plants were equally tolerant of leaf loss—foliar fungal damage compounded by 50% leaf clipping— with varying light and nitrogen availability.
How do light and nitrogen availability affect resistance to damage?
Light availability altered the effect of nitrogen on fungal damage (Nitrogen × Light, P = 0.0104; Table 5; Fig. 7). In high light, damage did not differ between nitrogen treatments (Tukey HSD: P = 0.078). In low light, however, damage to high nitrogen plants was over 3× that of damage for low nitrogen plants (Tukey HSD: P = 0.039).
D
ISCUSSIONLight, nitrogen and enemies additively and interactively influenced several aspects of seedling performance. Seedlings were larger when light and nitrogen availability were high and damage was low; and seedling biomass responded more strongly to increased nitrogen and enemy damage at high light levels. Similarly, light and nitrogen availability influenced the way seedlings allocated resources: plants allocated a greater proportion of biomass to aboveground tissue in low light and high nitrogen treatments. In high but not low light, damage influenced the degree to which seedlings reallocated belowground biomass. Although light and nitrogen
availability interacted to affect resistance to fungal damage, tolerance of damage was unaffected by either resource.
Increasing both light and nitrogen availability considerably increased biomass, a key measure of seedling performance. Neither the nitrogen nor enemy treatment affected seedling biomass in low light, but in high light, nitrogen increased biomass and damage decreased biomass. This indicates that light was more limiting than nitrogen to growth in the understory, but that nitrogen was more limiting than light in the open field.
In the high light treatment, plants experiencing high damage had lower total biomass than plants experiencing low damage. Because clipped leaf mass was added back in, differences in
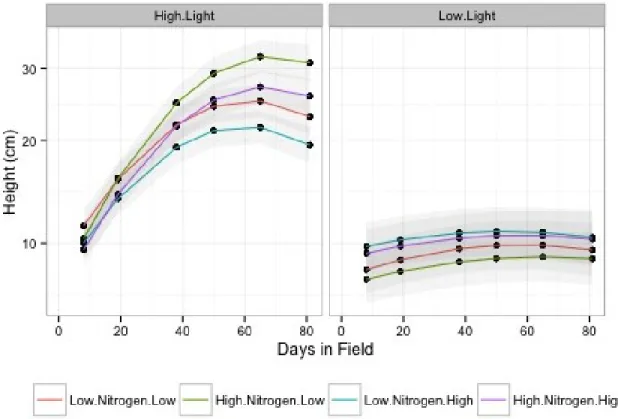
biomass between damage treatments is due either to tissue lost to fungal pathogens or to reduced carbon gain resulting from pathogen infection and leaf clipping. Although spraying did not significantly reduce fungal damage in high light, sprayed plants in grew taller than unsprayed plants (Damage × Time, P = < 0.0001); Table 6; Fig. 8), suggesting that fungicide reduced the deleterious effects of enemies on plants, even though these effects were not detected in the damage survey. Thus, fungicide may have increased plant performance without significantly reducing visual damage. Further, visual damage symptoms include both the actual effect of the pathogen and the plant’s immune response to the pathogen. If leaf damage caused by pathogens had larger negative impacts on plant growth than damage caused by plant immune responses, then visual damage symptoms may not correspond one-to-one to impacts on fitness (Aldea et al. 2006).
Damage may not have reduced biomass in low light because seedling growth was
severely light-limited regardless of damage treatment. Seedlings in low light may resist shedding their leaves, even when damaged, because abscission would lead to a greater carbon loss than pathogen damage (Fernandez et al. 1999). Therefore, damage may have reduced biomass more when light and nitrogen availability was high because of multiplicative effects: damage to plants in higher light and nitrogen environments constitutes a greater loss of productivity than damage where either resource is limiting.
Additionally, when interpreting resource effects, it may be inappropriate to look only at proportional differences. The difference in nitrogen availability between the low and high nitrogen treatments was an order of magnitude, while the difference in light availability between low and high light treatments was at least two orders of magnitude. Resource availabilities, in particular, should have multiplicative effects on biomass: growth begets growth, and larger investments in light- and nutrient-harvesting organs lead to greater future carbon returns. A doubling of biomass is a much greater gain for a very large plant than a very small one. On the other hand, halving biomass may leave a large plant still fairly well-off, but could be disastrous for a seedling struggling to maintain positive carbon balance.
Light and nitrogen influenced resource allocation among seedlings. Seedlings in low light and high nitrogen, where light is expected to limit growth, allocated a larger proportion of resources to aboveground biomass. In addition, seedlings in the open field seemed to allocate proportionally more resources for belowground stores, a luxury that low light seedlings may not have had. This could have been especially important because I harvested biomass in autumn, when deciduous trees increase carbon stores in preparation for large carbon expenditures the following spring. If seedlings in low light use carbon stores to compensate for immediate damage rather than overwinter survival (Piper et al. 2015), it could reduce longer-term survival and reproduction in ways that cannot be captured in a single-season study.
Seedlings in high nitrogen pots may have allocated a greater proportion of their biomass aboveground because nitrogen was less limiting to growth. Thus, they could allocate resources toward capturing light, a resource that may have been more limiting to growth (Walters & Reich 1999). In contrast, increasing nitrogen availability did not increase total biomass in low light. Instead, light availability alone determined resource allocation patterns.
Interestingly, aboveground proportion did not differ between damage treatments. This may be partly because clipping occurred late in the growing season, and therefore neither clipped nor unclipped plants were growing rapidly (Piper et al. 2015). However, absolute root biomass was significantly lower in the high damage treatment, suggesting that plants reallocated
belowground carbon stores to compensate for aboveground damage. Part of the differences in
belowground biomass may be due to reduced carbon acquisition and storage in the high damage treatment, but the high damage treatment reduced root biomass even more than it reduced aboveground biomass, both proportionally and in absolute terms. It is difficult to determine whether this is due to belowground reallocation or from lower belowground carbon gain, but either mechanism has the same effect: plant roots take the hit so that aboveground biomass is not lost.
Seedling tolerance of carbon loss was unaffected by light or nitrogen availability. Tolerance may have been unaffected by resource availability because the clipping treatment occurred too close to biomass harvest to give plants adequate time to respond. Because I clipped all leaves in proportion to their size, the biomass loss for seedlings in the high resource
environments, where plants were considerably larger, was greater than biomass loss for their low resource counterparts. I clipped 23× more leaf mass in the high than the low light treatment, and 1.5× more leaf mass in the high than the low nitrogen treatment. Therefore, the similar tolerance between resource treatments may be due to proportionally similar clipping rather than similar responses to the treatment (Wise & Carr 2008).
Light and nitrogen interacted to affect resistance to fungal damage, where high nitrogen had no effect on pathogen damage in the sun but increased damage in the shade. Though inoculum load could have varied between light environments, it is unlikely that inoculum differences could be the sole cause of variation in damage, especially because the variation was mediated by nitrogen. Plants in the shade may have lacked energy to synthesize defense
compounds, leaving their nitrogen-rich leaves more susceptible to pathogen infection (Stamp 2003, Zhou et al. 2015).
My results underscore the influence of soil nutrients on enemy pressure across different stages of succession. In the high light environment typical of early successional stages, fungal damage did not change with nitrogen availability. But in the low light environment typical of later successional stages, fungal damage was higher in the high nitrogen treatment. This suggests that high nitrogen may reinforce the dominance of shade intolerant species in early stages of succession by contributing to growth without increasing damage, but may undermine
performance of shade intolerant species in later successional stages by increasing damage without increasing growth.
In conclusion, I found that nitrogen and damage jointly affect plant response to low light environments typical of later successional stages. However, light limitation in the forest
understory may be severe enough to overwhelm other environmental effects on performance. In the short term, seedlings exhibit a strong ability to compensate for low carbon gain and high carbon loss using carbon stores. This may be unsustainable in the long term, however, leaving plants less able to rapidly grow or regrow tissue and more vulnerable to future environmental stresses (Selaya et al. 2008).
REFERENCES
Addington R.N., Knapp B.O., Sorrell G.G., Elmore M.L., Wang G.G., Walker J.L. (2015). Factors affecting broadleaf woody vegetation in upland pine forests managed for longleaf pine restoration. For. Ecol. Man. 354: 130-138.
Aldea M., Hamilton J.G., Resti J.P., Zangerl A.R., Berenbaum M.R., Frank T.D., DeLucia E.H. (2006) Comparison of photosynthetic damage from arthropod herbivory and pathogen infection in understory hardwood saplings. Oecologia 149: 221 – 232.
Coley P.D., Bryant J.P., Chapin F.S. (1985) Resource availability and plant antiherbivore defense. Science 230: 895-899
Fernandes GW, Castro FMC, Marques ESA (1999) Leaflet abscission caused by a gall induced by Melaphis rhois (Aphididae) on Rhusglabra (Anarcadiaceae). Int J Ecol Environ Sci 25:63–69
Gommers C et al. 2013. Shade tolerance: when growing tall is not an option. Trends in Plant Sci., 18(2): 65-71.
Hurlbert, S.H. (1984) Pseudoreplication and the design of ecological field experiments. Ecological Monographs 54(2): 187-211.
Kobe R.K. (1997) Carbohydrate allocation to storage as a basis of interspecific variation in sapling survivorship and growth. Oikos 80(2): 226-233
Imaji A,. Seiwa K. (2010) Carbon allocation to defense, storage, and growth in seedlings of two temperate broad-leaved tree species. Oecologia 162: 273-281
LeBauer, D.S., Treseder, K.K. (2008) Nitrogen limitation of net primary productivity in terrestrial ecosystems is globally distributed. Ecology 89: 371–379
Loach K. (1967) Shade tolerance in tree seedling.s. New Phytol. 66: 607-621
Pérez-Harguindeguy, N. et al. (2013) New handbook for standardized measurement of plant functional traits worldwide. Aust. J. Bot. 61: 167-234.
Pinheiro, J., D. Bates, S. DebRoy, and D. Sarkar (2014) nlme: linear and nonlinear mixed effects models. R package version 3.1–117
Piper F.I., Gundale M.J., Fajardo A. (2015) Extreme defoliation reduces tree growth but not C and N storage ina winter-deciduous species. Ann. Bot. 115(7): 1093-1103
Price P.W. (1991) The plant vigor hypothesis and herbivore attack. Oikos 62(2): 244-251
Reich P.B. (2014) The world-wide ‘fast-slow’ plant economics spectrum: a traits manifesto. J. Ecol, 102: 275-301
Selaya NG et al. (2008)> Biomass allocation and leaf life span in relation to light interception by tropical forest plants during the first years of secondary succession. J. Ecol. 96: 1211-1221. Valladares F. and U. Niinemets. (2008) Shade tolerance, a key plant feature of complex nature
and consequences. Annu. Rev. Ecol. Evol. Syst., 39: 237-57.
Walters M.B., Reich P.B. (1999) Low-light carbon balance and shade tolerance in the seedlings of woody plants: do winter deciduous and broad-leaved evergreen species differ? New Phytol. 143: 143-154
Wise M.J., Abrahamson W.G. (2007) Effects of resource availability on tolerance of herbivory: a review and assessment of three opposing models. Am. Nat. 169(4): 443-454
Zhou S., Y. Lou, V. Tzin, G. Jander. (2015) Alteration of plant primary metabolism in response to insect herbivory. Plant Physiol. 169: 1488-1498.
Zuur A., Ieno E.N., Walker N., Saveliev A.A. & Smith G.M. (2009). Mixed effects models and extensions in ecology with R. Springer Science & Business Media.
Figure 1. Aerial view of experimental layout. Each square represents one of 32 whole plots, while the circles show the 2 × 2 factorial subplot manipulations of nitrogen and damage treatments. Distance between each whole plot within a light treatment is about 5m, distance between high light treatment and light transects is about 20m, distance between light transects and low light treatment is about 10m.
Figure 2. Mean light as measured by photon incidence for the high and low light treatments, as well as the three light levels along the light transects (T1: ~ 10 m from forest edge, T2: ~ 5 m from forest edge, T3: at forest edge). The high light, T1, and T2 treatments have nearly identical light levels; T3 a lower level of mean light, and the low light treatment has by far the lowest.
Figure 3. Effects of nitrogen fertilization, damage treatment, and light availability on total biomass, calculated using restricted maximum likelihood. Biomass was cubed-root
transformed. The left panel shows the high nitrogen treatment and the right panel shows the low nitrogen treatment. Dashed lines represent plants growing in low light and solid lines represent plants growing in high light. Error bars represent 95% confidence intervals.
Predictor numDF denDF F-value p-value
Intercept 1 88 2491.5041 <0.0001
Nitrogen 1 88 18.4208 <0.0001
Enemies 1 88 17.9663 <0.0001
Light 1 30 810.1205 <0.0001
Nitrogen:Enemies 1 88 0.0760 0.7834
Nitrogen:Light 1 88 34.3398 <0.0001
Enemies:Light 1 88 7.4005 0.0079
Nitrogen:Enemies:Ligh
t 1 88 0.0308 0.8611
Table 1. ANOVA of linear mixed effects model of total biomass as a response to nitrogen fertilization, damage treatment, and light availability, calculated using restricted maximum likelihood. Biomass was cubed-root transformed. Replicate cage was included as a random effect. Three plants that died before the end of the experiment were omitted from the analysis. Variances were allowed to vary by light treatment.
423 424 425 426 427 428 429 430
Figure 4. Effects of nitrogen fertilization and light availability on the ratio of aboveground biomass, calculated using restricted maximum likelihood. The left panel shows the two nitrogen treatments, the middle panel shows the two damage treatments, and the right panel shows the two light availabilities. Error bars represent 95% confidence intervals.
Predictor numDF denDF F-value p-value
Intercept 1 88 6631.297 <0.0001
Nitrogen 1 88 14.331 0.0003
Damage 1 88 0.955 0.3312
Light 1 30 15.837 0.0004
Nitrogen:Damage 1 88 0.027 0.8693
Nitrogen:Light 1 88 0.077 0.7816
Damage:Light 1 88 2.119 0.1490
Nitrogen:Damage:Light 1 88 0.973 0.3266
Table 2. ANOVA of linear mixed effects model of aboveground biomass ratio as a response to nitrogen fertilization, damage treatment, and light availability, calculated using restricted maximum likelihood. Replicate cage was included as a random effect. Three plants that died before the end of the experiment were omitted from the analysis. Variances were allowed to vary by light treatment.
437
438 439 440 441 442 443 444
Figure 5. Effects of nitrogen fertilization, damage treatment, and light availability on root biomass, calculated using restricted maximum likelihood. Biomass was cubed-root
transformed. The left panel shows the high nitrogen treatment and the right panel shows the low nitrogen treatment. Dashed lines represent plants growing in low light and solid lines represent plants growing in high light. Error bars represent 95% confidence intervals.
Predictor numDF denDF F-value p-value
Intercept 1 89 2163.7809 <0.0001
Nitrogen 1 89 29.8838 <0.0001
Damage 1 89 57.8951 <0.0001
Light 1 30 789.4261 <0.0001
Nitrogen:Damage 1 89 1.6237 0.2059
Nitrogen:Light 1 89 43.5445 <0.0001
Damage:Light 1 89 8.5413 0.0044
Nitrogen:Damage:Light 1 89 0.0126 0.9108
Table 3. ANOVA of linear mixed effects model of root biomass as a response to nitrogen fertilization, damage treatment, and light availability, calculated using restricted maximum likelihood. Biomass was cubed-root transformed. Replicate cage was included as a random effect. Three plants that died before the end of the experiment were omitted from the analysis. Variances were allowed to vary by light treatment.
452 453 454 455 456 457 458
Figure 6. Effects of nitrogen and light availability on tolerance, defined as the interaction between nitrogen and damage treatments, and the interaction between the light and damage treatments, calculated using restricted maximum likelihood. Significant interactions are shown as significant differences in slope. Biomass was log-transformed. The left panel shows the high nitrogen treatment and the right panel shows the low nitrogen treatment. Dashed lines represent plants growing in low light and solid lines represent plants growing in high light. Error bars represent 95% confidence intervals.
Predictor numDF denDF F-value p-value
Intercept 1 89 122.4469 <0.0001
Nitrogen 1 89 113.7545 <0.0001
Damage 1 89 59.9738 <0.0001
Light 1 30 419.6997 <0.0001
Nitrogen:Damage 1 89 0.3574 0.5515
Nitrogen:Light 1 89 10.3886 0.0018
Enemies:Light 1 89 0.1787 0.6735
Nitrogen:Damage:Light 1 89 1.0233 0.3145
Table 4. ANOVA of linear mixed effects model of tolerance as a response to nitrogen and light availability, defined as the interaction between nitrogen and damage treatments, and the interaction between the light and damage treatments, calculated using restricted maximum likelihood. Root biomass was log transformed. Replicate cage was included as a random effect. Three plants that died before the end of the experiment were omitted from the analysis. Variances were allowed to vary by light treatment.
466 467 468 469 470 471 472 473 474 475
Figure 7. Effects of nitrogen and light availability on mean foliar fungal damage for plants not sprayed with fungicide, calculated using restricted maximum likelihood. Fungal damage was cubed-root transformed. Dashed lines represent plants growing in low light and solid lines represent plants growing in high light. Error bars represent 95% confidence intervals.
Predictor numDF denDF F-value p-value
Intercept 1 206 237.44342 <0.0001
Nitrogen 1 28 0.08548 0.7722
Light 1 29 4.32135 0.0466
Nitrogen:Light 1 28 7.35330 0.0113
Table 5. ANOVA of linear mixed effects model of mean foliar fungal damage as a response to nitrogen and light availability for plants not sprayed with fungicide, calculated using
restricted maximum likelihood. Fungal damage was cubed-root transformed. Random effects of plant ID were nested within random effects of replicate cage. Leaves for which there was no data were omitted. Variances are allowed to vary by light treatment.
484 485 486 487 488 489 490
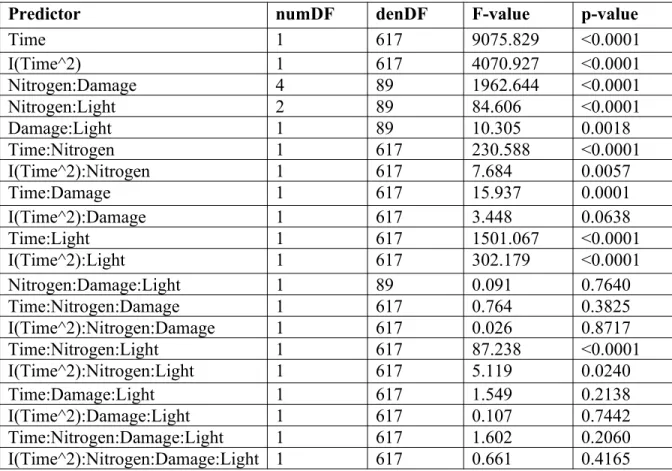
Figure 8. Effects of nitrogen fertilization, damage treatment, and light availability on plant height over time, calculated using restricted maximum likelihood. Height was cubed-root transformed. The left panel shows the high light treatment and the right panel shows the low light treatment. The orange line shows plants in the low nitrogen and low damage treatments, the green line shows plants in the high nitrogen and low damage treatments, the blue line shows plants in the low nitrogen and high damage treatments, and the purple line shows plants in the high nitrogen and high damage treatments. Shaded ribbons represent 95% confidence intervals. Decreases in height between days 65 and 81 are an artifact of the quadratic model.
Predictor numDF denDF F-value p-value
Time 1 617 9075.829 <0.0001
I(Time^2) 1 617 4070.927 <0.0001
Nitrogen:Damage 4 89 1962.644 <0.0001
Nitrogen:Light 2 89 84.606 <0.0001
Damage:Light 1 89 10.305 0.0018
Time:Nitrogen 1 617 230.588 <0.0001
I(Time^2):Nitrogen 1 617 7.684 0.0057
Time:Damage 1 617 15.937 0.0001
I(Time^2):Damage 1 617 3.448 0.0638
Time:Light 1 617 1501.067 <0.0001
I(Time^2):Light 1 617 302.179 <0.0001
Nitrogen:Damage:Light 1 89 0.091 0.7640
Time:Nitrogen:Damage 1 617 0.764 0.3825
I(Time^2):Nitrogen:Damage 1 617 0.026 0.8717
Time:Nitrogen:Light 1 617 87.238 <0.0001
I(Time^2):Nitrogen:Light 1 617 5.119 0.0240
Time:Damage:Light 1 617 1.549 0.2138
I(Time^2):Damage:Light 1 617 0.107 0.7442
Time:Nitrogen:Damage:Light 1 617 1.602 0.2060
I(Time^2):Nitrogen:Damage:Light 1 617 0.661 0.4165
Table 6. ANOVA of linear mixed effects model of height as a response to nitrogen fertilization, damage treatment, light availability, time, and a quadratic component of time2, calculated using
restricted maximum likelihood. Height was cubed-root transformed. Random effect of plant ID was nested within random effect of replicate cage. Observations for which there were no data or that occurred following leaf clipping were omitted from analyses. Variances were allowed to vary by time. An auto-regressive correlation structure of order 1 was used to adjust for temporal correlation.
526