Urban Institute
Written Testimony
of
Signe Mary McKernan
Senior Fellow, Urban institute
and
Caroline Ratcliffe
Senior Fellow, Urban Institute
For the Roundtable Panel Hearing
“Closing the Wealth Gap:
Empowering Minority-Owned Businesses to Reach Their Full Potential for
Growth and Job Creation”
before the
Senate Committee on Small Business and Entrepreneurship
Wednesday, September 18, 2013
Russell Senate Office Building Room 428A
This testimony was prepared by Signe-Mary McKernan and Caroline Ratcliffe. The views
expressed are those of the authors and should not be attributed to the Urban Institute, its
Urban Institute
Chair Landrieu, Ranking Member Risch, and members of the committee, we thank you for the
opportunity to testify about closing the racial wealth gap.
When it comes to economic gaps between whites and families of color in the United States, income
inequality tells only part of the story. Urban Institute research shows that the racial wealth gap is three
times larger than the racial income gap.
1This distinction is important because wealth is where economic
opportunity lies.
Wealth isn’t just money in the bank, it’s insurance against tough times, tuition to get a better education
and a better job, capital to build a small business, savings to retire on, and a springboard into the middle
class.
Urban Institute analyses of wealth accumulation over the life cycle show that the racial wealth gap
grows sharply with age. When people are in their 30s and 40s, whites have about 3.5 times more wealth
than people of color. By the time people reach their early to mid-60s—near their peak wealth-building
years—whites have about 7 times the wealth of people of color.
African American and Hispanic families are not on the same wealth-building path as white families. They
are less likely to own homes and retirement accounts, so they miss out on these traditionally powerful
wealth-building tools. African American and Hispanic families also start out behind. For example, they
are five times less likely to receive a large gift or inheritance than a white family.
2These are dollars that
can be used for important investments, such as higher education, down payment on a home, or to
invest in a small business.
Today’s skewed federal subsidies exacerbate the disparity in wealth holdings and the racial wealth gap.
The federal government spends billions of dollars annually to support wealth-building (via the mortgage
interest deduction and preferential tax treatment of retirement savings). Because these subsidies go
through the tax code, they primarily benefit high-income families, disproportionately leaving out African
Americans and Hispanics who have lower income.
Reforming wealth-building policies so they benefit all families, and helping families enroll in automatic
savings vehicles, will help improve wealth inequality and promote saving opportunities for all Americans.
Five specific suggestions to close the racial wealth gap are:
1.
Make homeownership tax subsidies more progressive
Homeownership has long been the primary saving mechanism for low- and middle-income
families and can be a stepping stone to the middle class. Low-income families generally miss out
on homeownership subsidies operating through the tax system. For example, more than 70
percent of the mortgage interest deduction benefits go to the top fifth of taxfilers (by income).
Low-income families are further disadvantaged if those subsidies raise housing prices, especially
in urban areas where land is scarce. A first-time homebuyers tax credit targeted to low-wealth
families and strategies to reduce barriers to homeownership would help reduce the wealth gap.
1 “Less Than Equal: Racial Disparities in Wealth Accumulation,” by Signe-Mary McKernan, Caroline Ratcliffe, Eugene
Steuerle, and Sisi Zhang, April 2013, available at http://www.urban.org/publications/412802.html.
2 “Do Financial Support and Inheritance Contribute to the Racial Wealth Gap?” by Signe-Mary McKernan, Caroline
Ratcliffe, Margaret Simms, and Sisi Zhang, September 2012, available at http://www.urban.org/publications/412644.html.
Urban Institute
2.
Promote retirement savings through automatic individual retirement accounts (IRAs) and
expand the Saver’s Credit
To help the nearly half of U.S. workers who do not have an employer-sponsored savings plan,
enact federal legislation to create automatic IRAs and expand the Saver’s Credit. Automatic IRAs
could particularly help low-wage workers save for retirement, as they are less likely than
higher-wage workers to have an employer-sponsored retirement plan.
With this program, employers
that do not offer a savings plan would use their payroll system to automatically deposit a
portion of employees’ earnings into an IRA. There is no cost to employers (beyond a small
administrative fee, which is usually covered by a credit). Any employee who did not want to
participate in the program would have to take steps to opt out. This is an important design
feature, as automatic enrollment in 401(k) programs has been found to substantially increase
401(k) participation. Coupling automatic IRAs with an expansion of the Saver’s Credit will help
boost incentives for low-income families to save for retirement and increase their stock of
assets available for retirement security.
3.
Reauthorize the Assets for Independence program
The Assets for Independence program, established by the Assets for Independence Act (1998), is
the largest source of funding for individual development accounts (IDAs) in the United States.
IDAs are personal savings accounts targeted at low-income households that encourage them to
save for specific investments (e.g., postsecondary educational advancement, a home, or a
business) by matching earned income deposits and providing other program supports. Research
finds that participating in an IDA program increases the likelihood an individual becomes a
homeowner, starts or expands a business, or pursues postsecondary education.
3Further, joint
Urban Institute research finds that foreclosure rates for IDA homebuyers were half to
one-third the rate for other low-income homeowners in the same communities.
44.
Increase access to high-quality education for low-wealth families
Wealth disparities are passed from generation to generation. Higher wealth families can buy
high-quality education by buying a home in a wealthy school district or sending their children to
private schools. Large gifts and inheritances play a further role in perpetuating the racial wealth
gap. As mentioned above, African American and Hispanic families are five times less likely to
receive a large gift or inheritance than a white family.
5These are dollars that can be used for
important investments, such as higher education, a home, or a small business. Public policies
that subsidize education, for example, could enable families without sources of large gifts to go
to college, boosting their earning capacity and, with it, their ability to accumulate wealth.
3 “Final Literature Review: Evaluation Design for the Next Phase Evaluation of the Assets for Independence
Program,” by Erica H. Zielewski, Caroline Ratcliffe, Signe-Mary McKernan, Lissa Johnson, and Michael Sherraden, May 2009, available at http://www.urban.org/publications/412439.html.
4 “Weathering the Storm: Have IDAs Helped Low-Income Homebuyers Avoid Foreclosure?” by Ida Racemacher,
Kasey Wiedrich, Signe-Mary McKernan, Caroline Ratcliffe, and Megan Gallagher, April 2010, available at http://www.urban.org/publications/412064.html.
5 “Do Financial Support and Inheritance Contribute to the Racial Wealth Gap?”
http://www.urban.org/publications/412644.html.
Urban Institute
5.
Improve access to micro and small business capital for low-wealth groups such as African
Americans and Hispanics
Self-employment can patch income shortfalls, improve earnings growth, and diversify a family’s
wealth base beyond homeownership and retirement assets. But access to capital is more
difficult for minorities, who are less likely to receive conventional small business loans or large
gifts from family members that could finance small businesses.
6Small business loans are
important for economic development, but because the definition of a small business is broad—
cutoff of 500 employees—the loans are less likely to reach families of color. Microbusinesses are
also important for self-sufficiency and wealth building.
7For more information:
Attached brief: “Less Than Equal: Racial Disparities in Wealth Accumulation” by Signe-Mary McKernan,
Caroline Ratcliffe, Eugene Steuerle, and Sisi Zhang, April 2013, also available
at
http://www.urban.org/publications/412802.html
“
The Racial Wealth Gap in America,”a three-minute whiteboard animation video, April 2013, available
at
http://www.urban.org/changing-wealth-americans/video/
“The Changing Wealth of Americans” on the Urban Institute web site,
http://www.urban.org/changing-wealth-americans/
“Asset Building for Today’s Stability and Tomorrow’s Security” by Signe-Mary McKernan and Caroline
Ratcliffe (
http://www.urban.org/url.cfm?ID=1001374
) and Asset Building and Low-Income Familes,
edited by Signe-Mary McKernan and Michael Sherraden
(
http://www.urban.org/books/assetbuilding/index.cfm)
6 “Competitive and Special Competative Opportunity Gap Analysis of the 7(a) and 504 Programs,” by Kenneth
Temkin, Brett Theodos, and Kerstin Gentsch, January 2008, available at
http://www.urban.org/publications/411596.html.
7 “Small Business and Microenterprise as an Opportunity- and Asset-Bulding Strategy,” by Signe-Mary McKernan
and Henry Chen, June 2005, available at http://www.urban.org/publications/311188.html.
P
olicymakers often focus on income and overlook wealth,1 but consider: the racial wealth gap is three times larger than the racial income gap. Such great wealth disparities help explain why many middle-income blacks and Hispanics haven’t seen much improvement in their rela-tive economic status and, in fact, are at greater risk of sliding backwards.How Have Wealth Inequality
and Income Inequality Changed
Over Time?
Wealth is not just for the wealthy. The poor can have wealth too—and that wealth can accrue over time or provide collateral for bor-rowing, giving families a way to move up and out of poverty. A home or a car can offer ben-efits far beyond their cash value. And even a small amount of savings can help families avoid falling into a vicious cycle of debt when a job loss or financial emergency hits.
Wealth disparities have worsened over the past 30years (figure 1). High-wealth families (the top 20percent by net worth) saw their average wealth increase by nearly 120percent between 1983and 2010, while middle-wealth
families saw their average wealth go up by only 13percent. The lowest-wealth families— those in the bottom 20 percent—saw their average wealth fall well below zero, meaning their average debts exceed their assets.
There is extraordinary wealth inequality between the races. In 2010, whites on average had six times the wealth of blacks and His-panics (figure 2). So for every $6.00 whites had in wealth, blacks and Hispanics had $1.00 (or average wealth of $632,000 versus $103,000).2
The income gap, by comparison, is much smaller. In 2010, the average income for whites was twice that of blacks and Hispanics ($89,000 versus $46,000), meaning that for every $2.00 whites earned, blacks and His-panics earned $1.00.
How have these two measures changed over time? Neither has improved, but while the income gap has stayed roughly the same, the wealth gap has grown. In 1983, the average wealth of whites was roughly five times that of black and Hispanics.
In inflation-adjusted 2010 dollars, as opposed to ratios, the gap is also growing—as would happen in any growing economy if the
ratios remained constant, much less moved farther apart. The average wealth of white families was $230,000higher than the average wealth of black and Hispanic families in 1983
(figure 3). By 2010, the average wealth of white families was over a half-million dollars higher than the average wealth of black and Hispanic families ($632,000 versus $98,000
and $110,000, respectively). If we look at the median family the wealth holdings are lower and the differences are smaller, but the trends are the same.3
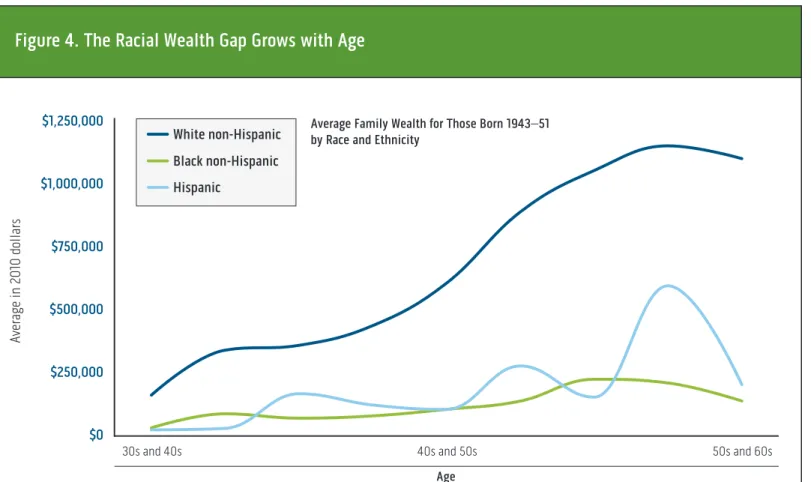
How Does the Racial Wealth Gap
Change Over the Life Cycle?
The racial wealth gap grows sharply with age. Early in wealth-building years (when adults are in their 30s), white families have 3.5to 4
times the wealth of families of color. Over the life cycle these initial racial differences grow in both absolute and relative terms.
Whites on average are on a higher accu-mulation curve than blacks or Hispanics. Whites age 32–40in 1983had an average fam-ily wealth of $184,000 (figure 4). In 2010, near their peak wealth-building years of age
59–67, average white family wealth had shot
www.urban.org
Less Than Equal: Racial Disparities
in Wealth Accumulation
When it comes to economic gaps between whites and communities of color in the United States, income inequality tells
part of the story. But let’s not forget about wealth. Wealth isn’t just money in the bank, it’s insurance against tough
times, tuition to get a better education and a better job, savings to retire on, and a springboard into the middle class.
In short, wealth translates into opportunity.
Signe-Mary McKernan, Caroline Ratcliffe, Eugene Steuerle, and Sisi Zhang
Less Than Equal: Racial Disparities in Wealth Accumulation
up to $1.1 million. In contrast, blacks age
32–40in 1983saw their average family wealth rise more slowly, from $54,000to $161,000by
2010. Meanwhile, average family wealth for Hispanics increased from $46,000in 1983to $226,000in 2010. In other words, whites in this cohort started with about three and a half times more wealth than blacks in their 30s but had seven times more wealth in their 60s. Compared with Hispanics, whites started with four times more wealth in their 30s but had nearly five times more wealth three decades later.4
Blacks especially, but also Hispanics, are not on the same compound growth path. Particularly important, these families of color are less likely to own homes and have retirement accounts than whites, so they miss out on the automatic behavioral com-ponent of these traditionally powerful wealth-building vehicles. In 2010, fewer than half of black and Hispanic families owned homes, while three-quarters of white fami-lies did.
How Did the Great Recession Affect
Wealth, and Who Lost the Most?
While the Great Recession didn’t cause the wealth disparities between whites and minori-ties, it did exacerbate them. The 2007–09
recession brought about sharp declines in the wealth of white, black, and Hispanic families alike, but Hispanics experienced the largest decline. Lower home values account for much of Hispanics’ wealth loss, while retirement accounts are where blacks were hit hardest.
Between 2007 and 2010, Hispanic fami-lies saw their wealth cut by over 40 percent,
$2,500,000
$2,000,000
$1,500,000
$1,000,000
$500,000
$0
-$500,000
1983 1986 1989 1992 1995 1998 2001 2004 2007 2010
Top wealth quintile Middle wealth quintile Bottom wealth quintile
Av
er
ag
e
w
ea
lth
in
2
01
0
do
lla
rs
Figure 1. Wealth Inequality among U.S. Families Is Increasing
Sources: Authors’ tabulations of the 1983, 1989, 1992, 1995, 1998, 2001, 2004, 2007, and 2010Survey of Consumer Finances (SCF). Notes: All values are presented in 2010dollars, and data are weighted using SCF weights. Shaded areas indicate recessions.
Less Than Equal: Racial Disparities in Wealth Accumulation
and black families saw their wealth fall by 31
percent (figure 5). By comparison, the wealth of white families fell by 11percent.
Like a lot of young families, many Hispanic families bought homes just before the recession. Because they started with higher debt-to-asset values, the sharp decline in housing prices meant an even sharper cut in Hispanics’ wealth.5As a result, they were also more likely to end up underwater or with negative home equity. Between 2007and 2010, Hispanics saw their home equity cut in half, compared with about a quarter for black and white families.
In contrast, black families lost the most in retirement assets, while white families experi-enced a slight increase. On average, blacks saw their retirement assets fall by 35percent during the Great Recession, compared with a smaller (but still substantial) decline of 18 per-cent for Hispanic families. This finding is
3.
White income to black/Hispanic income White wealth to black/Hispanic wealth
Ra
tio
1983 1989 1992 1995 1998 2001 2004 2007 2010 0
5
Figure 2. The Racial Wealth Gap Is Three Times Greater
Than the Racial Income Gap
Source: Authors’ tabulations of the 1983, 1989, 1992, 1995, 1998, 2001, 2004, 2007, and 2010 Survey of Consumer Finances (SCF).
Notes: Data are weighted using SCF weights.
Ratios for Average Family Wealth and Income, 1983–2010
Hispanic
Black non-Hispanic White non-Hispanic
Av
er
ag
e
in
2
01
0
do
lla
rs
1983 1989 1992 1995 1998 2001 2004 2007 2010
$0 $200,000 $400,000 $600,000 $800,000
Figure 3. The Racial Wealth Gap Is Not Improving
Source: Authors’ tabulations of the 1983, 1989, 1992, 1995, 1998, 2001, 2004, 2007, and 2010Survey of Consumer Finances (SCF). Notes: All values are presented in 2010dollars, and data are weighted using SCF weights.
Less Than Equal: Racial Disparities in Wealth Accumulation
consistent with research that suggests lower-income families are more likely to withdraw money from retirement savings after a job loss or other adverse event. The high rates of unemployment and other financial needs that took hold with the Great Recession appear to have led to larger declines in retirement savings for black families.
The stock market has essentially recovered since the recession. So, those families able to hold onto their retirement saving over longer periods (such as those who remain employed or have other assets to which they can turn) come out much better than those who sell when markets are low.
How Do We Fix This?
Families of color were disproportionately affected by the recession. However, the fact
that they were not on good wealth-building paths before this financial crisis calls into question whether a whole range of policies (from tax to safety net) have actually been helping minorities get ahead in the modern economy. More fundamentally, it raises the question of whether social welfare policies pay too little attention to wealth building and mobility relative to consumption and income.
Because Hispanics and blacks are dispro-portionately low income, their wealth build-ing is strongly affected by policies aimed at low-income families. Right now, safety net policies emphasize consumption: the Supple-mental Nutrition Assistance Program and Temporary Assistance for Needy Families, for example, try to ensure that families have enough food to eat and other basic necessities. Many safety net programs even discourage
saving: families can become ineligible if they have a few thousand dollars in savings. Wealth-building policies, on the other hand, are delivered as tax subsidies for homeowner-ship and retirement. Since families of color are less likely to be able to use these subsidies, they benefit little or not at all.
Most families save by paying off mort-gages through homeownership and accumu-lating wealth in compounding retirement accounts. The automatic component of these assets—a monthly mortgage payment, regular deposits from earnings to savings—facilitate wealth building. Both methods are threatened by some disturbing current trends. The Great Recession led many low-income individuals to fear homeownership even when it became much cheaper on net than renting. Mean-while mortgage credit has tightened—and
4. Age Av er ag e in 2 01 0 do lla rs
30s and 40s 40s and 50s 50s and 60s
$0 $250,000 $500,000 $750,000 $1,000,000 $1,250,000 Hispanic Black non-Hispanic White non-Hispanic
Figure 4. The Racial Wealth Gap Grows with Age
Source: Authors’ tabulations of the 1983, 1989, 1992, 1995, 1998, 2001, 2004, 2007, and 2010Survey of Consumer Finances (SCF). Notes: All values are presented in 2010dollars, and data are weighted using SCF weights.
Average Family Wealth for Those Born 1943–51 by Race and Ethnicity
Less Than Equal: Racial Disparities in Wealth Accumulation
might be further tightened with higher down payment rates—making credit most available in a bubble market and least in a bust market. For low-income families, especially families of color, this can exacerbate wealth inequality. Retirement savings, meanwhile, are threat-ened as a result of reduced employer contri-butions to pension plans and early employee withdrawals.
A common misconception is that poor or even low-income families cannot save. Research and evidence from savings programs shows they can. When we examined families
living below the poverty level, we found that over a decade more than 40percent were able to increase their net worth and save enough to escape asset poverty—in other words, they had enough assets to live at the poverty level for three months without income (about $3,000 for an individual and $6,000 for a family of four).
The federal government spends hundreds of billions of dollars each year to support long-term asset development. But these asset-building subsidies primarily benefit high-income families, while low-high-income families
receive next to nothing. Reforming policies like the mortgage interest tax deduction so it benefits all families, and helping families enroll in automatic savings vehicles, will help improve wealth inequality and promote sav-ing opportunities for all Americans.
•
5.
White non-Hispanic Black non-Hispanic Hispanic
-11%
-31%
-44%
-24%
-28%
-49%
9%
-35%
-18%
Wealth Home equity Retirement
Figure 5. Hispanics Lost the Most Wealth during the Great Recession, While Blacks Fared Worse than Whites
Source: Authors’ tabulations of the 2007and 2010Survey of Consumer Finances (SCF). Notes: Data are weighted using SCF weights.
Less Than Equal: Racial Disparities in Wealth Accumulation
Copyright © April 2013
The views expressed are those of the authors and do not necessarily reflect those of the Urban Institute, its trustees, or its funders. Permission is granted for reproduction of this document, with attribution to the Urban Institute. This research was funded by the Ford Foundation, the Russell Sage Foundation, and the Annie E. Casey Foundation.
URBAN INSTITUTE
2100 M Street, NW ● Washington, DC 20037-1231
(202) 833-7200 [email protected] ● www.urban.org
For more information:
www.urban.org/changing-wealth-americans/
Notes
1. Wealth is measured as total assets minus total liabilities/debt. Assets are the sum of financial assets (such as bank accounts, stocks, bonds, and 401ks/IRAs) and nonfinancial tangible assets (such as homes and real estate, businesses, and vehicles). Liabilities include both unsecured debt (such as credit card balances) and secured debt (such as mortgages and vehicle loans). 2. At the median the racial disparity is greater:
whites have eight times the wealth of black and Hispanic families.
3. The median wealth of white families was $80,000higher than the median wealth of black and Hispanic families in 1983($91,000 versus $11,000and $10,000, respectively). By 2010, the median wealth of white families was over $100,000higher than the median wealth of black and Hispanic families ($124,000versus $16,000and $15,000, respectively).
4. Population changes stemming from immigration could account for some of the wealth changes for Hispanics over time.
5. For example, if two households have homes worth $100,000, and one owes $70,000on the mortgage and the other owes $0, a 30percent fall in home values implies a 100percent drop in wealth for the first but only a 30percent drop for the second.