112
Application of semantic network visualization as
a managerial support instrument in financial
analyses
Helena Dudycz, Wrocław University of Economics, Poland, [email protected]
Abstract
Modern information technology (IT) managerial support systems often utilize visualization as a fundamental form of presenting information. In this context, however, users require easy access and rapid retrieval of not only information, but also knowledge stored by the system. The current trend in research is to identify new methods of graphical presentation that can be used to visualize knowledge. One of the most promising trends in this area is the exploration of the ontological approach to knowledge representation, and the associated semantic network visualization techniques. This paper presents selected aspects of the practical application of semantic network visualization in support of decision-making processes in the narrow context of financial indicators analysis, and in the light of both the rational and the behavioral approach.
Keywords: visualization, knowledge visualization, semantic network visualization, decision making.
Introduction
Contemporary business organizations are forced to operate under the constraints and pressures of the rapidly changing and highly volatile market, which adds to the uncertainty of their everyday activities. Under such conditions, company management can be seen as a future-oriented process
of making informed decisions. From a manager’s viewpoint, making decisions in business is
a process of identifying and selecting a course of action to solve a specific problem or to make good use of a business opportunity. Managers make their decisions under conditions of: (1) certainty, when accurate results or outcomes for each possible solution variant are readily available, (2) risk, when result can be approximated based on probability calculations, and (3) uncertainty, when the results or outcomes are largely unpredictable or unknown (Griffin,
2009). Conditions of decision making are affected by managers’ accumulated knowledge of both
the past and the conceivable occurrences as well as any factors or determinants that may affect the outcome of the adopted course of action. Managers make their decisions based on personal experience and knowledge made available to them on the specifics of the decision-making conditions both within their company and its environment. In the recent years, apart from the canonical rational approach to decision-making processes, professional literature on the subject
113
For over a decade, researchers have explored the effective use of visualization for the identification of information stored in various databases and repositories which can be used to form new knowledge (Dudycz, 2013). This trend is stimulated, among other things, by the results of studies on human perception which show that graphical presentation of data may largely facilitate or even warrant the identification and collection of pertinent information. The use of data visualization methods and techniques offers managers a prospect of identifying those problems which may not be readily observed using the standard analytical approach (Turban, Aronson, Liang, & Sharda, 2007). According to Chen (2006), the most important aspect of research on the use of visualization in management is the determination of effective methods for graphical presentation of information required in decision-making processes.
The conducted of research on the use of semantic network visualization in decision-making processes is focused on the following areas: 1) the use of ontology for the representation of business knowledge in information technology (IT) systems (Dudycz, 2013; Dudycz & Korczak 2016); (2) semantic network visualization as basis for good user-interface (UI) (Dudycz, 2015); (3) the use of ontological approach to construction of sectoral knowledge models stored in Business Intelligence systems (Korczak, Dudycz, & Dyczkowski, 2013); (4) exploration of the concept of an intelligent user interface, based (among other things) on ontological representations of knowledge in IT systems (Dudycz et al., 2016). The latter two aspects concentrate on the ontological approach to knowledge storing (including expert knowledge) in computer aided decision-making systems. This solution seems consistent with the rational approach to decision-making processes. However, practical studies on the use of interactive visualization methods, particularly the semantic network visualization, in decision making must invariably face the following question: what are the potential benefits of such methods in the context of the behavioral approach to decision-making processes?
This paper aims to present potential applications of semantic network visualization in management, in the context of both the rational and the behavioral approach. The first part provides rudimentary characteristics of both the rational and the behavioral approaches to decision making. This is followed by clarifications of differences between information visualization and knowledge visualization. The third section presents major directions of research on the use of visualization in the decision making processes. Section four presents a potential application of semantic network visualization in decision making, based on the example of financial indicators analysis.
Rational vs. Behavioral Approach to Decision
Making
114
available to decision-makers, the more likely it is for them to select the best possible variant of response to the problem at hand. Professional literature presents two general lines of approach to decision-making: rational vs. behavioral (Griffin, 2009); each based on its own set of premises and assumptions.
In their canonical form, the economic sciences are construed on the assumption that decisions are made based on rational considerations (Peterson, 2009). According to this theory, in order to make rational decisions, we must first determine whether the selection of the optimal variant of action will be made under conditions of uncertainty or risk. From the moment that we had managed to define rationality and its constituent elements or determinants, i.e. probability and utility, it was assumed that those parameters must be taken into account in the context of any decision made by the so-called economic man (homo œconomicus) (Fox, 2015). The rational approach is based on the assumption that managers are fairly capable of defining the problem at hand as well as identifying and weighing all the criteria that may affect their decisions, while taking into account both the objectives and the adopted values. The next step in this sequence is the determination of all possible variants of response, and selection of the best (optimal) solution (Meyer & Hutchinson, 2001). In brief, the rational approach is formed on the postulate that all decisions made by companies are based on insightful calculation and careful analysis of all the available variants of response or action.
The behavioral approach was construed on the basis of critical evaluations of the hypothesis on managerial rationality, based on numerous identified anomalies that seemed to contest the canonical approach (Craig & Tversky, 1995). Analyses of behavioral patterns displayed by managers have stimulated the need to formulate a real man (homo sapiens oeconomicus), model of decision-makers, as opposed to the classical economic man formula (Fox, 2015). The classical economics postulates that all human activities are based on rational premises. In the behavioral approach, on the other hand, it is assumed that managers are also influenced by other drives, pressures and emotions, such as: greed, impulsiveness, impatience, avarice, stress, exhaustion or fear (Kahneman, 2011). The most pronounced trend in the behavioral approach disputes is the search for new meanings for individual economic aspects which are – in this school – perceived as being strongly influenced by psychological and sociological factors that determine our choices (Barberis & Thaler, 2003; Shiller, 2005). The wealth of experimental evidence seems to corroborate the thesis that the rational model of decision making does not accurately reflect the actual process of choice-making (Camerer, 2003; Diamond & Vartiainen, 2007; Kahneman, 2006). The present upturn in the study of behavioral aspects of decision-making (Ackert & Deaves, 2010) has led to the renewed interest in the problem of rationality of human choices and behaviors (Li, Ashkanasy, & Ahlstrom, 2014). The most significant quality of this approach is the study of real decision-making challenges as tasks influenced both by the rational evaluations and the markedly less rational emotions. A detailed analysis of the rational and behavioral approach to decision making can be found in the work of Orquin and Loose (2013).
115
Visualization of information and knowledge
Visualization is defined as an interactive graphical representation of data, produced with the use of IT instruments, and designed to extend and enhance human cognition processes (Card, Mackinlay, & Shneiderman, 1999). With the development of such fields as knowledge management, data exploration and knowledge discovery, there has been a marked shift from Information Visualization to Knowledge Visualization (Reeve, Han, & Chen, 2010; Zhu, & Chen, 2005). Analyses of economic data presented in graphical form, in association with human knowledge and human perception skills, offers potential for generation of whole new sets of unique information that constitute new knowledge, for example – previously unforeseen correlations between various data segments (Chen, 2006). In effects, visualization has become a subject of broader interpretations – not only as a method of conveying information through graphic signs, but as a data exploration method helping users identify latent patterns, correlations, etc. (Zhu & Chen, 2005) or as a form of knowledge representation, intended to facilitate transfer and dissemination of knowledge (Eppler, 2004). Knowledge visualization can also be approached in the context of the following areas of knowledge application (Eppler & Burkhard, 2004):
1) in knowledge management, since visualization offers potential for creation of new knowledge, opening the way to innovation,
2) as an interface used to reference or structure the wealth of accumulated knowledge,
3) as an effective approach to information surplus, since visualization can be used to compress large data sets through various analytical structures.
According to the most general definition, knowledge visualization is described as the use of visual presentation with the purpose of improving the processes of knowledge generation and transfer between two or more persons, including graphical symbols and other means that may be used to capture and convey complex observations and conclusions (Eppler & Burkhard 2004). In this sense, the adopted graphical forms used to represent the content, the layout, or any other attribute are clearly distinct from the traditional format of graphical data presentation since – apart from the typical descriptive and numerical values – they may also include prognostic and perspective observations, principles, and correlations.
Some researchers, in their analyses of potential uses of visualization as a knowledge-conveying medium, accentuate the innate human abilities to effectively process visual representations (Kudryavtsev & Gavrilova, 2017). The main function of knowledge visualization is to improve the existing knowledge and facilitate its dissemination (including personal expert knowledge), both in terms of quality and efficiency (Eppler & Burkhard, 2004). Another important segment of studies in the field is the research on information visualization as a tool that can be employed in knowledge integration processes (Burley, 2010). This approach offers the following benefits: (1) facilitated access to large data repositories and ease of presentation, often in aggregated form, and (2) fast retrieval of information (also with the purpose of generating new information).
116
1. Selection of graphical forms depending on the decision-making problem at hand. This aspect is mainly associated with the use of visualization in IT systems, particularly Business Intelligence solutions, as a tool for information and knowledge retrieval. The focus here is to determine graphical representation methods which offer best potential for minimizing the time required to retrieve unique information or knowledge for decision-making purposes. It seems that further development of research in this area is needed to produce valid principles for the selection of best graphical methods, their practical implementation, and their impact upon the decision-making process, particularly in the context of the emergent behavioral approach. In his extensive review of literature covering the past 25 years, Penrose (2008) studied (among other things) the design of graphical presentations of financial data, principles for their preparation, as well as their practical uses and typical misinterpretations of graphs. The analysis suggests that, despite some effort from research community to produce principles of graph use, some of the more advanced methods of graphical presentation have not yet been included in such studies. The following aspects remain crucial in this area of research: which of the available graphical methods should be used and when; and: what impact upon decision-making processes can be expected following the use of one method over another. The search for best solutions is determined by: the quantity of data (i.e. the scale of the phenomenon under study), its complexity, and its heterogeneity. Research of these aspects is well under way (Bresciani & Eppler, 2015; Miettinen, 2014), but it seems that more focus should be placed on identifying those graphical methods that are best suited for knowledge visualization applications.
2. Interactive visualization. Visual approach to information retrieval involves the use of graphical methods to facilitate interactive queries, analyses, and retrievals of information made with active participation from the user. In this approach, it is essential for the graphical method to actively engage the user in information (or knowledge) retrieval processes, for example by offering tools for precise construction of complex queries of specific data sets (Lopes, et al., 2007) or by helping the user identify correlations between various segments of data under examination. Application of interactive graphical methods helps the user (manager) gain a fresh view on the situation at hand, thus facilitating the formulation and effective validation of new hypotheses. This approach to visualization is important, since visual methods and techniques can greatly enhance the effectiveness of the standard automatic data exploration methods by engaging the perceptive skills and personal expertise of the user (Keim & Schneidewind, 2005). One of the most important aspects of this approach is the verification of interactive graphical methods as effective instruments for visual exploration of large data sets (Ertek et al., 2015). Another crucial facet here is the study of integration between various data mining algorithms and the assorted data visualization techniques, with the intention of producing a more effective analytical process.
3. Visualization of uncertainty. The major effort here is directed towards development of managerial support systems with good support for making informed decisions under conditions of uncertainty. The scale of research on methods of presenting uncertainty for decision-making purposes is fairly limited at present (Riveiro et al., 2014). The most apparent problem is the lack of empirical evidence to support the effectiveness of graphical methods in the process of making decisions under conditions of uncertainty, particularly their
117
this problem can be found in: (Riveiro et al., 2014). Another important postulate here is to study the impact of uncertainty visualization techniques in problem situations, particularly those with a narrow temporal window of response.
4. Human perception. This applies, in particular, to various optical illusions which may trick the brain and produce interpretation errors, such as: the Titchener illusion (an optical illusion of relative size perception), the Hermann grid illusion (an optical illusion of grey blobs perceived at the intersections of a white grid on a black background), contrast enhancement (Ward, Grinstein, & Keim, 2010). Those are but a few of the perception problems faced by human cognition, but their impact on our interpretation of graphical signs and other methods of data visualization can be quite pronounced.
The four main areas of scientific research on visualization in decision-making context, as presented above, are by no means mutually exclusive. There are numerous examples of studies and problems which can easily be classified as belonging to at least two of the above areas (Huang, 2014; Ward et al., 2010). Hence the postulate for a proper integration of field research, since many of the questions and problems at hand require a multidirectional approach. For example, in order to study the potential utility of uncertainty visualization as a method for improving the effectiveness of decision-making processes, it is necessary to examine both the choice of suitable graphical methods and the reception or perception of such methods by the human brain. Users of IT systems will be more inclined to utilize visualization if they find it to be legible, clear, and with good potential to improve the process at hand. Such improvements may include faster information retrieval or facilitated deduction and inference in knowledge creation.
One of the most important problems that need to be addressed at this point is the design of methods for presentation of various hierarchical and semantic correlations (these types of relations often constitute the bulk of expert knowledge) between the assorted financial and economic indices. For this, we need to devise and produce intuitive forms of data presentation – ones that offer active user-system interaction. One of the most promising research trends in this area is the use of semantic network visualization, interpreted here both as a medium for the presentation of selected aspects or areas of data sets, and as basis for an interactive user interface. These types of studies require a comprehensive approach, covering the following areas: evaluation of semantic network visualization in the context of financial data presentation; knowledge visualization and the ontological approach to knowledge representation in IT systems, design of a visual interactive interface for effective analyses of various correlations between financial indices, and the study of users’ perceptive abilities and limits (too many concepts displayed at the same time, too many correlations between them). The problem of uncertainty in decision-making applications should also be studied in this context, since the semantic network visualization represents both the rational approach to decision-making (by presenting facts and knowledge stored by the system), and the behavioral approach (by taking into account the constraints and limits of human perception, as the system may engage the user not only by inferencing his or her deductive powers, but also personal knowledge and experience
118
Case Study: Use Of Semantic Network Visualization In Financial Indicators Analyses
Financial Indicators Analysis
Indicators analysis in finance involves determination of causal relationships between financial indices representing different structural combinations (the so-called financial ratio pyramid) for the purpose of internal, comprehensive evaluation of company operating conditions as well as anticipation of future development trends (Bragg, 2002). Financial indices represent relations between at least two quantities, isolated with the view of assessing the required cognitive values from the set. With regard to the degree of data (information) aggregation, these may be expressed in synthetic or partial measures, with synthetic indices representing sums, differences, products or quotients of partial indices (Revsine et al., 2012). Based on financial data gathered from (among other things) cash flow statements, balance sheets, and profit-and-loss statements, companies may generate a wealth of assorted financial indices, since no formal standards or legislative requirements are formulated to restrict their design principles. In theory, each individual company is free to devise their own standards and measures for internal evaluation purposes.
Indicators analysis in finance is a good example of an area offering unique knowledge through combination of experience and latent knowledge held by experts and managers, data-processing output generated by the IT systems, and significant ad hoc information. Hence, both the utility of analyses and the informative capacity of indices are closely related to the logic adopted by managerial cadres for the calculation of such measures and for the determination of not only structural, but most of all – semantic correlations that may exist between them. In other words, the utility of indicators analyses performed on financial data can also be seen as a function of the
manager’s knowledge and understanding of both structural and semantic correlations between
the studied indicators.
Analyzing the present trends in the development of managerial support systems, it must be observed that, for the most part, the reports generated by those systems seem to satisfy the requirements of managerial cadres. However, with the rapid development of the IT market, particularly due to its pronounced turbulence and volatility, new solutions and new requirements may be formulated with ease, if they are found to offer good yields in financial analytics.
119
are faced with the lack of both the support, and the quality of the available expert knowledge. In this context, computer-aided analyses of semantic correlations between the studied variables may
facilitate and expedite the identification of ‘weak signals’ of potential development opportunities or operating risks.
Secondly, managerial expectations include the access to information on algorithms used in the calculation of financial indices (i.e. their values as a function of specific financial data or other qualitative measures) and facilitated interpretation of the results. Companies often employ a variety of indexing systems in parallel; in theory, each such system can be modified and adjusted interminably. Proper knowledge on the connotations attached to individual indices and correlations that may exist between them is of prime importance, to eliminate the risk of misinterpretations. For example, the so-called weak signals (symptoms of future problems) can be difficult to identify through unambiguous interpretations, which makes them particularly problematic to track using conventional IT instruments and systems of financial analysis. Due to the lack of formalized standards for the interpretation of quantitative measures in this area, financial analysis remains in the domain of specialists and financial experts, i.e. those who employ not only normative (general) knowledge of the subject, but also – to a varied extent – their latent knowledge formed through years of practice.
It must be noted at this point that the crucial postulate lies not in the quantity of data available for analytical purposes, but the effective utility of such data. Managers require data to be: relevant to the problem at hand, easily interpretable, and yielding comprehensible results. In addition, to make informed decisions, managers may also require unique information generated by IT systems.
Semantic network visualization
Information search within a semantic network is a subject of many studies and is a concern of various fields (Ertek et al., 2015; Fu, Noy, & Storey, 2013; Hirsch, Hosking, & Grundy, 2009; Khalili & Auer, 2014; Korczak et al., 2013; Stab et al., 2012). In this study, special attention is paid to the role of visualization in regard to semantic networks.
A semantic network (also called semantic net or concept network) “is a graphic notation for
representing knowledge in patterns of interconnected nodes and arcs” (Sowa, 1992). It is a
directed or undirected graph, where vertices represent concepts and edges represent relations between concepts. One of the main artefacts in semantic networks is the ontology. In literature many different definitions of ontology can be found. A wide review of this issue is presented in: (Arp, Smith, & Spear, 2015). However, there is no universally used one in information technology. Most often quoted definition of ontology formulated by Gruber (1993) is:
“[ontology] is an explicit specification of a conceptualization”. The hallmark of a semantic network is a robust ontology wherein data and relationships of objects from various fields of knowledge are defined. In this study, special attention is paid to the role of semantic network visualization, which is a multi-faceted, interactive presentation tool and also allows for interactive visual searching for information (Ertek et al., 2015; Grand & Soto, 2010; Wienhofen, 2010). There is a new term used to describe technologies associated with ontology and
120
Fundamental factors for a good semantic network visualization interface are: (1) full overview of the structure for understanding of the global hierarchy and of the relationships within; and (2) the ability to zoom and to select specific nodes (Dudycz, 2015). Interactive visualization actively includes the user in the process of finding information, enabling him or her to build more accurate queries for a specific set of data (Lopes et al., 2007), and facilitates the observation of data relationships. Visualization allows users/decision-makers to use their natural spatial/visual capabilities to determine where further exploration should be done (Dudycz, 2010). Graphical presentation of data supports innovation by users (i.e. decision-makers), allowing them to formulate and validate new hypotheses. Graphical expressions may also assure that semantic information searches are interpretable for non-technical users.
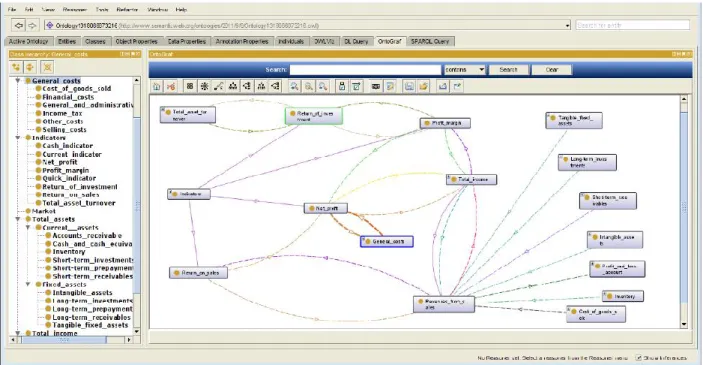
Figure 1 presents a sample visualization of a business knowledge semantic network search in the OntoGraf module in the program Protégé. On this Figure 1 there are two types of lines, each of which represents a type of topical relationship. The solid lines represent a relationship of
“subclass-of”, whereas the dashed lines represent user-defined (expert) relationships. Protégé is a free, open source platform (http://protege.stanford.edu/), which can be extended with many plugins for ontology visualization (http://protegewiki.stanford.edu/wiki/Visualization).
Figure 1. An example of semantic network visualization of business knowledge
Source: an application that was built for this study, based on Protégé 4.1.
121
usefulness of semantic network visualization in searching for business information that is contextually connected.
Practical Application of Semantic Network Visualization
This section presents an example of the practical use of semantic network visualization, based on a scenario representing only a narrow aspect of financial indicators analysis, as applied to the evaluation of company performance. In this context, managers typically perform analytical evaluations of such indices as: Return on Assets (ROA), Return on Equity (ROE), Return on Sales (ROS). These basic synthetic indicators are subject to analyses on a regular basis.
The goal of our research is to present the potential applications of semantic network visualization in management, which contains the models of knowledge of the financial indicators analysis. The ontology of this study was construed using the approach presented in (Dudycz, 2013; Dudycz, & Korczak, 2016). This study has been carried out in the five stages:
1. Definition of the goals, scope, and constraints of the created ontology. For our purpose, an ontological framework was designed to represent the area of knowledge under study (i.e. financial indicators analysis). We focused on the analyses of three main indicators: Return on Assets, Return on Equity and Return on Sales.
2. Conceptualization of the ontology. It includes the identification of all concepts, definition of classes and their hierarchic structures, modeling relations, identification of instances, specification of axioms, and rules of reasoning. In our study it involved the following: the identification of all concepts, definition of classes and their hierarchic structures, modelling relations, and identification of instances.
3. Verification of the ontology’s correctness by experts. In this stage, the constructed ontology is
verified by experts who did not participate in the process of conceptualization. Verification contained a formal verification of the specified ontology (e.g. incorrect relations were indicated) and a content verification (e.g. correctness of taxonomic topics, and correctness of relational dependencies between topics).
4. Encoding the ontology is described in the formal language or editor of ontology. The result of this stage is the encoded ontology. We encoded our created ontology using the Protégé ver. 4.1 (open source ontology editor).
122
To illustrate a practical application of semantic network visualization for financial analysis, let us
examine a simple scenario of a manager trying to assess his company’s prospect for a bank loan.
For this purpose, he refers to the semantic network to learn that his company’s credit rating is described by indices in the following groups: efficiency assessment, and profitability evaluation. With the help of the IT system, he is able to obtain current values of all indices that constitute the
company’s rating. The results show that the company is fairly low on profitability evaluation,
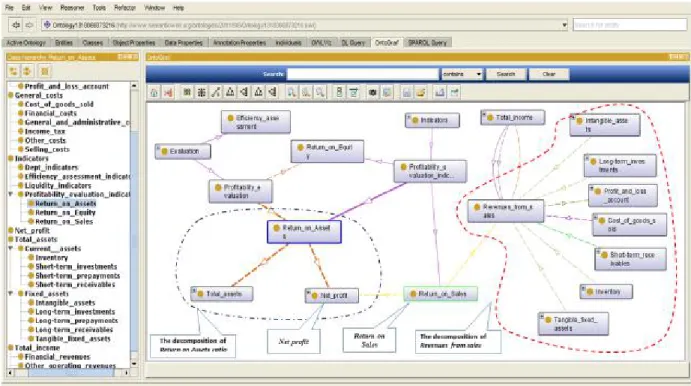
particularly with respect to the Return on Assets ratio. By expanding the ROA branch of the semantic network, the manager learns that the ROA value is determined by Net profit (See Figure 2).
Figure 2. An example of visualization of a semantic network of the system to analyze ROA ratio
Source: an application that was built for this study, based on Protégé 4.1.
The next logical step in our scenario is the identification of the reasons for such an unfavorable ROA ratio trend. The manager performs analyses of reports generated by the IT system against the values of those indices that may affect the ROA ratio. At this point, the manager may continue to explore the Net profit branch of the semantic network or examine other indices that
may affect his company’s current credit rating. The manager can see, that he should analyze the value of revenues from sales. Based on the results of financial analyses, he may then proceed to take such curative measures which offer the best potential for credit rating improvement. By addressing those parameters that have the most pronounced impact on the rating, the manager may largely improve his chances for a banking loan. A semantic search is provided to avoid
123
The above example should be viewed as a simple presentation of the postulated approach to problems based on the use of ontological network representation of knowledge stored in IT systems and the semantic network visualization. In practice, both the scale and the complexity of financial analyses of company operation are far more advanced. In this context, proper visualization of the various correlations between data and financial indices may prove invaluable for managerial purposes. A clear visualization of dependencies and relations between the assorted measures of financial performance may greatly facilitate the interpretation of results and the identification of reasons behind their current trend (be it negative or positive).
In the literature it is described how visualization supports the process of sense making, in which information is collected, organized, and analyzed to form new knowledge and inform further action (Card, Mackinlay, & Shneiderman, 1999). According to Burkhard (2004), the knowledge visualization allows on coordination, attention, recall, motivation, elaboration or new insights. The presented example of the semantic network visualization may help to reduce the cognitive load and enhance the processing abilities by visualizing abstract relationships. It enables innovation as it offers to use the creative power of a visual metaphor and interactive collaborations and thus help to create new insights (new knowledge). It allows to externalize knowledge (e.g. tacit knowledge of experts) and share it with others. In the process of conceptualization ontology experts from the financial field should attend, not only to agree on vocabulary and semantic structure, but also to represent their tacit knowledge, which is their experience. This is particularly important for managers who are not specialists in the analysis and interpretation of economic and financial indicators, or managers with a limited knowledge of relationships between different financial and economic indicators.
Conclusions
With rapid development of strategic management and increased uncertainty pressure, managerial cadres require new types of information as basis for their managerial decisions. To anticipate potential risks to company operation and identify development opportunities, managers are more and more likely to reach for analytical instruments to study both data and indicators of financial performance. Of particular importance here is the role of the so-called weak signals, i.e. early symptoms of future strategic changes or trend disturbances in the immediate environment that may affect company operation. Early detection and proper interpretation of such signals gives managers more time to plan their course of action. This leads us to the postulate expressed by managers to IT system designers, namely: to provide them with methods for interactive exploration and retrieval of information based on contextual correlations, also in the context of available knowledge. It seems that ontology (representing structural, semantic, and procedural knowledge) and the associated visualization methods (i.e. semantic network visualization) offer the best potential at present and can be used as key components of such managerial support systems.
In knowledge management, the transfer of knowledge is a core process, which can be improved
by using human’s innate abilities to process visual representations (Burkhard, 2004).
124
of practical application of semantic network visualization in support of decision-making processes. The results of the case study indicate that the use of semantic network visualization can improve communication, knowledge transfer and fosters the engagement of decision makers. Semantic network visualization can show different connections between indicators that make possible the discovery of new relations between economic and financial indicators constituting knowledge still unknown in this area. Moreover this solution reduces information overload, prevents misinterpretation and improves the decision making.
To sum up, the evolving needs of managerial personnel pose new challenges for designers of IT solutions and stimulate scientific research towards identification of the best and the most effective solutions based on interactive visualization. Three major aspects are studied in this respect. The first aspect is the design of a suitable form of advanced graphical presentation of data to be used in both the standard reports and the ad hoc documents generated for decision-making purposes, particularly under uncertainty conditions. The second aspect is the search for the most effective form of interactive user interface (UI). The third aspect involves the identification and formulation of safe and effective decision-making sequences and their associated threshold conditions, based on ontological knowledge representation and semantic network visualization.
Further studies in the use of visualization in managerial support systems are needed to determine their potential for supporting decisions made under conditions of uncertainty. It seems that semantic network visualization can be useful also in this context. By presenting selected knowledge associated with a specific area (and stored by the IT system), it offers the capability of including the user (and his or her accumulated and latent knowledge) in the process of visual data exploration. In this type of application, proper design of ontologies for the postulated decision-making sequences should also be of crucial importance.
Another important research area of semantic network visualization is an evaluation of visualization tools to determine the suitability of each method for end user applications. There are many ontology visualization tools, which allow to show semantic network. In the relevant literature, we can find a comparison of several ontology visualization tools both in Protégé (Hussain et al., 2014) and other ontology editors (Ramakrishnan & Vijayan, 2014), but these works present the preliminary results. A research that will analyze these tools to show their advantages and disadvantages and will validate the usefulness of the strengths and weaknesses of visualization interface for semantic searches of business information by decision-makers is required. It will allow to choose the best tools to strengthen the users’ cognitive support.
References
Ackert, L.F., & Deaves, R. (2010). Behavioral finance: Psychology, decision making and markets. South-Western Cengage Learning.
Arp, R., Smith, B., & Spear, A. D. (2015). Building ontologies with basic formal ontology. Cambridge, MA: MIT Press.
125
Bragg, S. M. (2002). Business ratios and formulas. A comprehensive guide. New Jersey, John Wiley & Sons.
Bresciani, S., & Eppler, M. J. (2015). The pitfalls of visual representations: A review and classification of common errors made while designing and interpreting visualizations. SAGE Open, October-December, 1-14. DOI: 10.1177/2158244015611451
Burkhard, R. A. (2004). Learning from architects: the difference between knowledge visualization and information visualization. In: Proceedings of the Information
Visualisation, Eighth International Conference. IEEE Computer Society, Washington, 519-524. DOI: 10.1109/IV.2004.1320194
Burley, D. (2010). Information visualization as a knowledge integration tool. Journal of Knowledge Management Practice, 11 (4), 1-8.
Camerer, C.F. (2003). Behavioral game theory: Experiments in strategic interaction. Princeton University Press.
Card, S.K., Mackinlay, J.D., & Shneiderman, B. (Eds.) (1999). Readings in information visualization: Using vision to think. San Francisco, Morgan Kaufmann Series in Interactive Technologies.
Chen, C. (2006). Information visualization. Beyond the horizon. London, Springer-Verlag.
Craig, R. F., & Tversky, A. (1995). Ambiguity aversion and comparative ignorance. Quarterly Journal of Economics, 110 (3), 585–603. DOI:10.2307/2946693
Diamond, P., & Vartiainen, H. (Eds.) (2007). Behavioral economics and its applications. Princeton University Press.
Dudycz, H. (2015). Usability of business information semantic network search visualization. In: Sikorski, M., Dittmar, A., Marasek, K., & de Greef, T. (Eds.), Proceedings of
Multimedia, Interaction, Design and Innovation MIDI’15, Article no. 13, 1-9. New York, ACM Digital Library. DOI: 10.1145/2814464.2814477
Dudycz, H. (2013). The topic map as a visual representation of economic knowledge (in Polish).
Wrocław, Wydawnictwo Uniwersytetu Ekonomicznego we Wrocławiu.
Dudycz, H., & Korczak, J. (2016). Process of ontology design for Business Intelligence system. In: Ziemba, E. (Ed.), Information Technology for Management. Federated Conference on Computer Science and Information Systems, Lecture Notes in Business Information Processing, vol. 243, Springer, 17-28. DOI:10.1007/978-3-319-30528-8_2
Dudycz, H., Korczak, J., Nita, B., & Oleksyk, P. (2016). Attempt to extend knowledge of Decision Support Systems for small and medium-sized enterprises. In: Ganzha, M., Maciaszek, L., & Paprzycki, M. (Eds.), Proceedings of the 2016 Federated Conference on Computer Science and Information Systems September 11–14, 2016. Gdańsk, Poland, Annals of Computer Science and Information Systems, vol. 8, 1263-1271.
DOI:10.15439/2016F181
126
Eppler, M. E., & Burkhard, R. A. (2004). Knowledge visualization. Towards a new discipline and its fields of application. In: ICA Working Paper, Lugano, University of Lugano.
Ertek, G., Tokdemir, G., Sevinç, M., & Tunç, M.M. (2015). New knowledge in strategic
management through visually mining semantic networks. Information Systems Frontiers, Springer US, 1-21. DOI: 10.1007/s10796-015-9591-0
Fu, B., Noy, N. F., & Storey, M. A. (2013). Indented tree or graph? A usability study of ontology visualization techniques in the context of class mapping evaluation. In: ISWC '13
Proceedings of the 12th International Semantic Web Conference - Part I, Springer-Verlag, New York, 117-134.
Fox, J. (2015). From “Economic Man” to behavioral economics. Harvard Business Review, 93, 79-85.
Griffin, R. W. (2009). Management. 10th ed., Mason, South-Western Cengage Learning.
Grand, B.L., & Soto, M. (2010). Topic maps, RDF graphs, and ontologies visualization. In: Geroimenko, V., & Chen, C. (Eds.), Visualizing the Semantic Web. XML-Based Internet and Information Visualization, Springer-Verlag, London, 59–79.
Gruber, T. R. (1993). Toward principles for the design of ontologies used for knowledge sharing. International Journal Human-Computer, Studies 43, 907–928.
Hussain, A., Latif, K., Rextin, A. T., Hayat, A., & Alam, M. (2014). Scalable visualization of semantic nets using Power-Law Graphs. Applied Mathematics & Information Sciences An International Journal, 8, 355-367.
Hirsch, C., Hosking, J. G., & Grundy, J. C. (2009). Interactive visualization tools for exploring the semantic graph of large knowledge spaces. In 1st Int'l Workshop on Visual Interfaces to the Social and the Semantic Web (VISSW 2009). Sanibel Island, Florida, 8th February.
Huang, W. (Ed.) (2014). Handbook of human centric visualization. New York, NY: Springer.
Jaśko, K., Czernatowicz-Kukuczka, A., Kossowska, M, & Czarna, A. Z. (2015). Individual differences in response to uncertainty and decision making: The role of behavioral inhibition system and need for closure. Motivation and Emotion, 39(4), 541-552.
Kahneman, D. (2011). Thinking fast and slow. New York, NY: Farrar, Straus, Giroux.
Kahneman, D. (2006). New challenges to the rationality assumption. In: Lichtenstein, S., & Slovic, P. (Eds.), The Construction of Preference, New York, Cambridge University Press, 487-503.
Keim, D. A., & Schneidewind, J. (2005). Scalable visual data exploration of large data sets via multiresolution. Journal of Universal Computer Science, 11, 11, 766–1779.
Khalili, A., & Auer, S. (2014). WYSIWYM – Integrated visualization, exploration and authoring of semantically enriched Un-structured Content. Semantic Web Journal 6, 3, 259–275.
127
Lanzenberger, M., Sampson, J., & Rester, M. (2010). Ontology visualization: tools and
techniques for visual representation of semi-structured meta-data. Journal of Universal Computer Science, 16, 7, 1036-1054.
Luoma, J. (2016). Model-based organizational decision making: A behavioral lens. European Journal of Operational Research, 249(3), 816–826.
Korczak, J., Dudycz, H., & Dyczkowski, M. (2013). Design of financial knowledge in dashboard for SME Managers. In: Ganzha, M., Maciaszek, L., & Paprzycki, M. (Eds.), Proceedings of the 2013 FedCSIS 2013. Annals of Computer Science and Information Systems, 1, Warsaw, Los Alamitos, Computer Society Press, 1111-1118.
Li, Y., Ashkanasy, N.M., & Ahlstrom, D. (2014). The rationality of emotions: A hybrid process model of decision-making under uncertainty. Asia Pacific Journal of Management, 31, 293-308.
Lopes, A.A., Pinho, R., Paulovich, F.V., & Minghim, R. (2007). Visual text mining using association rules. Computer & Graphics, 31, 316–326.
Meyer, R., & Hutchinson, J. (2001). Bumbling geniuses: The power of everyday reasoning in multistage decision making. In: Hoch, S. J., Kunreuther, H.C., & Gunther, R. E. (Eds.), Wharton on Making Decisions, New York, Wiley, 37-62.
Miettinen, K. (2014). Survey of methods to visualize alternatives in multiple criteria decision making problems. OR Spectrum, 36, 3-37.
Nazemi, K., Breyer, M., Burkhardt, D., Stab, C., & Kohlhammer, J. (2014). SemaVis: A new approach for visualizing semantic information. In: Towards the Internet of Services: The THESEUS Research Program Cognitive Technologies, Springer, Berlin, Heidelberg, New York, 191–202.
Newell, B., & Shanks, D. R. (2014). Unconscious influences on decision making: A critical review. Behavioral and Brain Sciences, 37, 1– 61. doi:10.1017/S0140525X12003214
Orquin, J. L., & Loose, S. M. (2013). Attention and choice: A review on eye movements in decision making. Acta Psychologica, 144, 190-201.
Penrose, J.M. (2008). Annual report graphic use. A review of the literature. Journal of Business Communication, 45 (2), 158-180.
Peterson, M. (2009). An introduction to decision theory. New York, Cambridge University Press.
Ramakrishnan, S., & Vijayan, A. (2014). A study on development of cognitive support features in recent ontology visualization tools. Artificial Intelligence Review, 41, 4, 595–623. DOI: 10.1007/s10462-012-9326-2
Reeve, L., Han, H., & Chen, C. (2010). Information visualization and the semantic web. In: Geroimenko,V., & Chen, C. (Eds.), Visualizing the Semantic Web. XML-Based Internet and Information Visualization, London, Springer-Verlag, 19–44.
128
Riveiro, M., Helldin, T., Falkman, G., & Lebram, M. (2014). Effects of visualizing uncertainty on decision-making in a target identification scenario. Computer &Graphics, 41, 84-98.
Shiller, R.J. (2005). Irrational exuberance. Princeton University Press.
Sowa, J.F (1992). Semantic Networks, Retrieved from http://www.jfsowa.com/pubs/semnet.pdf.
Stab, C., Nazemi, K., Breyer, M., Burkhardt, D., & Kohlhammer, J. (2012). Semantics
visualization for fostering search result comprehension. The Semantic Web: Research and Applications. Proceedings: ESWC 2012, Lecture Notes in Computer Science (LNCS) 7295, Springer, Berlin, Heidelberg, New York, 633–646.
Takemura, K. (2014). Behavioral decision theory: Psychological and mathematical descriptions of human choice behavior. Springer Verlag.
Turban, E., Aronson, J.E., Liang, T., & Sharda, R. (2007). Decision support and business intelligence systems. New York, NY: Pearson Prentice Hall.
Ward, M., Grinstein, G., & Keim, D. (2010). Interactive data visualization. Foundations, techniques, and applications MA. A.K. Peters Ltd., Natick,.
Wienhofen, L.W.M. (2010). Using graphically represented ontologies for searching content on the semantic web. In: Geroimenko, V., & Chen, C. (Eds.), Visualizing the Semantic Web. XML-Based Internet and Information Visualization, Springer-Verlag, London, 137–153.
Zhu, B., & Chen, H. (2005). Information visualization. Annual Review of Information Science and Technology, 39, 139–177.
Author’s Biography