KEYWORD SEARCH
The Official Electronic Publication of the National Association of Industrial Technology • www.nait.org © 2001
An Examination of the Graduation
Rates and Enrollment Trends in
Industrial Technology Baccalaureate
Programs from 1988-1998
By Dr. Tao C. Chang & Dr. John C. Dugger
Volume 17, Number 3 - May 2001 to July 2001
Reviewed Article
Administration Higher Education
Dr. Tao C. Chang is an assistant professor in the Department of Industrial Education and Technol-ogy at Iowa State University. In 2000, he received the Outstanding Early Teaching Commendation Award. His research interests include synthetic/ biodegradable polymers/composites character-ization and development and plastic processes optimization.
Dr. John C. Dugger was appointed the Dean of the College of Technology at Eastern Michigan Univer-sity effective January 2001. Prior to his appoint-ment, he was an associate professor and coordina-tor of the coop/internship program in the Depart-ment of Industrial Education and Technology at Iowa State University. Dr. Dugger has secured more than $950,000 in grants and has made more than 75 presentation at regional and national conferences. Currently he is the principal investigator for a $550,000 National Science Foundation Grant de-signed to change the way manufacturing design is taught at the post-secondary level. He has directed several studies in the quality improvement area and has taught graduate leadership classes.
An Examination of the
Graduation Rates and
En-rollment Trends in Industrial
Technology Baccalaureate
Programs from 1988-1998
By Dr. Tao C. Chang & Dr. John C. Dugger
Clearly, the vitality of educational enterprises depends on student enroll-ment. Many institutions with this realization have spent tremendous resources in research, consulting, advertising, and developing effective and efficient enrollment and retention programs. Although it may be impos-sible to establish with absolute certainty why students elect to enroll, or leave, a school or a program, there appear to be economic, geographic, sociological, psychological, and intellectual reasons associated with their actions. The goal of enrolling qualified students and successfully retaining and graduating them is the responsibility of all adminis-trators, staff, and faculty at all levels of an institution of higher education (Dennis, 1998). Professional associa-tions also need to play a role in improv-ing the quality and persistence rates of the programs represented by their members.
As educators in Industrial Technol-ogy, we must collect and analyze relevant data for strategic planning and decision-making to help identify best practices, detect trends that need attention, and monitor progress of new initiatives. This study was undertaken to provide information that reveals enrollment trends in industrial technol-ogy baccalaureate programs. The higher education context is also provided to help the reader understand how the trends in industrial technology differ from trends in other baccalaureate programs. The information should aid the organization-wide planning efforts
of the National Association of Industrial Technology (NAIT) as well as those undertaken by leaders of Industrial Technology baccalaureate programs.
Defining Measures
In most institutions of higher education, the number of students divided by the number of full time equivalency (FTE) faculty reflects, to some degree, how efficiently programs are operating. This ratio does not address the quality of this service or cycle time (time to graduation). More specifically, this ratio determines the worth of a program based, to some degree on tuition. Programs that experience reduced enrollment and conversely a reduced student per FTE ratio become targets for study and in some cases, targets for elimination.
According to the 1999 Digest of Education Statistics published by the National Center for Education Statis-tics (NCES), the student per combined (faculty and staff) FTE ratio at colleges and universities dropped from 5.4 in 1976 to 4.9 in 1995. During the same time period, the students per FTE faculty ratio dropped from 16.6 to 15.2.
The percentage of professionals listed as administrative staff and other non-teaching professional staff rose from 15 percent in 1976 to 22 percent in 1995, while the proportion of nonprofessional staff declined from 42 percent to 34 percent. For those in higher education, this means that class size decreased slightly, we have more
upper level administrators and fewer secretaries and support staff.
Overall Higher
Education Trends
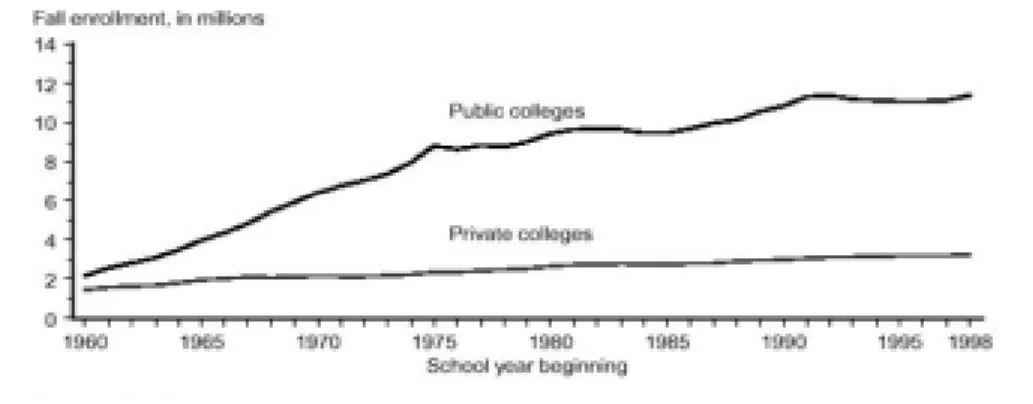
From the 1999 Digest of Education Statistics (NCES, 1999, Chapter 3), the enrollment in higher education in-creased annually from 1960-61 to 1996-97 (see Figure 1). The period of greatest growth occurred from 1960 to 1975 where the total enrollment increased from about 3.7 million to 11.2 million. The increase was larger in public institutions than in private ones. During the period from 1987 to 1997, much of the growth was due to an increase in full-time students (part-time increased 9 percent while 15 percent for full-time) and female enrollment (the female increase was 17 percent while the male increase was 7 percent). In term of students’ ages, Figure 2 (NCES, 1999, Chapter 3) shows that the number of older students has been growing more rapidly than the number of younger students. However, the pattern is expected to change. Between 1990 and 1997, the enrollment of persons age 25 and over rose by 6 percent. During the same period, the enrollment of students under age 25 increased 2 percent. From 1997 to 2009, the National Center for Education Statistics projects a rise of 6 percent in enrollments of persons under 25 and an increase of 3 percent in the number of those 25 and over.
Graduation Rates
During the period from1988 to 1995, as reported by NCES (1999), more people were completing college as shown in Figure 3, from 1,018,700 to 1,164,792. The number of
bachelor’s degrees awarded to males increased by 8.9 percent, while those awarded to females rose by 18.4 percent. However, the pattern of bachelor’s degrees conferred by fields shifted dramatically during the same period. According to the same report, declines are significant in some male majority fields such as engineering and computer and information sciences.
The numbers of engineering graduates declined dramatically from 69,380 to 61,206 during the period of
Figure 1: Enrollment, degrees conferred, and expenditures in institutions of higher educa-tion: 1960–61 to 1996–99 (The 1999 Digest of Education Statistics of NCES, Chapter 3)
Figure 2: Enrollment in institutions of higher education, by age: Fall 1970 to fall 2009 (The 1999 Digest of Education Statistics of NCES, Chapter 3)
0 2 0 0 ,0 0 0 4 0 0 ,0 0 0 6 0 0 ,0 0 0 8 0 0 ,0 0 0 1 ,0 0 0 ,0 0 0 1 ,2 0 0 ,0 0 0 1 ,4 0 0 ,0 0 0
19
8
7
-8
8
19
88-8
9
19
89
-9
0
19
90-9
1
19
91-9
2
19
9
2
-9
3
19
9
3
-9
4
19
9
4
-9
5
19
9
5
-9
6
Figure 3: US Baccalaureate Graduates from 1988 to 1995. (The 1999 Digest of Education Statistics of NCES)
1987-88 to 1991-92, then recovered slightly to 62,114 in 1995-96, as illustrated in Figure 4.
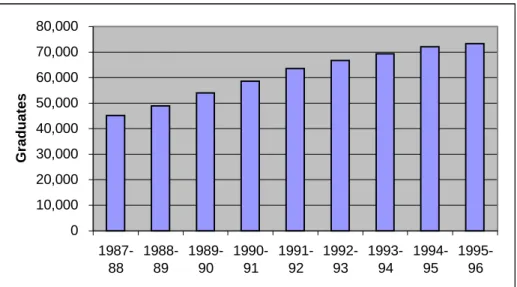
The computer and information sciences graduation rates showed the same decreasing trend at the same time dropping from about 35,000 to about 25,000 between 1987-88 and 1990-91, and then leveling off in 1995-96. Yet the bachelor degrees awarded in some non-technical areas experienced increases. For example, the psychol-ogy graduates increased steadily from 45,187 to 73,291 between 1987-88 and 1995-96, shown in Figure 5. The number of social sciences and history graduates also increased from 100,460 to 135,703 between 1987-88 and 1992-93, and then dropped slightly to 126.479 between then and 1995-96.
Do the trends
reflect societal needs?
Throughout the period of 1982-83 to 1994-95, the Bureau of Labor Statistics (BLS) projected favorable job prospects for occupations requiring a bachelor’s or higher degree in technical areas such as computer sciences and engineering (Kelinson, 1998). Yet the most growth was experienced in non-technical areas such as psychology, visual and performing arts, and liberal arts and humanities. Obviously, the demand for college-level graduates by industry has not been heard or has been ignored by the students and/or the institutions of higher education.
There may be many possible reasons for this lack of responsiveness by institutions of higher education. The perceived demands of math and science classes in the technical pro-grams may negatively impact enroll-ment or persistence rates in those programs. Faculty and staff in these programs may also be inept at recruit-ing and later meetrecruit-ing the needs of students entering the program.
In 1998, Mittelhauser revealed good potential prospects for college graduates between 1996 and 2006. In reviewing Bureau of Labor Statistics data, he points out that the job market dilemma for college graduates; there are more jobseekers (around 250,000 more) with college degrees than there
are openings of college-level jobs. This situation has existed for more than a decade and is expected to continue. However between 1996 and 2006 as shown in Table 1, the demand for a college-educated workforces due to technology advances and globalization is projected to increase 27.3 percent compared to 10.6 percent and 14.1 percent projected increases in non-college-level jobs and the total labor market, respectively.
One reason that college graduates will fare better than workers in other educational groups is the growth by occupational distribution. As indicated in Table 1, the major occupational groups that provide college-level jobs
are expected to grow more rapidly (within 15.2 percent to 36.8 percent) than the 14 percent increase in employ-ment for the economy as a whole. Professional specialty occupations, the largest source of college-level jobs, will be the fastest growing occupational group including both college- and noncollege-level jobs. In fact, Table 1 also shows that professional specialty occupations will account for more than half of all college-level openings due to a growth of about 400,000 jobs each year between 1996 and 2006. The occupations that will add the most jobs in this group are computer engineers, computer scientists, and system ana-lysts. Other professional specialty
Figure 5: Baccalaureate Graduates of Psychology programs from 1988 to 1995. (The 1999 Digest of Education Statistics of NCES)
56,000 58,000 60,000 62,000 64,000 66,000 68,000 70,000
1987-88 1988-89 1989-90 1990-91 1991-92 1992-93 1993-94 1994-95 1995-96
Graduates
0 10,000 20,000 30,000 40,000 50,000 60,000 70,000 80,000
1987-88
1988-89
1989-90
1990-91
1991-92
1992-93
1993-94
1994-95
1995-96
Graduates
Figure 4: Baccalaureate Graduates in Engineering Majors from 1988 to 1995. (The 1999 Digest of Education Statistics of NCES)
occupations projected to provide many job openings are engineers, teachers, registered nurses, therapists, physicians, and social workers. The growth of many of these occupations is the result of the expanding use of computers and increasing need for health care projected as the baby-boom population ages.
What has happened with IT
Baccalaureate programs?
The strength of Industrial Technol-ogy baccalaureate programs, until recently, has been difficult to track. Data regarding current enrollment such as the number of students enrolled in the program or the number of students enrolled in all courses tends to change as the semester progresses. The Integrated Post-Secondary Education Data System (IPEDS) approach, which forms the basis for most of the studies of higher education, is used to gather data ten class days into the semester to filter out students that enrolled but failed to show up for classes and add those who enrolled late.
These enrollment data are further complicated by the need to account for part-time students. For example, are students enrolled in industrial technol-ogy programs and taking only one class counted the same way that students taking a full-time load are counted? In post hoc studies of enrollment trends in industrial technology programs, what
sources exist that will allow the researcher to access the data regarding program enrollment? The answer appears to be not many. IPEDS does not group data using the industrial technology descriptor.
The National Association of Industrial Technology Baccalaureate Program Directory has been published for nearly twenty years. This docu-ment currently lists both enrolldocu-ment and number of graduates for all programs that complete the request for information forms mailed from the national office. Since this document is based on self-report, there may be some inconsistencies regarding whether the enrollment counts repre-sent full-time students or a combination full-time and part-time students.
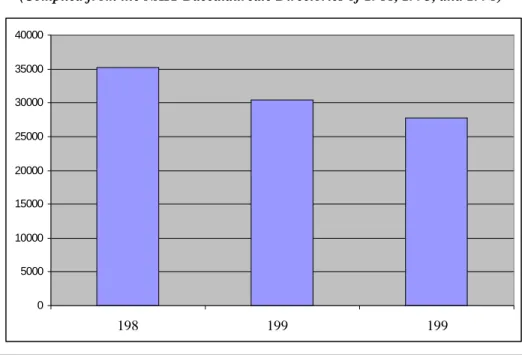
Enrollment in Industrial Technol-ogy programs for the years 1987, 1992, and 1997 as reported in the 1988, 1993, and 1998 directories are charted in Figure 6. The departments listed in the 1988 Directory reported 35,247 students enrolled in baccalaureate industrial technology programs at the end of the 1987 school year. This number had decreased to 27,802 in the 1998 Directory. There is some evidence to suggest that the earlier figures may include both technology education and industrial technology students and the later data are a more accurate represen-tation of the true industrial technology
figures. A larger number of programs listed the teacher option separately in the more recent directories.
Since the enrollment figures may not be as reliable, a better way of tracking industrial technology program strength may be to use the number of program graduates over a specific 12-month period. This output measure eliminates some of the concerns inherent in the use of enrollment data. The IPEDS data also places more emphasis on the number of graduates rather than the number of students.
Figure 7 displays the number of graduates as reported and published in the NAIT directories for the same three years. The 1988 and 1993 Directories reported 7,514 and 6317 graduates of industrial technology programs, respectively, while the 1998 Directory reported 6,108 graduates of industrial technology baccalaureate programs.
Some industrial technology programs had experienced dramatic growth from 1988 through 1998. The analysis of the three-year data identi-fies seven programs that reported increases of at least 194 percent during this ten-year period. The program reporting the greatest in-crease was the University of Idaho reporting 15 students in 1988, 270 students in 1993, and 350 students in 1998. Eastern New Mexico reported 9 students in 1988, 120 in 1993, with
Occupations Total College-level jobs Executive, administrative, and managerial Professional specialty Technicians and related Marketing and sales Administrative support All other college-level jobs Noncollege-level jobs 1996 Number Percent 132,330 100.0 27,450 20.8 8,370 6.3 13,900 10.5 1,170 0.9 2,490 1.9 1,060 0.8 460 0.3 104,880 79.3 2006, projected Number Percent 150,940 100.0 34,940 23.1 10,210 6.8 17,930 11.9 1,600 1.1 3,250 2.2 1,420 0.9 530 0.4 116,000 76.9 Projected change, 1996-2006 Number Percent 18,610 14.1 7,490 27.3 1,840 22.0 4,030 29.0 430 36.8 760 30.5 360 34.0 70 15.2 11,120 10.6
Table 1: Employment in college-level jobs, 1996, projected 2006, and projected change, 1996-2006. (Mittelhauser, 1998, Table 1) (numbers in thousands)
a decline to 90 in 1998 for a 900 percent increase for the 10-year period. However, it was also reported by the NAIT Office that Eastern New Mexico had phased out the program by the time for the 1999 Directory.
Keene State in New Hampshire reported 40 students in 1988, 243 in 1993, and 324 in 1998. Pacific Union in California reported 14, 16, and 85 for the same periods. The University of Houston reported an increase from 170 to 524 between 1988 and 1993 with a decline to 330 reported for 1998. Old Dominion (Virginia) and
Millersville University (Pennsylvania) reported upward trajectories of 15, 22, 64 and 97, 223, 285 respectively. An examination of the conditions that exist at each of the universities reporting dramatic growth may be useful to program and association leaders.
The data also reveal six programs that have decreased by at least 73 percent. Sul Ross State (Texas) re-ported 66 students in 1988 and 4 in 1998. During the same period Morehead State (Kentucky) and St. Cloud State (Minnesota) reported decreases of 425 to 32 and 425 to 45 students respectively. St. Cloud State University reported that the industrial technology program was phased out prior to the 1999 Directory. State University College at Buffalo (New York) and California State University at Fresno reported decreased from 723 to 157 and 450 to 121 respectively. A qualitative investigation involving interviews of various people in the schools and focusing on the reasons for the declines may be helpful to indus-trial technology leaders.
Further analysis of the National Association of Industrial Technology (NAIT) Directories revealed that 38 programs that reported industrial technology program enrollment in 1988 either failed to report or reported no enrollment in 1998.
What are the implications of
this trend for IT
It appears certain that the number of industrial technology graduates per year from 1988 till 1998 in US has decreased. This trend is similar to
what has occurred in engineering, math, and computer science programs during the same period. The number of industrial technology programs has also decreased during this same period. Beyond these general conclusions, one must be careful since no attempt to verify the data reported in the Direc-tory has been made.
As one examines the overall trends in higher education, it is clear that the number of students availing themselves
to higher education has been increasing and will continue to increase for the next few years. These students will include more women and larger numbers of traditional students. Therefore the potential recruiting opportunities for programs that lead to high paying jobs appear to be very good. One confounding variable is a steady increase in the number of graduates of non-technical programs such as psychology, sociology, and
Figure 6: Baccalaureate Enrollment in Industrial Technology during 1988-93-98. (Compiled from the NAIT Baccalaureate Directories of 1988, 1993, and 1998)
0 5000 10000 15000 20000 25000 30000 35000 40000
1 2 3
198 199 199
0 1000 2000 3000 4000 5000 6000 7000 8000
1 2 3
1988 1993 1998
Figure 7: The numbers of graduates in Industrial Technology during 1988-93-98. (Compiled from the NAIT Baccalaureate Directories of 1988, 1993, and 1998)
history where the starting salaries and job opportunities appear to be less favorable. Those faculty members in industrial technology, engineering, and computer science may wonder why their programs are unable to attract students in large numbers when psychology and history programs that to offer fewer employment opportuni-ties have seen steady increases.
Recommendations
One pressing need is for accurate industrial technology enrollment and graduation data that are periodically gathered and analyzed to guide deci-sion makers as they identify best practices in the student recruitment and retention arena. The NAIT central office may want to consider modifying the system for gathering directory information by requesting data in a form consistent with the data requested by the IPEDS effort. These “tenth class day” data will enable industrial technology leaders to benchmark other fields. The benchmarking data can lead to the identification of best practices that can be touted along with the
identification of areas where urgent attention is needed.
Some consideration should also be given to gathering data on the Student Credit Hour (SCH)/Full Time Equiva-lent (FTE) ratio for each industrial technology program. The gathering of such information would lead to greater attention to a more accurate efficiency measure, and hence lead to significant work on improving the efficiency of the programs in industrial technology.
Those industrial technology graduate program faculty could also help interest their students in finding answers to the question about why many students seek degrees where opportuni-ties are limited and where the financial rewards are small. A Request for a Proposal (RFP) funded by NAIT or some philanthropic organization could help interest faculty and graduate students in examining this problem. Such efforts to focus research efforts on specific problems could be coordinated by the Research Committee of NAIT.
One annual issue of the IT Insider should provide the latest enrollment/ graduation data as it pertains to
industrial technology programs. Several programs that have been recently successful in recruiting or increasing persistence rates should be featured to increase the exposure to the best practices.
References
Dennis, M. J. (1998), A Practical Guide to Enrollment and Retention
Management in Higher Education, Bergin & Garvey, Westport, Con-necticut.
Kelinson, J. W. (1998), Trends in College Degrees, Occupational Outlook Quarterly, pp. 23-27 Mittelhauser, M. (Summer, 1998), The
Outlook for College Graduates, 1996-2006: Prepare Yourself, Occupational Outlook Quarterly, pp. 3-9.
National Association of Industrial Technology (1988, 1993, and 1998), NAIT Baccalaureate Program Directory.
National Center for Education Statis-tics (1999), Digest of Education Statistics 1999.