The Use of Traces for Inlining in Java Programs
Borys J. Bradel and Tarek S. Abdelrahman
Edward S. Rogers Sr. Department of Electrical and Computer Engineering University of Toronto,
Toronto, Ontario, Canada M5S 3G4
{bradel,tsa}@eecg.toronto.edu
Abstract. We explore the effectiveness of using traces in optimization. We build a trace collection system for the Jikes Research Virtual Machine and create traces based on the execution of the SPECjvm98 and Java Grande benchmarks. We evaluate the use of traces for inlining in Jikes, and find that the use of traces leads to a decrease in execution time of 10%, when compared to providing similar information from Jikes’s adaptive system from a previous execution. This increase in performance is achieved at the expense of a code expansion of 47%. Further, this performance is slightly better than that achieved when using a greedy algorithm. We conclude that traces may be used effectively to perform inlining, although code expansion and trace collection overhead must be addressed.
1
Introduction
Traditional static compilation has shortcomings in that it cannot take advan-tage of information available at runtime to produce high-performance executa-bles. Such runtime information includes processor architecture, specific input data characteristics, and control flow patterns within the program. Feedback-directed systems can monitor the execution of a program to collect this runtime information and to use it to improve program performance.
Feedback-directed systems can be divided into two categories: offline and
online. One advantage of online systems is that the feedback loop is shorter, because the collected information is immediately used while a program is exe-cuting. The main advantage of offline systems is that they can analyze collected information more thoroughly because they do not compete with the executing program for resources. This may lead to more effective optimizations.
There have been many systems that use both online and offline feedback. These include systems created by Arnold et al [1], Whaley [2], and Suganuma, Yasue, and Nakatani [3]. One common aspect to these feedback directed systems is that they employ counters to collect information regarding which instructions and methods are frequently executed.
In this paper, we explore the effectiveness of usingtraces, which are sequences of unique basic blocks that are executed by a program [4], for optimization in an
offline feedback directed system. The use of traces may improve the opportunities for optimization because traces contain detailed inter-procedural information regarding which instructions are frequently executed, thus allowing optimizations to more aggressively focus on a subset of instructions. Specifically, we explore the benefits of traces in performing method inlining in Java programs. We have added a trace collection system, that we call BlueSpot, to the Jikes Research Virtual Machine, and we have evaluated the effectiveness of using the traces collected by BlueSpot to perform method inlining. We find that the use of traces leads to lower execution time, by 10%, compared to providing similar information from Jikes’s adaptive system from a previous execution. This is in spite of a code expansion of 47% and the associated potential degradation of cache performance. We also find that using traces to inline leads to slightly better performance compared to a greedy offline algorithm that employs counters [1]. Our trace collection system, however, has a high overhead and may increase execution time by 139% on average. We conclude that using traces is a viable option to explore, although code expansion and trace collection efficiency need to be addressed in the future. The remainder of this paper is organized as follows. Section 2 describes back-ground material. Section 3 describes our trace collection system. Section 4 de-scribes our trace based inlining strategy. Section 5 presents our experimental results. Section 6 contains related work. The paper ends with some concluding remarks and directions for future work in Section 7.
2
Background
2.1 Traces
A trace is a sequence of n unique basic blocks (b1, b2, . . . , bn) such that basic blocks b1, b2, . . . , bn are executed in sequential order during the execution of a program [4]. Blockb1is called thestartof the trace andbnis theendof the trace. The trace may contain any basic blocks of the program as long as the sequence corresponds to a path on the control flow graph. We use this definition because it expresses the traces that we collect more precisely, although other definitions exist, such as the definition given by Fisher [5].
An example of what traces look like is shown in Figure 1. The figure contains three copies a control flow graph, each with a different valid trace. The traces are (B0,B2,B1), (B1,B2,B3), and (B1,B2). In contrast, the sequence (B1,B2,B1) is not a valid trace because B1 appears twice, making the sequence not unique. The use of traces may improve the opportunities for optimization in three ways. First, traces can span multiple methods, thus facilitating inter-procedural analysis and extending the scope of analyses. Second, traces contain only the most frequently executed portions of a program and therefore can be used to only optimize frequently executed instructions saving compilation and optimization times. Finally, traces can be used to eliminate infrequently executed instructions from the control flow graph. The resulting control flow graph is simpler and therefore more amenable to optimization. However, since execution may go off
Trace 1 a+=i i++ a=0 i=0 goto B2 return a B0 B1 B2 B3 if (i<5) goto B1 Trace 2 a+=i i++ a=0 i=0 goto B2 return a B0 B1 B2 B3 if (i<5) goto B1 Trace 3 a+=i i++ a=0 i=0 goto B2 return a B0 B1 B2 B3 if (i<5) goto B1
Fig. 1.Traces mapped onto the control flow graph of a loop.
trace,fix-up codemust be added to ensure that when this occurs the program’s execution is still correct [6].
2.2 Inlining
Inlining reduces the overhead of invoking and returning from methods. It also allows inter-procedural analysis without a separate framework that performs analyses across multiple methods. However, inlining has to be performed selec-tively since it usually leads to an increase in code size and register pressure [1].
Approaches to decide where to perform inlining fall into two categories: static and dynamic. Static approaches base these decisions on the analysis of the source code of a program. Dynamic approaches make decisions based on profile infor-mation that is collected from the execution of a program. Counters are used at runtime to keep track of how often all the call sites are executed. These counters can then be used to identify which call sites should be inlined both in either an online or an offline feedback-directed system.
An example of inlining in an online system is presented by Suganuma, Yasue, and Nakatani [3]. They sample the executing program periodically to detect frequently executed methods and then instrument these methods to identify the frequently executed call sites. Once these call sites are determined, the system recompiles the appropriate methods using the additional inline information.
An example of inlining in an offline system is the greedy knapsack-type algo-rithm described by Arnold et al. [1]. The algoalgo-rithm uses counters to determine the number of invocations of each method. The algorithm selects the best call sites based on the ratio of the number of times that a method is invoked to the number of instructions that the program would increase by if the invoked
method is inlined. The call sites are selected one at a time, until a code expansion threshold is reached. Whenever a call site is selected, the ratios are modified to take into account what has already been selected. We compare the performance of this counter based offline feedback-directed system, along with the adaptive system in Jikes, to using traces for inlining.
3
Trace Collection
Traces are generated by a trace collection system (TCS) that monitors a pro-gram’s execution and collects traces based on this execution. The TCS starts recording a trace when occurrences of certain events exceed a specific threshold. These events are a backward taken branch, abackward taken jump, and atrace exit. These cases capture frequently executed instructions within loops [7]. An-other event that we use to start the recording of traces is areturn1. This allows traces to capture execution that uses recursion as well. We use the threshold value of 42, which was chosen arbitrarily, before collecting traces.
The recording stops when a backward branch or jump which corresponds to the end of a loop is taken. Recording also stops when the block that is about to be recorded is the start of a different trace or is already in the trace that is being recorded. These conditions ensure that beginnings of loops will correspond to trace starts and that traces do not overlap each other unnecessarily. Recording also stops if the recorded trace is too long for the recording buffer.
Once recording stops, the newly formed trace is stored in a buffer referred to as a trace cache. The TCS keeps track of trace starts that occur when a trace’s first basic block is executed and no other trace is executing, and trace exits, which occurs when the block that is executed is not the next block in the sequence of basic blocks on the trace. This allows us to treat trace exits as events that trigger trace recording. It is also possible to only include those returns that do not occur between trace starts and exits as events that can start recording traces. However, we treat all returns as events that can start recording traces.
The traces in the trace cache can be used in several different ways. They can be executed directly, they can be optimized and then executed, an approach taken by HP Dynamo [7], or they can be used to provide information for a feedback-directed system that does not use traces as the unit of compilation. We take this last approach.
3.1 Trace Collection Example
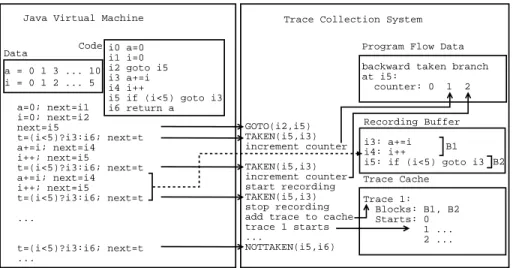
We demonstrate the operation of a TCS with an example. Figure 2 shows a JVM and a TCS. The TCS is linked to a JVM that executes the program shown in Figure 1. The JVM contains the program to execute as well as storage for the program’s variables. These variables’ values are modified as shown when the program is executed. The lower part of the figure shows the sequence of steps that the JVM performs when executing the program.
1 Alternatively we could have decided not to use returns, or to use invocations instead
GOTO(i2,i5) TAKEN(i5,i3) increment counter TAKEN(i5,i3) increment counter start recording TAKEN(i5,i3) stop recording add trace to cache trace 1 starts ...
NOTTAKEN(i5,i6)
Trace Collection System Java Virtual Machine
a=0; next=i1 i=0; next=i2 next=i5 t=(i<5)?i3:i6; next=t a+=i; next=i4 i++; next=i5 t=(i<5)?i3:i6; next=t a+=i; next=i4 i++; next=i5 t=(i<5)?i3:i6; next=t ... t=(i<5)?i3:i6; next=t ... a = 0 1 3 ... 10 i0 a=0 i1 i=0 i2 goto i5 i3 a+=i i4 i++ i5 if (i<5) goto i3 i6 return a i = 0 1 2 ... 5
Program Flow Data backward taken branch at i5:
counter: 0 1 2
Recording Buffer i3: a+=i i4: i++
i5: if (i<5) goto i3 Trace Cache Trace 1: Blocks: B1, B2 Starts: 0 1 ... 2 ... Data Code B1 B2
Fig. 2.Example of interaction between a JVM and a TCS.
The TCS contains three components: a set of event counters that are used to determine when recording should start, a recording buffer that is used to hold basic blocks as they are recorded, and a trace cache. The TCS knows when the control flow instructions are executed and acts upon the knowledge. In the figure, the left side of the TCS contains the actions of the TCS. Solid arrows show the link between individual control flow instructions and the resulting actions in the TCS. The dotted arrows indicate the recording of a trace. Within the TCS, solid arrows show the updating of the TCS’s components.
In Figure 2 the JVM executes basic blocks B1 and B2 repeatedly and the TCS keeps track of how often the backward branch between B2 and B1 is taken. When the backward branch is taken often enough2, the TCS starts recording a sequence of basic blocks (i.e. a trace). The TCS records the execution of the program until it detects that the next basic block is already in the recorded sequence. After recording is stopped the sequence of basic blocks, (B1,B2), is stored in the trace cache. After the trace (B1,B2) is saved, instruction i3 is executed and the system detects that i3 is in B1, which is the head of Trace 1. The TCS keeps track of this trace’s execution until the loop exits. This is shown by incrementing the number of times that the trace starts.
3.2 Jikes
The Jikes Research Virtual Machine (RVM) is an open source just-in-time (JIT) Java Virtual Machine (JVM) developed by IBM [8]. Jikes is a multi-threaded program written in Java. It is designed to deliver performance that is comparable to commercial JVMs. To achieve this, it uses a compile-only strategy and em-ploys two compilers: a baseline compiler that quickly translates Java bytecodes
into unoptimized native code and an optimizing compiler that takes longer, but generates optimized native code. Jikes has an adaptive system that monitors a program’s behaviour and determines which methods should be optimized to reduce overall execution time.
3.3 Trace Collection within Jikes
We modified Jikes’s baseline compiler to enable us to collect traces. We did so by making it produce additional native instructions for each control flow bytecode instruction. When the native code executes, these extra instructions also execute. The purpose of these instructions is to record information regarding the control flow of the program. The information consists of the type and location of the control flow instruction, as well as the location of its target. These locations are the methods and bytecode indices of the instructions.
BlueSpot consists of adata handler, alistener, and anorganizer threadin the adaptive system. The data handler stores the information generated by the added native instructions. In Jikes, the program’s main thread yields after executing for some period of time, and the adaptive system is then called. The adaptive system calls BlueSpot’s listener which then wakes up BlueSpot’s organizer thread. The organizer then processes the stored information.
BlueSpot must be able to infer the sequence of bytecode basic blocks that is executed based on the execution of native instructions. There are several prob-lems that need to be addressed when performing this task: the native instructions must contain very specific information, basic blocks must be identified, and the methods that these basic blocks are part of must be identified. The remainder of this section describes how we solve these three problems.
The native instructions are created with no knowledge of what actually hap-pens at run time, and when these instructions are executed they do not have access to any information regarding the original bytecode. Our added native code is therefore created to provide the bytecodes in the form of constant operands. For example, whether a branch is taken cannot be determined at compile time, while the bytecode index of the target is not known at runtime. Therefore we add native instructions that store the bytecode indices of the branch targets such that the correct target index will be stored both when the branch is taken and not taken. Furthermore additional native instructions are added to the be-ginning of each method so that the data handler contains information regarding each method’s invocation, which is not part of the bytecode.
The organizer processes the information in the data handler by inferring the program’s control flow from it, and then collecting traces based on the control flow. The data handler contains a list of control flow instruction–target pairs as well as a list of invoked methods. The organizer uses these lists to generate information that is equivalent to a sequence of executed basic blocks [9].
BlueSpot maintains a virtual call stack to keep track of invoke and return bytecodes to make its information as complete as possible. When a return is executed the organizer must identify the corresponding invoke and make the re-turn’s target the instruction immediately after the invoke. If there is no matching
invoke then the target cannot be identified and any trace recording is stopped [9]. There are several reasons for this virtual call stack to be incomplete: finite storage capacity, loss of information at thread switches and exceptions, arbitrary invocations of Java methods internal to Jikes, and the execution of optimized code that is not instrumented. Only the last leads to a serious degradation of collected trace information. We have addressed this by keeping track of the byte-code that is used to invoke optimized methods, which contains information that, although not completely accurate all the time, is accurate most of the time.
4
Inlining using Traces
Traces can also be used to perform inlining, either in an offline or an online system. Traces capture frequently executed paths of a program, and thus they contain the frequently executed call sites. These call sites can therefore be ex-tracted from traces and then used to perform inlining. Any invocation and return on a trace should have the corresponding call site inlined.
Before inlining can be performed a base method for compilation must be selected. When selecting the base methods to compile based on traces, we choose thetop methodsof all the traces. The top method is the method whose invocation is placed on the call stack before the invocation of any of the other methods that the trace is on. A trace does not have to start at a top method since the trace can start with several returns and then be in its top method. For the other inlining strategies that we describe in the following section, the base methods are the methods that all the call sites identified by the strategy are located in.
Inlining can result in a large code expansion. One approach of reducing this expansion is to useinline sequences[10]. An inline sequence is a list of call sites followed by a method. When a compiler is given a collection of inline sequences, which can be generated from traces, it can use the collection to determine which methods to inline. A method is inlined only if it is the last method in an inline sequence and all the predecessors in the sequence have already been inlined. For example, if a single trace exists that has the inline sequence “a(),b(),c()”, then
b()and c() will both be inlined into a()when a()is compiled, but c() will not be inlined into b()whenb()is compiled. Sinceb()is already inilined into
a(), it will never be called frequently, and spending extra compilation time on
b()is not necessary. We do not present the effects of using inline sequences in this paper, although we do so elsewhere [9].
5
Results
In this section we present our evaluation of using traces to perform inlining in an offline feedback-directed system. We explore the use of traces with two types of compilers: a JIT compiler and an ahead-of-time compiler. The JIT compiler decides which methods to optimize; the only information it receives from us identifies the call sites that should be inlined. This information is given to the
compiler during initialization of the system. The ahead-of-time compiler per-forms all the compilation during system initialization, and is given information regarding both what to compile and what to inline. Although we provide both compilers with offline information, JIT compilers can be used both in online and offline feedback-directed systems, while ahead-of-time compilers can be used only in offline feedback directed systems.
We measure the impact of using traces to perform inlining on program ex-ecution time, compile time, and code expansion for both types of compilers. In the context of a JIT system, we compare using: traces, the greedy algorithm of Arnold et al. [1], and information provided by the adaptive system. In the context of an ahead-of-time system, we ran out of memory when trying to com-pile several benchmarks with the greedy algorithm. We therefore only compare using traces with information provided by the adaptive system. We also examine the information provided to the compiler when it performs inlining. Finally, we present the overhead incurred when collecting traces.
5.1 Platform and Methodology
Our experiments are run on a 4 processor Dell PowerEdge 6600 with a 400MHz front-side bus and 2 GB of ECC DDR RAM. Each processor is a 1.4 GHz Pentium 4 Xeon processor with 512KB of L2 cache. The operating system used is RedHat 7.3 using Linux kernel 2.4.18.
We use Jikes RVM 2.0.3, which uses IBM’s class libraries version 2.11, and is compiled using gcc 3.0.4, the Sun JDK 1.3.1 bytecode compiler, and the Jikes bytecode compiler 1.13. Jikes is set to use a single processor, have assertions disabled, and have all the required methods precompiled. Furthermore we set the level of all optimizations performed at run-time to be “O1”. We have also instrumented Jupiter [11], a Java interpreter, to count the number of times that all call sites are executed. This allows us to collect only application based call sites, and we not have to deal with call sites that are part of Jikes itself. Jupiter is compiled using gcc 3.0.4, and uses both a modified version 0.04 of the classpath libraries and a modified version 6.1 of the Boehm garbage collector.
We use the single threaded programs found in the SPECjvm98 benchmarks as well as the single threaded level 3 Java Grande benchmarks with the smaller data sets. The benchmarks, along with the labels that we use for them in paren-thesis, are: 201 compress (201), 202 jess (202), 209 db (209), 213 javac (213), 222 mpegaudio (222), 228 jack (228), MolDyn (2a1), RayTracer (2a2), Euler (2a3), MonteCarlo (2a4), and Search (2a5). The first six benchmarks are part of SPECjvm98 and the latter five are part of the Java Grande benchmarks. All averages or means that we present in our results are arithmetic averages.
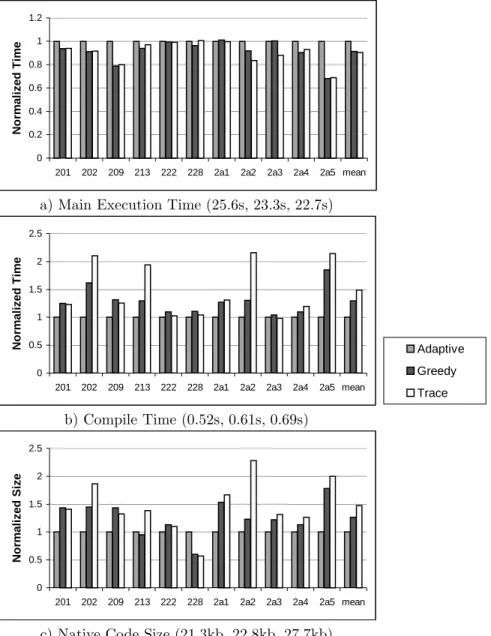
5.2 Inlining using Traces with a Just-in-Time Compiler
We use Jikes with the adaptive system, which identifies the methods to optimize at run-time. We give the adaptive system inline information collected in an offline manner from three different sources: a previous execution of the same program
using the adaptive system, the greedy algorithm presented in Section 2.23, and the collected traces. This is a fair evaluation of the relative benefit of using traces when inlining, since all three strategies are used in the same context.
The inline information consists of call sites for the optimizing compiler to inline. These are used as suggestions by the adaptive system, which may choose not to act on them. The experimental data points on our graph corresponding to the use of these sources are referred to as “Adaptive”, “Greedy”, and “Trace”, respectively. We have also used inline sequences [10], although due to the lack of space, we do not report on them here [9].
Figure 3 (a) shows the normalized execution time—which does not include compilation time—of the benchmarks when the adaptive system is given input from the above three sources. Figure 3 (b) shows the normalized compilation time, and Figure 3 (c) shows the normalized code expansion of the final optimized machine code. All of our data is calculated as a percentage relative to using the information provided by Jikes’s adaptive system. Each data point is based on the arithmetic mean of two consecutive runs using identical settings. The label of each graph contains the mean of the non-normalized values over all benchmarks. Using traces reduces execution time by 10% on average relative to using infor-mation from the adaptive system. There is however on average a code expansion and increase in the compilation time of 47% and 49% respectively. In compari-son, using the greedy algorithm reduces execution time by 9% with both a code expansion and increase in compilation time of 29%. The observed increased over-heads are a result of more call sites being inlined. Since the entire run-time is dominated by the execution time of the program, the overheads, resulting from compilation and increased code size, are insignificant (0.69s on average compared to 22.7s). The results show that both the greedy algorithm and traces perform equally well, and that traces slightly outperform the greedy algorithm.
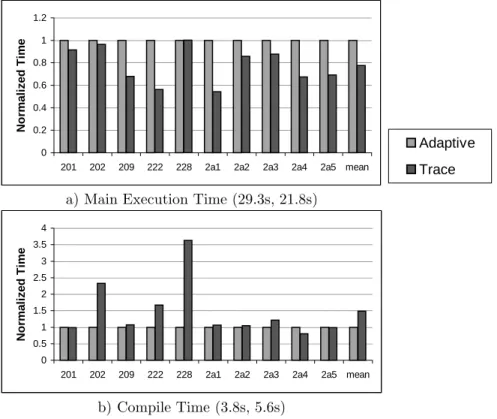
5.3 Inlining using Traces with an Ahead-of-Time Compiler
Jikes provides an optimization test harness that may be used to compile methods ahead of time. This allows us to avoid the limitations of a JIT compiler. We use the optimization test harness to perform all the compilation ahead of time. We specify two sets of methods for the optimizing compiler and the baseline compiler to compile. We also increase the code expansion thresholds that the optimizing compiler uses to decide to stop inlining. We have not done this in previous experiments because it has an impact on compilation time and is not feasible for a JIT system. We only use information from the adaptive system and the collected traces because using information based on the greedy algorithm causes the optimization test harness to run out of memory for three benchmarks ( 202 jess, 213 javac, and 228 jess). Furthermore, we omit 213 javac because using traces for it also leads to an out of memory error.
0 0.2 0.4 0.6 0.8 1 1.2
201 202 209 213 222 228 2a1 2a2 2a3 2a4 2a5 mean
N o rm a liz e d Tim e
a) Main Execution Time (25.6s, 23.3s, 22.7s)
0 0.5 1 1.5 2 2.5
201 202 209 213 222 228 2a1 2a2 2a3 2a4 2a5 mean
No rmal iz ed T ime Adaptive Greedy Trace b) Compile Time (0.52s, 0.61s, 0.69s) 0 0.5 1 1.5 2 2.5
201 202 209 213 222 228 2a1 2a2 2a3 2a4 2a5 mean
N o rm a liz e d S iz e
c) Native Code Size (21.3kb, 22.8kb, 27.7kb)
Fig. 3.Inlining using the adaptive system.
Figure 4 (a) shows the normalized execution time4 of the benchmarks when the adaptive system is given input generated using the adaptive system and 4 We execute each benchmark both with and without logging. We take the minimum
of the two values collected because for 209 db and 2a5 Search some of the execution with logging take significantly less time than the ones without logging.
traces from Jikes. Figure 4 (b) shows the normalized time used by the opti-mization test harness, which is computed as the user time used by Jikes minus the execution time. We refer to this as compile time because it includes time spent compiling using both the baseline compiler and optimizing compiler, even though it also includes the start up and shut down time of Jikes. The label of each graph contains the non-normalized value for the mean over all benchmarks.
0 0.2 0.4 0.6 0.8 1 1.2
201 202 209 222 228 2a1 2a2 2a3 2a4 2a5 mean
No rmal iz ed T ime Adaptive Trace a) Main Execution Time (29.3s, 21.8s)
0 0.5 1 1.5 2 2.5 3 3.5 4
201 202 209 222 228 2a1 2a2 2a3 2a4 2a5 mean
No rmal iz ed T ime b) Compile Time (3.8s, 5.6s)
Fig. 4. Inlining with ahead-of-time compilation.
Using traces leads to a 22% reduction in execution time on average, with all the benchmarks having some reduction in execution time, except for 228 jack, which exhibits a 0.1% increase in execution time. Furthermore, the majority of the benchmarks have a relatively small increase in compilation overhead, and therefore a reduction in overall program run-time. Nonetheless, two of the benchmarks, 202 jess and 228 jack, stand out; they have an increase in compile time of over 100%, which results in an increase in overall program run-time. These results illustrate that inlining using traces leads to a reduction in execution time, but there are situations where the inlining can be too aggressive.
5.4 Details of the Provided Inline Information
To provide insight into the results that we have presented we have looked at the information that we use as input in our experiments. The information consists of sets of call sites to inline and sets of methods to compile using the optimizing compiler. We present this information for the three different sources that we use: the adaptive system (A), the greedy algorithm (G), and the collected traces (T). Table 1 (a) contains the number of compilation requests and Table 1 (b) contains the number of inline requests made under different configurations. The adaptive system has on average only 40 compilation requests, which is less than the other configurations. Furthermore the collected traces have 88 requests on average, which is comparable to the greedy algorithm, which has 98 requests. Requests based on the adaptive system are less numerous because the adaptive system acts as a JIT and is therefore limited in the amount of optimization that it can perform. The limits are imposed by internal checks in the system that ensure that only a small amount of time is spent outside of the main execution thread. The traces and greedy algorithm on the other hand are not limited in this way and therefore generate more requests that lead to code expansion.
A G T 201 12 107 12 202 37 90 105 209 5 85 30 213 207 322 368 222 44 88 130 228 17 138 121 2a1 7 86 17 2a2 32 16 36 2a3 30 77 46 2a4 38 62 87 2a5 13 3 11 mean 40 98 88 a) Total Methods A G T 201 15 64 11 202 74 186 190 209 0 58 26 213 547 696 683 222 50 204 164 228 7 177 204 2a1 1 15 22 2a2 63 44 71 2a3 73 48 94 2a4 42 98 99 2a5 10 14 16 mean 80 146 144 b) Total Inline Requests
Table 1.Requests to direct compilation decisions.
Different benchmarks also have different numbers of requests. 213 javac has three times more requests than any of the other benchmarks. The large number of requests is the reason for the optimization test harness running out of memory when trying to compile it. Furthermore, we believe that because of the large number of inline requests for 202 jess and 228 jack, these two benchmarks are not optimized effectively and incur large overheads when the optimization test harness is used. Finally, 228 jack’s execution is dominated by a single trace [9]. It is likely that all the methods that the trace is on are requested to be inlined
by the adaptive system, which only asks for 7 methods to be inlined, and that there is little benefit to optimizing other methods.
5.5 Trace Collection Overhead
We have not designed BlueSpot with efficiency as a high priority. This is accept-able because we use an offline system, which does not have a direct effect on the run-time performance of a program. Nonetheless, BlueSpot can be used as an online system to both collect traces and optimize the executing program based on them. We therefore present the overheads of BlueSpot since this information may be useful when collecting traces in an online system.
When optimization is disabled (i.e. the adaptive system is not allowed to perform inlining) there is an average increase in the main thread’s execution time of 22% associated with collecting information in the data handler, as op-posed to the information that the adaptive system collects. Due to our inefficient implementation, BlueSpot’s organizer thread frequently executes just as long as the main execution thread. The time overhead of the entire system is on average approximately 139% larger than that of the adaptive system.
When optimization is enabled the main execution thread takes 14% more time with BlueSpot than with the adaptive system. This increase has three causes. The first is the overhead of storing information in the data handler. The second is that unoptimized methods may execute for a longer period of time before they are optimized, because the trace system is slower and takes longer to make decisions than the adaptive system. The third is that the two systems may select different methods to optimize. When optimization is enabled the time overhead of the organizer thread decreases from 117% to 56%. This decrease is mainly due to the overhead of the organizer thread decreasing to less than 25% for 201 compress, 209 db, 2a1 (MolDyn), 2a2 (RayTracer), and 2a5 (Search)5. These results show that an online system based on traces may be effective, since the time spent in the main execution thread increases only 14% when BlueSpot is used. However, the time overhead of the entire system is on average 70%. If traces are to be used in an online system this overhead must be reduced.
6
Related Work
Fisher [5] was the first to introduce traces and to use them for instruction scheduling. His work has been extended by many others including Ellis [6, 12], Howland et al [13], Chang and Hwu [14], Hwu et al [15], and Lowney et al [6] at Multiflow. Static trace scheduling involves selecting traces at compile time and scheduling instructions using these traces. Our work differs from this approach in that we collect traces at run time and base our decisions on these traces as opposed to traces created at compile time.
5 The results contain test runs for which the trace system optimized 2a5 (Search)
effectively, although we have found that at times the trace system did not optimize this benchmark effectively.
The HP Dynamo [7, 4] and DynamoRIO [16, 17] systems, which are designed for the PA-RISC architecture and the IA-32 architecture respectively, interpret a program while collecting profile information. When frequently executed traces are detected, they are compiled and optimized. These traces can then be executed instead of interpreted. Mojo is a similar system by Chen et al [18] that uses a similar scheme on Windows 2000. Our work differs from these approaches because our traces are based on Java bytecodes while these systems use traces based on native machine code instructions. This allows us to abstract traces away from a specific architecture.
Whaley differentiates between hot (frequently executed) and cold (infre-quently executed) basic blocks to reduce the amount of compilation [2]. Arnold et al [1] have looked at inlining based on static heuristics versus inlining based on a profile based optimum cost/benefit strategy. Suganuma, Yasue, and Nakatani [3] examine the benefits of inlining using imperfect information in a feedback directed online system. Hazelwood and Grove [10] have looked at reducing the code explosion associated with inlining by being selective about where they per-form inlining. Krintz looks at using bytecode annotations to perper-form inlining in a feedback directed offline system [19]. Our work differs from the feedback directed systems in Java because we use a different representation of feedback information, namely traces.
7
Conclusion
We have created a trace collection system for Jikes, and examined the use of traces when performing inlining in an offline feedback-directed manner. We have shown that traces are useful for this purpose. We have compared traces to several different inlining algorithms and shown that they are as good as, and in some cases better than, the alternate inlining algorithms. In particular we have found that using system dependent traces leads to a 10% decrease in execution time in spite of a code expansion of 47% when used in the adaptive system relative to using the information in the adaptive system itself. This performance is even slightly better than that achieved when using a greedy algorithm. Our work is only a starting point that has shown that traces can be used effectively in offline feedback-directed systems.
There are many different directions in which this work can be further ex-panded in the future. First, code expansion is quite large and needs to be re-duced. Second, traces can be used in an online feedback-directed system. It is unclear whether trace collection overhead will make this approach feasible. Al-though we did not design our TCS with efficiency in mind, the overhead of the TCS is large. Work needs to be performed to efficiently collect and use traces. Third, traces should be applied to different optimizations. The methods that have inlining performed based on traces are a natural basis for the optimiza-tions. One of the challenges that must be addressed is that optimizations are affected by many different factors and that it is hard to quantify the effect of any individual factor.
References
1. Matthew Arnold et al: A comparative study of static and profile-based heuristics for inlining. In: Proceedings of SIGPLAN Workshop on Dynamic and Adaptive Compilation and Optimization. (2000) 52–64
2. Whaley, J.: Partial method compilation using dynamic profile information. In: Conference on Object-Oriented Programming Systems, Languages, and Applica-tions (OOPSLA). (2001) 166–179
3. Suganuma, T., Yasue, T., Nakatani, T.: An empirical study of method inlining for a Java Just-In-Time compiler. In: Proceedings of USENIX 2nd Java Virtual Machine Research and Technology Symposium (JVM’02). (2002) 91–104
4. Bala, V., Duesterwald, E., Banerjia, S.: Transparent dynamic optimization: The de-sign and implementation of dynamo. HP Laboratories Technical Report HPL1999 -78 (1999)
5. Fisher, J.A.: Trace scheduling : A technique for global microcode compaction. IEEE Transactions on ComputersC-30(1981) 478–490
6. Lowney, P.G.: The multiflow trace scheduling compiler. The Journal of Supercom-puting7(1993) 51–142
7. Bala, V., Duesterwald, E., Banerjia, S.: Dynamo: a transparent dynamic optimiza-tion system. ACM SIGPLAN Notices35(2000) 1–12
8. Arnold, M., Fink, S., Grove, D., Hind, M., Sweeney, P.F.: Adaptive optimization in the Jalape˜no JVM. ACM SIGPLAN Notices35(2000) 47–65
9. Bradel, B.J.: The use of traces in optimization. Master’s thesis, University of Toronto (2004)
10. Hazelwood, K., Grove, D.: Adaptive online context-sensitive inlining. In: Proceed-ings of International Symposium on Code Generation and Optimization. (2003) 253–264
11. Doyle, P.: Jupiter: A modular and extensible Java virtual machine framework. Master’s thesis, University of Toronto (2002)
12. Ellis, J.R.: A Compiler for VLIW Architectures. PhD thesis, Yale University (1984)
13. Howland, M.A., Mueller, R.A., Sweany, P.H.: Trace scheduling optimization in a retargetable microcode compiler. In: Proceedings of the 20th Microprogramming Workshop (MICRO-20). (1987) 106–114
14. Chang, P.P., mei W. Hwu, W.: Trace selection for compiling large c application programs to microcode. In: Proceedings of the 21st Annual Workshop on Micro-programming and Microarchitecture. (1988) 21–29
15. Wen-mei W. Hwu et al: The superblock: An effective technique for vliw and superscalar compilation. Journal of Supercomputing7(1993) 229–248
16. Bruening, D., Duesterwald, E., Amarasinghe, S.: Design and implementation of a dynamic optimization framework for windows. In: Proceedings of 4th ACM Workshop on Feedback-Directed and Dynamic Optimization (FDDO-4). (2001) 17. Bruening, D., Garnett, T., Amarasinghe, S.: An infrastructure for adaptive
dy-namic optimization. In: Proceedings of the international symposium on Code generation and optimization. (2003) 265–275
18. Chen, W.K., Lerner, S., Chaiken, R., Gillies, D.M.: Mojo: A dynamic optimization system. In: Proceedings of 3rd ACM Workshop on Feedback-Directed and Dynamic Optimization (FDDO-3). (2000)
19. Krintz, C.: Coupling on-line and off-line profile information to improve program performance. In: Proceedings of International Symposium on Code Generation and Optimization. (2003) 69–78