NetFinder Insight Series - Network Security
Market Snapshot Report
26/09/2012 Version: 1.0
Rhetorik Solutions Released by: Research
NetFinder Insight Series - Network Security Author: Clair Lester
Date: 26/09/2012 MDMS-117-996 – Version: 1.0 Page I
NetFinder Insight Series - Network Security
Released by: Research Document Number: MDMS-117-996
Author: Clair Lester Version: 1.0
Issued by: Rhetorik Solutions Ascot House Finchampstead Road Wokingham RG40 2NW United Kingdom UK Registered No. 2958622
Copyright © Rhetorik Limited (2012) All rights reserved
Rhetorik Solutions Released by: Research
NetFinder Insight Series - Network Security Author: Clair Lester
Date: 26/09/2012 MDMS-117-996 – Version: 1.0 Page II
Table of contents
1.
INTRODUCTION ... 1
2.
RESEARCH METHODOLOGY ... 1
3.
PROFILE OF END-USER ESTABLISHMENTS ... 2
3.1 Profile by Geographic Region ... 2
FIGURE 1: REGIONAL BREAKDOWN
... 2
3.2 Profile by Vertical Market ... 3
FIGURE 2: VERTICAL MARKET BREAKDOWN
... 3
4.
ANTI-VIRUS SOFTWARE ... 4
4.1 Sites using Anti-virus Software ... 4
4.2 Anti-virus Software – Supplier Market Share ... 4
FIGURE 3: ANTI-VIRUS SOFTWARE – SUPPLIER MARKET SHARE
... 4
4.3 Anti-virus Software – Products In Use... 5
5.
FIREWALLS ... 5
5.1 Sites using Firewalls ... 5
5.2 Firewalls – Supplier Market Share ... 6
FIGURE 4: FIREWALL – SUPPLIER MARKET SHARE
... 6
5.3 Firewalls – Products in Use ... 7
6.
INTRUSION DETECTION ... 8
6.1 Sites using Intrusion Detection ... 8
FIGURE 5: USERS OF SECURITY – INTRUSION DETECTION
... 8
6.2 Intrusion Detection – Supplier Market Share ... 10
FIGURE 6: INTRUSION DETECTION – SUPPLIER MARKET SHARE
... 10
6.3 Intrusion Detection – Products in Use ... 11
FIGURE 7: INTRUSION DETECTION – PRODUCTS IN USE
... 11
7.
ABOUT RHETORIK SOLUTIONS ... 12
8.
NETFINDER INSIGHT SERIES – MARKET SNAPSHOT REPORTS ... 12
Rhetorik Solutions Released by: Research
NetFinder Insight Series - Network Security Author: Clair Lester
Date: 26/09/2012 MDMS-117-996 – Version: 1.0 Page 1 / 12
1.
Introduction
Welcome to the first of Rhetorik Solution’s new series of Snapshot reports based on analysis of a sample of research data collected through the ongoing NetFinder continuous research programme.
This report “Network Security” provides a summary analysis of a range of key software categories used within these organisations, and the sample was drawn from a base of more than 25,000 end-user
establishments. The analysis for each category is drawn from a subset of the available data. A similar report covering servers and security was produced by Rhetorik in 2006/7 which will be drawn upon for comparison.
An outline of the research methodology applied in the NetFinder research programme is given in the next section of this report, followed by a profile of the end-user establishments covered in the research. The subsequent sections of this report contain summary analysis of research covering anti-virus software, firewalls and intrusion detection, to provide insights into the current user-base of key security offerings in the UK and Ireland.
2.
Research Methodology
Rhetorik Solutions’ dedicated team of NetFinder telephone researchers continuously monitor the products and services used by more than 25,000 ICT end-user sites in the UK and Ireland. The research focuses primarily on ICT decision-making establishments with more than 20 PCs on site. The inclusion of all vertical market sectors ensures coverage of all major ICT investment.
The team collects and regularly updates information on the use of a broad range of products, services, brands and suppliers at each site, as well as maintaining information on the core details such as site name, address and key contact details. This is probably the most comprehensive and up-to-date continuous tracking survey of the ICT end-user base in these countries today. Every effort is made to call each site at least every 6 months to ensure that core information is up-to-date, and the team is tasked with gathering and updating full technical profile details on an annual basis
The information is gathered by our researchers through primary research, mainly by application of a structured questionnaire using computer-aided telephone interview (CATI) techniques. An online survey is used when specifically requested by a respondent. Technical details are gathered from key ICT decision-makers at each site, typically IT and Telecoms managers and other senior staff directly responsible for purchasing and implementing the actual products and services in use.
The research data is held in a comprehensive database that can be used by Rhetorik Solutions analysts for ad-hoc analysis of products, services and suppliers in use as well as for tracking of the uptake of these same products, services, suppliers and brands over time. The data in this report is from sites profiled within the last three years.
Rhetorik Solutions Released by: Research
NetFinder Insight Series - Network Security Author: Clair Lester
Date: 26/09/2012 MDMS-117-996 – Version: 1.0 Page 2 / 12
3.
Profile of End-user Establishments
This chapter provides a summary profile by geographical region and key vertical market sector for sites extracted from the NetFinder continuous research programme and used as the basis for top level analysis in this report.
3.1 Profile by Geographic Region
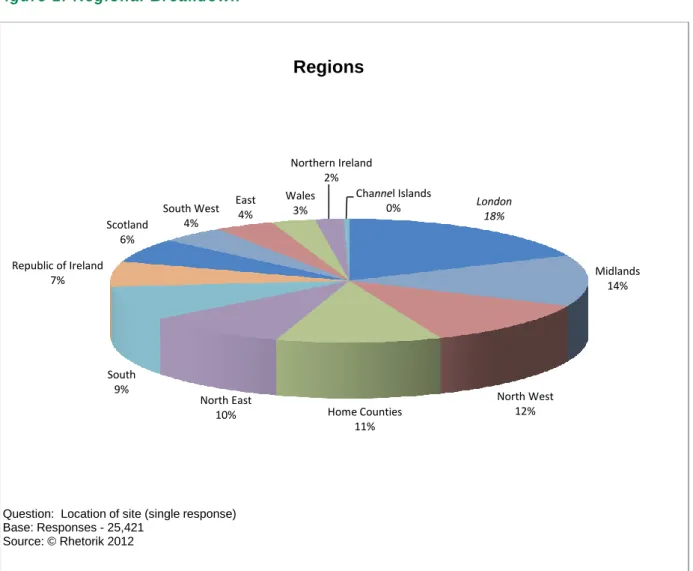
93% of the IT and Telecoms end-user sites analysed were based in the UK, with the remaining 7% in the Republic of Ireland. The regional profile of these user establishments is given in Figure 1.
Figure 1: Regional Breakdown
The chart illustrates a broad sample distribution across all regions of the UK. The user-base for these technologies is clearly well-distributed throughout the country.
The 7% of sites based in the Republic of Ireland are mainly concentrated around Dublin and in the South-West of the country.
London 18% Midlands 14% North West 12% Home Counties 11% North East 10% South 9% Republic of Ireland 7% Scotland 6% South West 4% East 4% Wales 3% Northern Ireland 2%
Channel Islands 0%
Question: Location of site (single response) Base: Responses - 25,421
Source: © Rhetorik 2012
Rhetorik Solutions Released by: Research
NetFinder Insight Series - Network Security Author: Clair Lester
Date: 26/09/2012 MDMS-117-996 – Version: 1.0 Page 3 / 12
3.2 Profile by Vertical Market
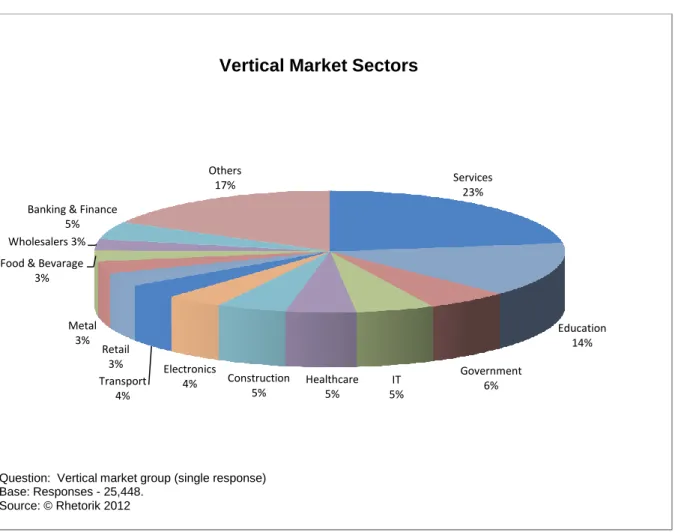
By vertical market sector, the ICT end-user base is distributed across all sectors of the economy.
Figure 2: Vertical Market Breakdown
Services and Education have the largest market share with 23% and 14% respectively. These are followed by a broad distribution of different market sectors such as Government, IT, Healthcare and Contruction. Significant sectors in the “Others” sector include the publishing, mechanical, mineral and telecomunications industries. Services 23% Education 14% Government 6% IT 5% Healthcare 5% Construction 5% Electronics 4% Transport 4% Retail 3% Metal 3% Food & Bevarage
3% Wholesalers 3%
Banking & Finance 5%
Others 17%
Question: Vertical market group (single response) Base: Responses - 25,448.
Source: © Rhetorik 2012
Rhetorik Solutions Released by: Research
NetFinder Insight Series - Network Security Author: Clair Lester
Date: 26/09/2012 MDMS-117-996 – Version: 1.0 Page 4 / 12
4.
Anti-virus Software
In this chapter we explore the application of anti-virus software across the sample.
4.1 Sites using Anti-virus Software
Sites were first asked if they used any anti-virus products.
Anti-virus software is almost universally applied in a business environment today. Across the entire sample only 4 respondents said that they had no such software in use, and only 2 respondents were unwilling to divulge whether or not they use it.
Recently IT managers have become more open about some aspects of their core network security, and more willing to divulge their use of this software with nearly a third (28%) of the base now providing details on the AV software in use. In 2006 9% of respondents would not disclose this information or claimed not to know.
4.2 Anti-virus Software – Supplier Market Share
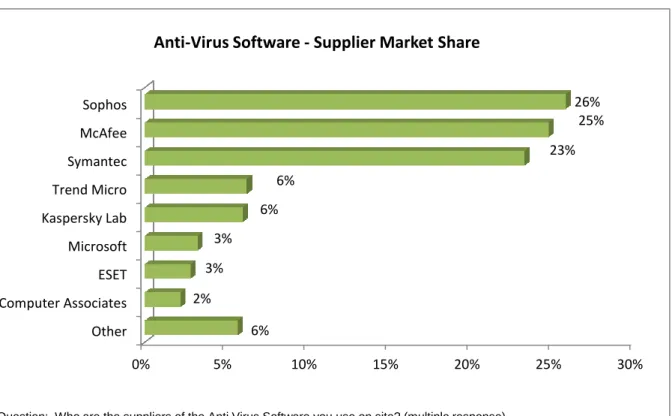
Those using anti-virus products were further questioned regarding the supplier in use. An analysis of these suppliers and their share (in terms of mentions in use) is given in Figure 3.
Figure 3: Anti-virus Software – Supplier Market Share
0% 5% 10% 15% 20% 25% 30% Other Computer Associates ESET Microsoft Kaspersky Lab Trend Micro Symantec McAfee Sophos 6% 2% 3% 3% 6% 6% 23% 25% 26%
Anti-Virus Software - Supplier Market Share
Question: Who are the suppliers of the Anti Virus Software you use on site? (multiple response) Base: Responses - 7,192 reported mentions of suppliers in use .
Rhetorik Solutions Released by: Research
NetFinder Insight Series - Network Security Author: Clair Lester
Date: 26/09/2012 MDMS-117-996 – Version: 1.0 Page 5 / 12
McAfee, Sophos and Symantec were clearly the dominant suppliers of the anti-virus software currently in use. Those 3 suppliers have more than 74% of the market share and were also the dominant three suppliers in 2006. However McAfee’s market share of the installed base has declined from 33% in 2006 to 25% in 2012.
The Eastern European suppliers ESET and Kaspersky Lab have risen from nowhere over the past 6 years and now have a substantial foothold in the market.
4.3 Anti-virus Software – Products In Use
User organisations were also asked about the specific products in use. However, it is clear that in this market users were much more likely to know the suppliers of this software than the names of the actual products installed.
Interestingly, Norton Antivirus was the most frequently mentioned product name, which perhaps says something about the strength of recall of this Symantec product name in the minds of its users. This may have been influenced by its distinctive branding, packaging and pre-installation to PCs over the past two decades.
5.
Firewalls
This chapter analyses the use firewalls across the IT/Telecoms user base.
5.1 Sites using Firewalls
Sites were asked about their application of a firewall.
As with anti-virus software, firewalls are almost universal in use within the business world. Less than 0.1 % of sites declared that they did not have a firewall protecting their network. Uncertainty was very low with only a similarly very low proportion not willing to divulge this information or unable to confirm.
Again, following the pattern with anti-virus software, users were now much more willing to disclose their use of this software than when we analysed the user base in 2006. At that time, although only 2% reported non-use of firewalls around 27% of all IT managers were not prepared to disclose the information or were unable to confirm.
Rhetorik Solutions Released by: Research
NetFinder Insight Series - Network Security Author: Clair Lester
Date: 26/09/2012 MDMS-117-996 – Version: 1.0 Page 6 / 12
5.2 Firewalls – Supplier Market Share
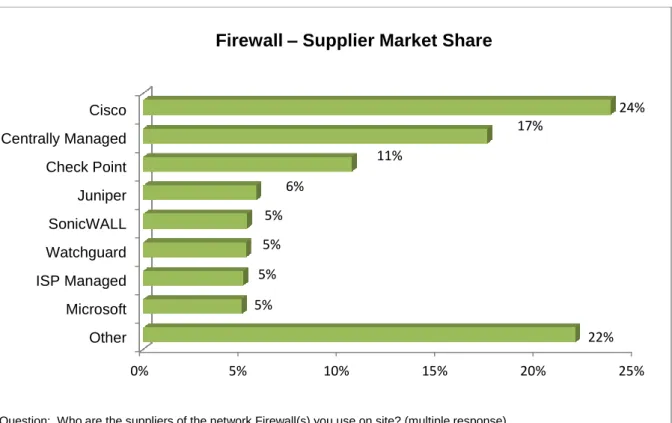
Details of the firewall suppliers in use and their share (in terms of mentions in use) are provided in Figure 4.
Figure 4: Firewall – Supplier Market Share
Cisco has remained the dominant firewall supplier with 24% of the market share; this percentage has remained fairly stable since 2006 when it was 25%. However, Check Point’s share of the user base has dropped from 21% in 2006 to 11% currently.
Interestingly, the percentage of respondents with centrally managed firewalls has increased substantially since 2006 (from 9% to 17%). This category includes educational establishments whose firewalls are managed by the Local Educational Authority, as well as those managed by County Councils and at corporate head offices.
Firewalls externally managed by an ISP have also increased in prominence. In 2006 only 1.6% of users in our sample reported an ISP managed firewall but that proportion has now increased to 5% of the total.
0% 5% 10% 15% 20% 25% Other Microsoft ISP Managed Watchguard SonicWALL Juniper Check Point Centrally Managed Cisco 22% 5% 5% 5% 5% 6% 11% 17% 24%
Firewall – Supplier Market Share
Question: Who are the suppliers of the network Firewall(s) you use on site? (multiple response) Base: Responses - 6,730 reported mentions of suppliers' in use .
Rhetorik Solutions Released by: Research
NetFinder Insight Series - Network Security Author: Clair Lester
Date: 26/09/2012 MDMS-117-996 – Version: 1.0 Page 7 / 12
5.3 Firewalls – Products in Use
When questioned about specific products in use, recall of brands was again much stronger than product names.
Responses included a mix of product and brand names, but the Cisco PIX and ASA product offerings were significant amongst them and clearly exhibited strong recall amongst their users.
Rhetorik Solutions Released by: Research
NetFinder Insight Series - Network Security Author: Clair Lester
Date: 26/09/2012 MDMS-117-996 – Version: 1.0 Page 8 / 12
6.
Intrusion Detection
The final chapter of this report provides a summary analysis of the use of intrusion detection network security.
6.1 Sites using Intrusion Detection
IT managers and other senior staff were asked about the use of intrusion detection security within their networks.
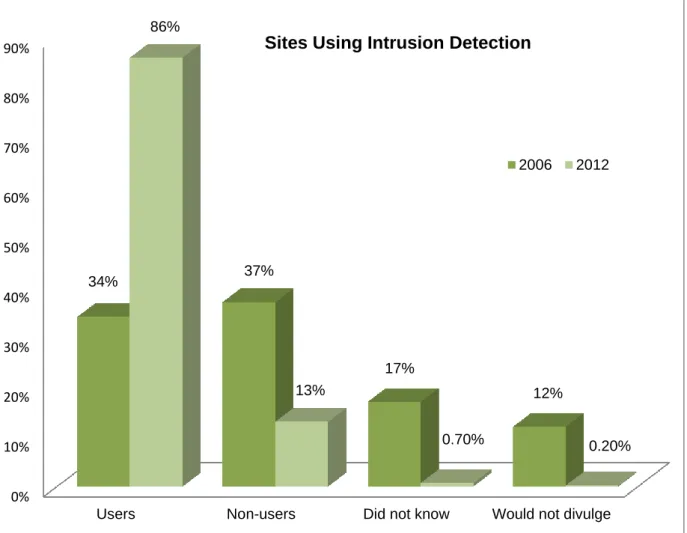
Figure 5: Users of Security – Intrusion Detection
0% 10% 20% 30% 40% 50% 60% 70% 80% 90%
Users Non-users Did not know Would not divulge
34% 37% 17% 12% 86% 13% 0.70% 0.20% 2006 2012
Question: Do you use Intrusion Detection security on your network? (single response)
(Note: "Did not know" and "Would not divulge" includes respondents unable or unwilling to divuldge name of supplier) Base: Responses 2006 - 8,245
Base: Responses 2012 - 5,910 Source: © Rhetorik 2012
Rhetorik Solutions Released by: Research
NetFinder Insight Series - Network Security Author: Clair Lester
Date: 26/09/2012 MDMS-117-996 – Version: 1.0 Page 9 / 12
The use of intrusion detection has increased significantly since the last report. In 2006 only 34% of respondents confirmed they were using intrusion detection, whereas now 86% definitely are.
Respondents have become more comfortable with disclosing their use of intrusion detection in the intervening period. In 2006, 29% of respondents either did not know or were unwilling to divulge if they were using it; this figure has now dropped to less than 1%.
Rhetorik Solutions Released by: Research
NetFinder Insight Series - Network Security Author: Clair Lester
Date: 26/09/2012 MDMS-117-996 – Version: 1.0 Page 10 / 12
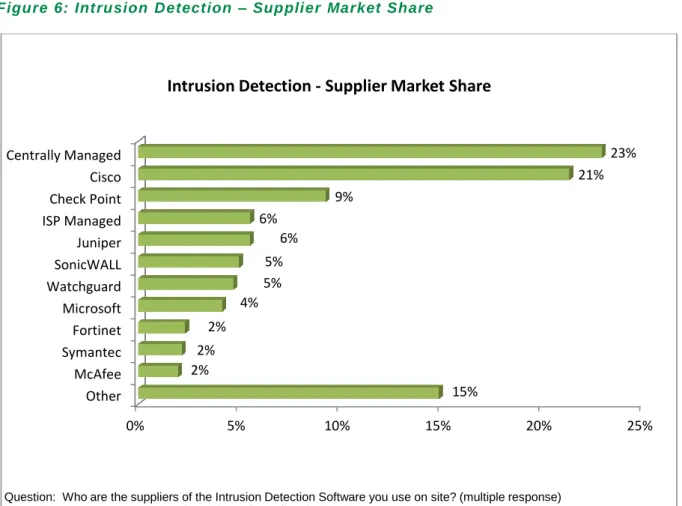
6.2 Intrusion Detection – Supplier Market Share
Named suppliers at a significant sample of user sites are given below.
Figure 6: Intrusion Detection – Supplier Market Share
The largest group of responders stated that their intrusion detection was managed centrally. This was usually managed at the firm’s head office, or by the Local Educational Authority or County Council in the case of education or local government establishments. Centrally managed intrusion detection was also important when analysed in 2006, but has increased in the intervening period from 17% to 23% of the user base.
ISP Managed has also grown significantly over this period, from 1.3% in 2006 to 6% of current users.
As with firewalls the key suppliers for the installed base of intrusion detection were Cisco and Checkpoint. This was also the case in 2006. However, whereas Cisco has maintained its position the significance of Checkpoint appears to have diminished somewhat over the past 6 years (falling from 17% of mentions in the user base to 9% today).
Juniper has increased its market position, from less than 2% in 2006 to 6% in the current analysis.
0% 5% 10% 15% 20% 25% Other McAfee Symantec Fortinet Microsoft Watchguard SonicWALL Juniper ISP Managed Check Point Cisco Centrally Managed 15% 2% 2% 2% 4% 5% 5% 6% 6% 9% 21% 23%
Intrusion Detection - Supplier Market Share
Question: Who are the suppliers of the Intrusion Detection Software you use on site? (multiple response) Base: Responses - 5,245 reported mentions of suppliers in use .
Rhetorik Solutions Released by: Research
NetFinder Insight Series - Network Security Author: Clair Lester
Date: 26/09/2012 MDMS-117-996 – Version: 1.0 Page 11 / 12
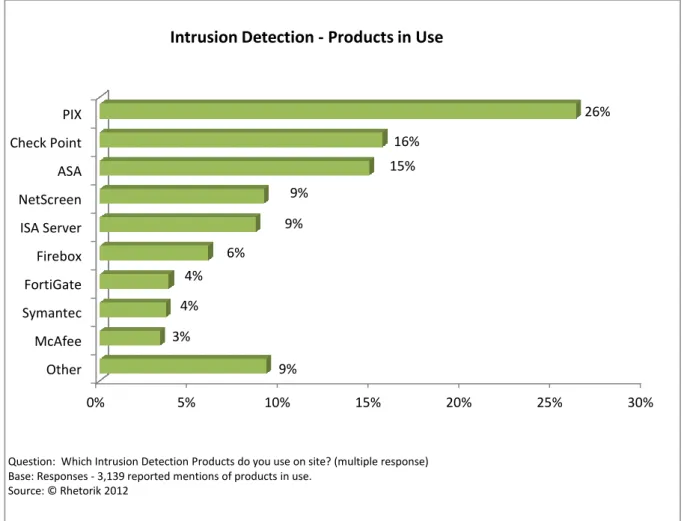
6.3 Intrusion Detection – Products in Use
An analysis of respondent product recall for Intrusion Detection in use is given in Figure 11.
Figure 7: Intrusion Detection – Products in Use
As can be seen from the above, the response was a mixture of specific products and brand names for different suppliers.
These results show some consistency with the supplier analysis, in that Cisco (PIX and ASA), Checkpoint and Juniper (Netscreen) are the most prominent. The shares do not correlate however and the respondent base is lower, as many respondents were unable to recall the specific product names in use.
The researchers have reported a trend away from PIX towards ASA in recent years, and Cisco will end their support of the older PIX product in 2013.
As with the other types of network security, brand is much stronger than product recall in this market, and the analysis only serves to identify those products that are best known by their user base.
0% 5% 10% 15% 20% 25% 30% Other McAfee Symantec FortiGate Firebox ISA Server NetScreen ASA Check Point PIX 9% 3% 4% 4% 6% 9% 9% 15% 16% 26%
Intrusion Detection - Products in Use
Question: Which Intrusion Detection Products do you use on site? (multiple response) Base: Responses - 3,139 reported mentions of products in use.
Rhetorik Solutions Released by: Research
NetFinder Insight Series - Network Security Author: Clair Lester
Date: 26/09/2012 MDMS-117-996 – Version: 1.0 Page 12 / 12
7.
About Rhetorik Solutions
Rhetorik Solutions delivers market intelligence and market research services focused exclusively on the IT and Telecoms industries. To meet the challenges of these fast-moving and highly competitive markets our clients need a consultancy that truly understands the issues and concerns that drive them.
With an in-house team of highly trained researchers working exclusively in these markets, we have a particular focus on end user research and employ a range of quantitative and qualitative research techniques including: Face-to-face Interviews Focus Groups Telephone Interviews Web-based Surveys Research Panels
to provide a unique portfolio of research services.
Rhetorik Solutions is part of Matrix Solutions www.matrixsolutions.co.uk and are also a founder member of the EMIG (European Market Intelligence Group) www.emi-group.com.
8.
NetFinder Insight Series – Market Snapshot Reports
Rhetorik will be releasing a new series of these snapshot reports over the coming months that will include analysis and insight within the following ICT segments:
Network Security
PCs & LAN
Servers & Operating Systems
Key Business Applications
WAN & Telecoms
providing you with powerful insights to help market your company’s solutions more effectively.
9.
What should I do next?
For more details about our NetFinder ICT Marketing Database or Business Intelligence & Research Solutions, please visit http://www.rhetoriksolutions.co.uk or contact Rick Paskins, Group Research Director on +44 (0)1189 898580 or at mailto:[email protected]
Rhetorik Solutions Telephone: +44 (0)1189 898580
Ascot House Fax: +44 (0)1189 898590
Finchampstead Road Wokingham
Berkshire RG40 2NW United Kingdom