PHANTOM DOSIMETRY AND IMAGE QUALITY OF GALILEOS COMFORT PLUS CONE BEAM COMPUTED TOMOGRAPHY
Ross D. Hunter
A thesis submitted to the faculty at the University of North Carolina at Chapel Hill in partial fulfillment of the requirements for the degree of Master of Science in the School of Dentistry
(Orthodontics).
Chapel Hill 2014
ABSTRACT
Ross D. Hunter: Phantom Dosimetry and Image Quality of Galileos Comfort PLUS Cone Beam Computed Tomography
(Under the direction of John B. Ludlow)
Introduction: Increasing use of CBCT in many aspects of dental treatment has been associated with an elevated concern for the long-term risks of x-ray exposure, especially in adolescent patients. An industry response to this has been to offer lower-exposure and collimated field scanning options. Methods: Effective doses resulting from various combinations of field size/location (FOV), number of image frames, and mAs settings were calculated for ATOM child and adult anthropomorphic phantom exposures using the Galileos Comfort Plus CBCT unit. Optical Stimulated Dosimetry was used with a previously validated protocol. Image quality data was acquired with the Quart DVT CBCT phantom. Results: For the same exposures, child doses averaged 32% greater than adult (p=0.0004). Full field doses were greater than mandibular followed by maxillary (p=0.0002). Dose increased with increasing mAs (p>0.0001). Increasing Contrast Noise Ratio (CNR) was associated with increasing mAs (p=0.0106) and frames (p=0.0423), while Modulation Transfer Function (MTF) was not (p>0.05). Conclusions: An average of 66% reduction in dose can be achieved when using standard exposure parameters in comparison with high-definition exposures. CNR was
ACKNOWLEDGEMENTS
TABLE OF CONTENTS
LIST OF TABLES ... vi
LIST OF FIGURES ... vii
LITERATURE REVIEW ...1
INTRODUCTION ...9
MATERIALS AND METHODS ...12
RESULTS ...17
DISCUSSION ...19
CONCLUSIONS...26
LIST OF TABLES
Table 1. Scan parameters for Galileos Comfort Plus programs and exposure settings ...27 Table 2. Estimated percentage of tissue irradiated ...28 Table 3. Effective doses (µSv) for the child and adult phantoms by
LIST OF FIGURES
Figure 1. Adult phantom dosimeter locations ...31
Figure 2. Child phantom dosimeter locations ...32
Figure 3. QUART DVT_AP phantom ...33
Figure 4. Effective doses for the child and adult phantoms at the same high-definition settings ...33
Figure 5. Effective doses for the child and adult phantoms at the same standard settings ...34
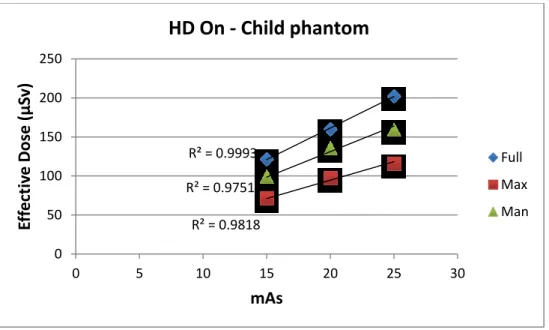
Figure 6. Effective doses for the child phantom at the high-definition settings ...34
Figure 7. Effective doses for the child phantom at the standard settings ...35
Figure 8. Effective doses for the adult phantom at the high-definition settings ...35
Figure 9. Effective doses for the adult phantom at the standard settings ...36
Figure 10. Equivalent dose measurements (µGy) for the child phantom ...37
Figure 11. Equivalent dose measurements (µGy) for the adult phantom ...38
Figure 12. Comparison of thyroid level in child and adult ...39
Figure 13. Positioning of the child phantom for the full field of view scan ...39
LITERATURE REVIEW
The use of ionizing radiation in diagnostic medical examinations has increased over the last 20 years to the point where the annual per capita dose to the US population from all sources has doubled.1 The risk of this exposure is notable, and it has been estimated that from 1.5% to 2% of all US cancers may be attributed to computed tomography (CT) studies alone.2 Cancer, being the principal long-term effect of exposure to x-rays, makes this issue an important one. Evidence indicates that an adult exposure to x-rays as low as 90 millisieverts (mSv) or a fetal exposure of 9-20 mSv is a cancer risk. A linear-no-threshold hypothesis of x-ray risk fits most data for cancer development, but extrapolation of this data must be used to estimate risks from the lower doses that are utilized for diagnostic imaging. The majority of scientists working in this area accept this extrapolation as reasonable and prudent.3 Although the risk to an individual from a single exam may not itself be large, millions of exams are performed each year, making radiation exposure from medical imaging an important public health issue.
with a longer life expectancy in which cancer can develop, children are two to five times more sensitive to radiation carcinogenesis than mature adults.4, 6
The biological effect of exposure to ionizing radiation, expressed as the risk of cancer development over a lifetime, is determined from absorbed radiation dose in combination with other factors that account for differences in exposed tissue sensitivity and other patient susceptibility factors such as gender and age. Simple measurement of absorbed ionizing radiation does not account for sensitivity of tissues or other factors important for determining risk. To address this issue, the International Commission on Radiological Protection (ICRP) suggested in 1990 that effective dose (E) be adopted as the best means of comparing dose and risk from any exposure to ionizing radiation.7 Effective dose was created to provide a dose quantity related to the probability of health detriment due to stochastic effects of exposure to low doses of ionizing radiation. Organs and tissues known to be most susceptible to radiation
damage were assigned weights that represent the relative contribution of each tissue to overall risk. Effective dose, reported in sieverts, was defined as the sum of the products of each tissue-weighting factor (wT) and the equivalent dose to that tissue (HT), E = Σ wT × HT.
In 2007, the ICRP published a revision of the tissue-weighting factors used in the calculation of effective dose.8 This was made possible by the availability of cancer incidence data that was not available when the 1990 guidelines were published. The 1990 ICRP cancer risks were computed based on mortality data. Incidence data provided a more complete
recommendations were justified because of accumulated epidemiologic information on the tumorigenic effects of radiation that was sufficient to make judgments necessary for estimating cancer risks. Cancer risk in salivary glands and brain were judged to be greater than that of other tissues in the remainder fraction, and each was ascribed a wT of 0.01. A wT value for the
remainder tissues of 0.12, distributed equally among 13 of 14 named tissues, provided a weight of approximately 0.009 each, which was just marginally lower than the wT for the lowest of the named tissues. Of significance for maxillofacial imaging, there was an increase in the risk estimation for brain tissues and the addition of salivary glands, oral mucosa, and lymph nodes, which may be partially or fully irradiated during maxillofacial examinations. These changes in the calculation of risk from x-ray exposures to the head and neck area prescribed by ICRP have resulted in increases in estimated risk to adult patients by as much as 422% from previously used 1990 calculations.9
A dramatic increase in the use of CBCT has occurred in dentistry during the last decade. CBCT allows the acquisition of three-dimensional volumes of the dental arches and surrounding tissues at a high spatial resolution and a low radiation dose. There are a number of different dental applications that benefit from the use of CBCT, each with specific requirements regarding the size of the acquired volume and the image quality in terms of spatial and contrast
resolution.10 Some have already declared it the new “gold standard” of maxillofacial imaging and predict that it will be used by most dental practices within the next decade.11
digital panoramic and cephalometric radiographs have been reported to administer effective doses of 14-24 µSv and 4-5 µSv, respectively.9, 19 As stated earlier, a routine medical CT head scan can have an effective dose of approximately 2 mSv, whereas most CBCT units have been reported to impart a much lower dose.2 Available CBCT units from different manufacturers have been shown to vary in dose by as much as 10-fold for an equivalent field of view (FOV) examination.5 In fact, for a large FOV scan, effective dose can range from 68 to 1073 µSv. In addition, adjustments of exposure factors to improve image quality are available in many CBCT units and can cause as much as a 7-fold increase in patient dose.5
VGi were almost double that of his findings, which were probably due to poor positioning of the phantom, causing the thyroid gland to be directly exposed. Ludlow also stated that while the use of additional dosimeters may increase the precision of calculation of organ dose, it does not guarantee an increase in the accuracy of the calculation of effective dose. He recommended the development of phantoms that can provide reasonable indicators of effective dose with fewer, rather than more dosimeters.
In their conclusions, Pauwels et al. stated that further study is required to bring image quality into play, on a technical and diagnostic level.20 By investigating technical image quality, the relation between the exposure from CBCT units and the image quality performance in terms of noise, sharpness, contrast and artifacts, diagnostic quality studies could link all quantifications of dose and image quality to performance evaluation on a clinical level. Ludlow and Walker explained that because image quality is subjective, the measurement and comparison of image quality across CBCT units in diagnostic situations pose complex problems.22 Two elements of subjective image quality that correlate with objective quality measures include contrast and spatial resolution.23 Image contrast can be objectively measured with the contrast-to-noise ratio, and spatial resolution can be measured by computing a modulation transfer function.
increase the dose because of increases in exposure that are needed to maintain an adequate contrast-to-noise ratio.22 Another potential means of reducing patient risk is to reduce exposure for diagnostic tasks that theoretically require lower contrast-to-noise ratios or lower signal modulation transfer functions. For example, checking the root angulation during
mid-orthodontic treatment could apply. The combination of careful selection of exposure parameters and FOV can result in an optimal dose for specific diagnostic tasks in orthodontic practice. Contrast-to-noise ratio data in conjunction with modulation transfer function indications of resolution limits might be helpful guides in indicating the usefulness of different CBCT scanning parameters for specific diagnostic tasks. Determination of which exposure protocol is
appropriate for a specific diagnostic task awaits further research.
In August of 2013, the American Academy of Oral and Maxillofacial Radiology
outweigh the risks of exposure to radiation, especially in the case of a child or young adult. They recommend avoiding the use of CBCT to obtain data that can be provided by alternative non-ionizing modalities, e.g., to produce virtual orthodontic study models. They also point out that few authors have presented higher levels of evidence and measured the impact of CBCT on orthodontic diagnosis and treatment planning decisions. One recent article looked at this topic and found that treatment plans were only affected in cases of unerupted teeth, severe root
resorption, and severe skeletal discrepancies. No benefit was found in cases where CBCT scans were used to examine abnormalities of the temporomandibular joint, airway space, or dental crowding.61 Another study conducted dosimetry of the SureSmile (OraMetrix, Richardson, TX) scan protocol using an i-CAT Next Generation CBCT unit.19 They found that a SureSmile scan of both arches in an adult imparts an effective dose of 148 µSv. This would correspond to an effective dose of between 148 and 198 µSv for the average pediatric orthodontic patient, according to Ludlow and Walker.22 No research has been conducted to validate enhanced treatment outcomes associated with the SureSmile protocol, in defense of its increased radiation exposure. This leads to the second guideline from the AAOMR.
The second guideline is to assess the radiation dose risk. Orthodontists must be
knowledgeable of the radiation risk of performing CBCT scans and be able to communicate this risk to their patients. Because CBCT exposes patients to ionizing radiation that may pose elevated risks to some patients (pregnant or younger patients), orthodontists must explain and disclose to patients the radiation exposure risks, benefits, and alternatives. Third, they
Suggestions include using a pulsed exposure mode, optimizing exposure settings (mA, kVp), reducing the number of basis projection images, and employing dose reduction protocols (e.g., reduced resolution) when possible. Lastly, the AAOMR recommends maintaining professional competency in performing and interpreting CBCT studies. Orthodontists must be able to exercise judgment by applying professional standards to all aspects of CBCT, while improving their skills through lifelong learning in regards to the performance and interpretation of CBCT examinations.
INTRODUCTION
Since its introduction into dentistry in 1998, the use of cone beam computed tomography (CBCT) in orthodontics has increased tremendously.17 Coupled with the increased use of CBCT has been the heightened concern regarding the long-term risks of ionizing radiation. Cancer is the principal long-term biologic effect of exposure to radiation. Thus, one of the major issues facing orthodontists today is the justification of the increased doses of ionizing radiation administered to patients via CBCT versus the traditional two-dimensional imaging techniques.
According to a 2007 review paper from the New England Journal of Medicine, an
estimated 1.5% to 2% of all cancers in the United States may be attributable to the radiation from computed tomography (CT).2 A routine medical CT examination of the head can have an
effective dose of approximately 2 mSv.4 Most CBCT examinations have been reported to produce a much lower dose; however, some CBCT units from various manufacturers differ in their doses by a factor of 10 for an equivalent field of view (FOV), with the higher doses being comparable to optimized CT scans.5 Even though the risk to a patient from a single CT or CBCT examination may be low, millions of exams are performed each year, making radiation exposure from medical and dental imaging an important public health issue.
patients have a longer life expectancy in which cancer can develop. Overall, children are two to five times more susceptible to radiation carcinogenesis than mature adults.4, 6
The quality of CBCT images is also an important factor for orthodontists to consider. CBCT image quality is observer dependent and subjective. Being subjective, the measurement and comparison of image quality across CBCT units are difficult to address. Two areas of subjective image quality that correlate with objective quality measures are contrast and spatial resolution. Image contrast has been objectively measured using the contrast-to-noise ratio, and spatial resolution has been measured by computing a modulation transfer function.22 The quality of the CBCT scan is an important consideration for the orthodontist because of how it affects patient dose. It has been reported that making selections between “low” and “high” image quality in some CBCT units can cause a 7-fold increase in effective dose.5 The challenge in the optimization of CBCT is to reduce the dose without drastically affecting image quality and diagnostic information. One potential way to reduce patient risk of ionizing radiation is to limit the area of exposure using variable FOVs that are appropriately sized for the anatomy of interest. However, as Ludlow and Walker pointed out, voxel size is linked to FOV in many CBCT units, and smaller voxel sizes associated with smaller FOVs can actually increase the dose because of increases in exposure that are necessary to maintain an adequate contrast-to-noise ratio.22 Another potential way to decrease the risk is to reduce exposure for diagnostic tasks that do not require high contrast-to-noise ratios or signal modulation transfer functions. The combination of careful selection of FOV and exposure parameters can result in an optimal dose for the
orthodontist’s specific diagnostic task.
MATERIALS AND METHODS
The Galileos Comfort Plus CBCT unit (Sirona USA) was investigated in this study. Volume scans for this unit range from a 15 cm sphere for the full FOV, to a truncated sphere with a height of 8.5 cm for the maxillary and mandibular collimated FOVs. The unit operates at 98 kVp with a pulsed exposure. The unit rotates through a complete rotation angle of 180º over a scan time of 14 seconds. The voxel size for the unit is 0.25 cm3. The transition from full FOV to collimated FOVs is accomplished using a simple mechanical switch on the unit. The unit also provides standard scans (HD off) with 200 basis images or high-definition scans (HD on) with 500 basis images.
Two head and neck phantoms were used in the study. Adult dosimetry was acquired using a tissue equivalent phantom simulating the anatomy of an average adult male (Atom Max Model 711 HN, CIRS Inc., Norfolk, VA). The phantom includes detailed 3D anthropomorphic anatomy including bone, brain, sinuses, nasal cavities, teeth, larynx, and a trachea. The bones contain both cortical and trabecular separation. The phantom was modified by making slots to accept Nanodot dosimeters at sites corresponding to internal tissues of interest. A skin surface dosimeter in the back of the neck was positioned at the vertical center of the designated slice level and taped in position. Lens of the eye dosimeters were centered over an inset in the anatomic location for the lens and taped in position. Internal dosimeters were positioned
sampled anatomic location. Adult phantom dosimeter anatomic locations and phantom levels are seen in Figure 1. During scanning, the phantom was oriented with the phantom section planes approximately parallel to the scan rotation plane, parallel to Frankfort horizontal. A phantom position simulating positioning of a patient on the chin rest was used.
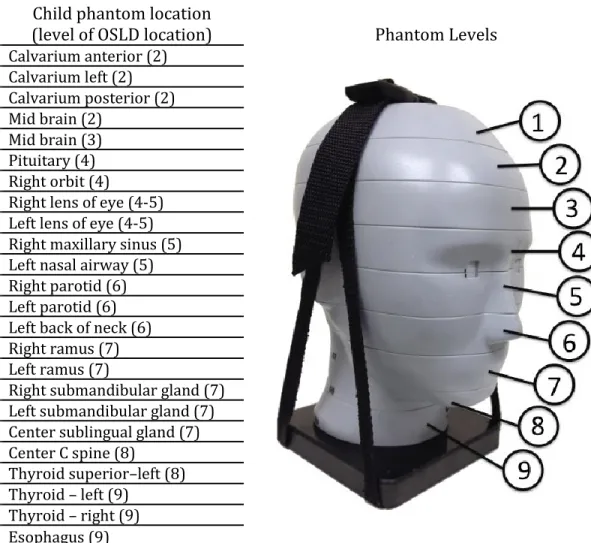
Child dosimetry was acquired using a tissue equivalent phantom simulating the anatomy of a ten-year old child (Atom Model 706 HN, CIRS Inc., Norfolk, VA). Tissues simulated in this ATOM phantom include average bone tissue, average soft tissue, brain, sinuses, spinal cord,
and spinal disks. Simulated bone tissue matches age-related density. Dosimeter anatomic
locations and child phantom levels are seen in Figure 2. In addition, the scan parameters used for CBCT scans of the child and adult phantoms are given in Table 1.
kVp was estimated at 0.91 (mean kV estimated as 66). Dividing recorded dosimeter value by energy sensitivity was used to calculate actual dose.
Two to ten exposures were utilized for each dosimeter run to provide a more reliable measure of radiation in the dosimeters. Collimated FOVs require more exposure repetition because more dosimeters are outside of the field of direct exposure and absorb only small quantities of scatter radiation. Doses recorded by the MicroStar reader were subsequently divided by the number of scans to determine the exposure per examination for each dosimeter.
Doses from the OSL dosimeters at different positions within a tissue or organ were averaged to express the average tissue-absorbed dose in micrograys (µGy). The products of these values and the percentage of a tissue or organ irradiated in a radiographic examination (Table 2) were used to calculate the equivalent dose (HT) in microsieverts (µSv).8
For bone, the equivalent dose to the whole-body bone surface was calculated using the summation of the individual equivalent doses to the calvarium, the mandible, and the cervical spine. The determination of these equivalent doses is based on the distribution of bone
muscle irradiated with mono-energetic photons was applied. An effective beam energy
estimated to be two-thirds of the peak beam energy of the x-ray unit was used to determine the bone-to-muscle attenuation ratios. A linear fit (R2=0.996) of ratios from 40 to 80 kV from published data produced the following equation: bone-to-muscle attenuation ratio = -0.0618 x kV peak x 2/3 + 6.9406.64 Values calculated from this equation provided a bone-to-muscle
attenuation ratio of 2.88 at 66 kV (98 kV peak).
The proportion of skin surface area in the head and neck region directly exposed during maxillofacial CBCT imaging was estimated as 5% of the total body to calculate the radiation-weighted dose to the skin following the procedure from Ludlow et al.65 Similarly, muscle and lymphatic nodes exposures were estimated to represent 5% of the total body complement for these tissues. The proportion of the esophageal tract that is exposed was set at 10%. Other tissues of interest were calculated at 100%.
The effective dose (E) is a calculation that permits comparison of the detriment of
Analysis of variance (ANOVA) of effective dose results was used to assess the data for significant differences due to phantom type (adult, child), collimation (maxillary, mandibular, full field), and scan protocol (HD on, HD off). Tukey’s HSD test was used to determine which factors were significantly different from the others. An alpha value of 0.05 was chosen for all tests.
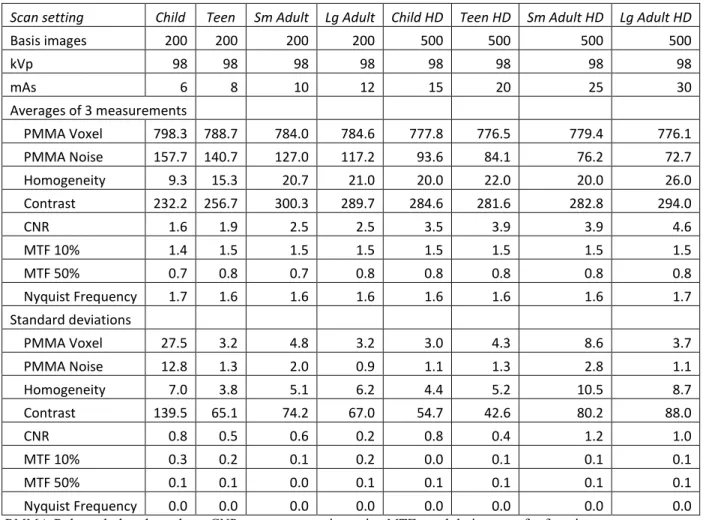
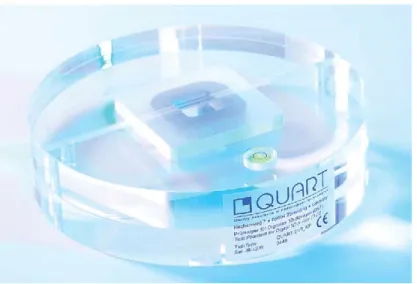
Image quality indicators associated with FOV, scanning angle, kilovolt peak, and voxel size were acquired using a QUART DVT_AP phantom and QUART DVT_TEC software (QUART, Zorneding, Germany) (Figure 3). The phantom consisted of 16-cm-diameter
cylindrical slabs of acrylic plastic with polyvinyl chloride and air elements configured to permit measurements of polymethyl methacrylate (PMMA) voxel, PMMA noise, homogeneity,
contrast, contrast-to-noise ratio, modulation transfer function 10%, modulation transfer function 50%, and Nyquist frequency. The measurements were calculated in a user-guided,
RESULTS
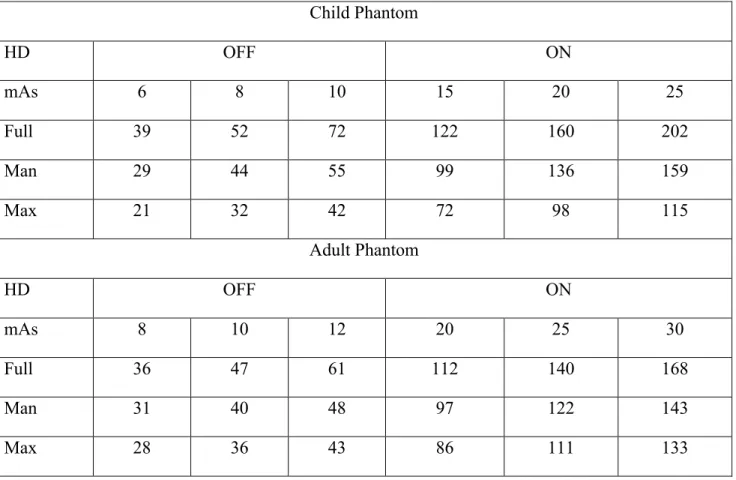
The effective doses for the various combinations of parameters for the Galileos Comfort Plus CBCT unit are reported in Table 3. ANOVA of the combined child and adult phantom effective dose data demonstrated that for the same exposures, the child doses averaged 32% greater than the adult doses (p = 0.0004). These results are illustrated in Figures 4 and 5, with the high-definition setting turned on and off, respectively.
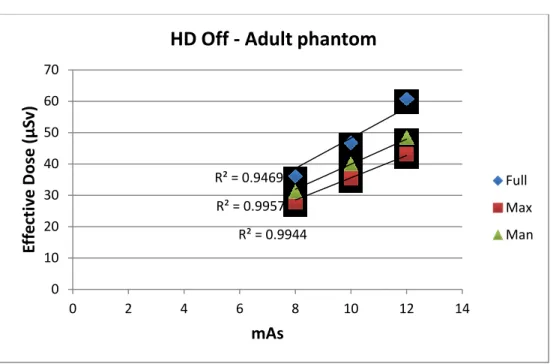
The Tukey’s HSD test demonstrated that the effective doses from the full field of view scans were significantly greater than the mandibular field of view scans, followed by the maxillary field of view scans (p = 0.0002). These differences can be detected in Figures 6 through 9, corresponding to the phantom type and high-definition settings. The coefficient of determination values (R²) in the figures range from 0.944 to 0.999, demonstrating a very high reproducibility of the experimental data.
Figures 4 through 9 also illustrate that as the mAs increased, so did the effective dose (p < 0.0001). This is why the effective doses continued to increase from the child setting up to the large adult setting. It also explains why the high-definition scans, with greater mAs values, corresponded to higher effective doses.
than in the adult phantom (p < 0.0001) and comprised a greater percentage of the overall absorbed dose.
DISCUSSION
Since the thyroid has a tissue weight of 0.04, this organ provides a significant
contribution to the calculation of effective dose for head and neck exposures. Clinically, direct thyroid exposure can be reduced by rotating the chin upward and positioning the lower border of the mandible parallel to the rotational plane of the beam (parallel to the floor). Unfortunately, this strategy was not possible due to the rigid phantoms used in this study. It is important to consider that for those concerned with cephalometric analyses, this technique would not place the patient’s head in natural head position. Also, this strategy employs the use of a chin cup, which may cause difficulties for analyzing the soft tissue profile, chin, neck, and throat forms.
The use of CBCT units in orthodontics has been a controversial topic in recent history. In November 2010, a New York Times article expressed concern over the trend to use high-dose, high-resolution three-dimensional scans on young orthodontic patients.66 Relevant to this issue, the results of our study demonstrate that effective doses were one-third greater in the child phantom than in the adult phantom. Compounding this greater dose of radiation is the fact that due to the increased radiosensitivity of tissues in children, the risk is an additional two to five times higher for a pediatric patient.6 The relative risk of developing fatal cancer based on 2007 ICRP calculations, as a result of the effective doses seen in our study with the HD scans, equals 9 in a million for the adult and 27 in a million for the child.8 The corresponding risk associated with developing thyroid cancer, based on the calculated equivalent doses in our study, equals 2 in a thousand for the adult and 11 in a thousand for the child. This is important information to consider when determining what type of diagnostic imaging might be best for a given patient.
resulted in an effective dose of 122 µSv. When the HD off setting was selected for this same situation, the effective dose dropped to 39 µSv. Upon review of proper patient settings and FOV, our data demonstrate that optimization of exposure parameters can greatly reduce patient dose. In fact, the standard protocol (HD off) provided a substantial 67.2% reduction in dose compared to the high-definition scans in the child phantom, and a 66.9% reduction in dose in the adult phantom. Thus, when HD off protocols can be used, they will provide a clinically
meaningful reduction in dose. The largest HD off dose in this study was 72 µSv for the full FOV, small adult setting (98 kVp, 10 mAs) on the child phantom. To put it into perspective, this dose is just over 8 days of per capita background radiation in the United States. It is also 28 times less than a typical medical CT head scan.4
As for the FOV options for the child phantom, the mandibular FOV provided a 20.3% reduction in dose compared to the full FOV, and the maxillary FOV provided a 41.4% reduction in dose compared to the full FOV. Similarly for the adult phantom, the average effective dose for the mandibular FOV was 15.0% less than the full FOV, and the maxillary FOV was 23.5% less than the full FOV. Therefore, if a full FOV scan is not necessary, a substantial decrease in radiation dose can be appreciated by the patient.
It is important to remember that in trying to lower the dose of ionizing radiation
administered to patients, significant reductions are meaningless if image quality deteriorates to the point of not being diagnostic. As optimization and dose reduction become more of an emphasis for CBCT manufacturers, the effects on image quality will require attention. Evidence-based research establishing the usability of low-dose and low-quality scans for
radiograph. More studies are needed to support that other important information in two-dimensional imaging or higher-dose scans, e.g. periodontal conditions, changes in root length, and changes in morphology that could indicate root resorption, are not lost in these low-dose scans.
In August of 2013, the American Academy of Oral and Maxillofacial Radiology
resorption, and severe skeletal discrepancies. No benefit was found in cases where CBCT scans were used to examine abnormalities of the temporomandibular joint, airway space, or dental crowding.61 Another study conducted dosimetry of the SureSmile (OraMetrix, Richardson, TX) scan protocol using an i-CAT Next Generation CBCT unit.19 They found that a SureSmile scan of both arches in an adult imparts an effective dose of 148 µSv. This would correspond to an effective dose of between 148 and 198 µSv for the average pediatric orthodontic patient, according to Ludlow and Walker.22 No research has been conducted to validate enhanced treatment outcomes associated with the SureSmile protocol, in defense of its increased radiation exposure. This leads to the second guideline from the AAOMR.
The second guideline is to assess the radiation dose risk. Orthodontists must be
knowledgeable of the radiation risk of performing CBCT scans and be able to communicate this risk to their patients. Because CBCT exposes patients to ionizing radiation that may pose elevated risks to some patients (pregnant or younger patients), orthodontists must explain and disclose to patients the radiation exposure risks, benefits, and alternatives. Third, they
standards to all aspects of CBCT, while improving their skills through lifelong learning in regards to the performance and interpretation of CBCT examinations.
The AAOMR commented that CBCT acquisition technology continues to develop and a number of innovations are proposed to improve image quality, increase utility, and reduce radiation output. With regards to image quality, they advise that such innovations should be assessed critically and verified by independent published research.24 The QUART DVT
phantom is the first commercially available phantom to comply with standards for image quality testing of CBCT units. These standards were developed in Germany, which is where the
CONCLUSIONS
1. Use of fewer basis images and smaller FOVs in the Galileos Comfort Plus unit result in significant patient dose reductions over alternative high-definition and larger FOVs settings.
2. Effective dose for a given FOV may be increased for pediatric patients due to an increase in thyroid exposure to ionizing radiation.
3. Contrast-to-noise ratio data in conjunction with modulation transfer function indications of resolution limits might be helpful guides in determining the usefulness of different scanning parameters for specific diagnostic tasks.
TABLES
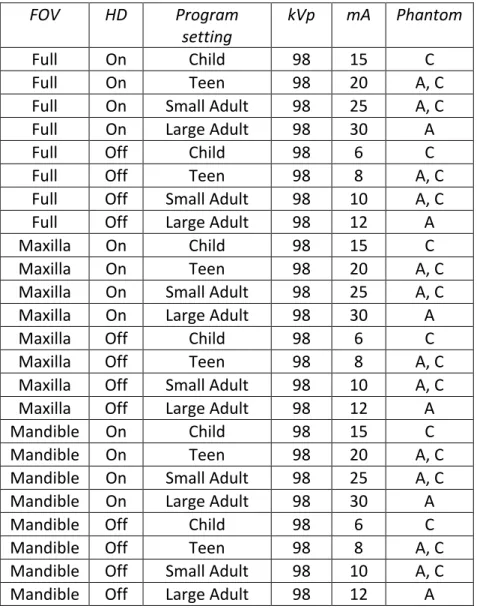
Table 1. Scan parameters for Galileos Comfort Plus programs and exposure settings.
FOV HD Program
setting
kVp mA Phantom
Full On Child 98 15 C
Full On Teen 98 20 A, C
Full On Small Adult 98 25 A, C
Full On Large Adult 98 30 A
Full Off Child 98 6 C
Full Off Teen 98 8 A, C
Full Off Small Adult 98 10 A, C
Full Off Large Adult 98 12 A
Maxilla On Child 98 15 C
Maxilla On Teen 98 20 A, C
Maxilla On Small Adult 98 25 A, C
Maxilla On Large Adult 98 30 A
Maxilla Off Child 98 6 C
Maxilla Off Teen 98 8 A, C
Maxilla Off Small Adult 98 10 A, C
Maxilla Off Large Adult 98 12 A
Mandible On Child 98 15 C
Mandible On Teen 98 20 A, C
Mandible On Small Adult 98 25 A, C
Mandible On Large Adult 98 30 A
Mandible Off Child 98 6 C
Mandible Off Teen 98 8 A, C
Mandible Off Small Adult 98 10 A, C
Mandible Off Large Adult 98 12 A
Table 2. Estimated percentage of tissue irradiated.
Fraction
Irradiated
Adult (%)
OSL ID
(see Figure 1)
Fraction
Irradiated
Child (%)
OSL ID
(see Figure 2)
Bone marrow 12.2 15.4
Mandible 0.8 14, 15 1.1 15, 16
Calvaria 7.7 1, 3, 5 11.6 1, 2, 3
Cervical spine 3.8 20 2.7 20
Thyroid 100 22, 23 100 21, 22, 23
Esophagus 10 24 10 24
Skin 5 7, 8, 16 5 8, 9, 14
Bone surface 16.5 16.5
Mandible 1.3 14, 15 1.3 15, 16
Calvaria 11.8 1, 3, 5 11.8 1, 2, 3
Cervical spine 3.4 20 3.4 20
Salivary glands 100 100
Parotid 100 12, 13 100 12, 13
Submandibular 100 17, 18 100 17, 18
Sublingual 100 19 100 19
Brain 100 2, 4, 6 100 4, 5, 6
Remainder
Lymphatic nodes 5
11-13, 17-19,
21-24 5
12-13, 17-19, 21-24
Muscle 5 11-13, 17-19, 21-24 5 12-13, 17-19, 21-24 Extrathoracic
region 100
9-13, 17-19, 21-24
100
10-13, 17-19, 21, 24
Table 3. Effective doses (µSv) for the child and adult phantoms by exposure protocol and field of view.
Child Phantom
HD OFF ON
mAs 6 8 10 15 20 25
Full 39 52 72 122 160 202
Man 29 44 55 99 136 159
Max 21 32 42 72 98 115
Adult Phantom
HD OFF ON
mAs 8 10 12 20 25 30
Full 36 47 61 112 140 168
Man 31 40 48 97 122 143
Max 28 36 43 86 111 133
Table 4. QUART phantom image measurements.
Scan setting Child Teen Sm Adult Lg Adult Child HD Teen HD Sm Adult HD Lg Adult HD
Basis images 200 200 200 200 500 500 500 500
kVp 98 98 98 98 98 98 98 98
mAs 6 8 10 12 15 20 25 30
Averages of 3 measurements
PMMA Voxel 798.3 788.7 784.0 784.6 777.8 776.5 779.4 776.1 PMMA Noise 157.7 140.7 127.0 117.2 93.6 84.1 76.2 72.7 Homogeneity 9.3 15.3 20.7 21.0 20.0 22.0 20.0 26.0 Contrast 232.2 256.7 300.3 289.7 284.6 281.6 282.8 294.0
CNR 1.6 1.9 2.5 2.5 3.5 3.9 3.9 4.6
MTF 10% 1.4 1.5 1.5 1.5 1.5 1.5 1.5 1.5
MTF 50% 0.7 0.8 0.7 0.8 0.8 0.8 0.8 0.8
Nyquist Frequency 1.7 1.6 1.6 1.6 1.6 1.6 1.6 1.7
Standard deviations
PMMA Voxel 27.5 3.2 4.8 3.2 3.0 4.3 8.6 3.7
PMMA Noise 12.8 1.3 2.0 0.9 1.1 1.3 2.8 1.1
Homogeneity 7.0 3.8 5.1 6.2 4.4 5.2 10.5 8.7
Contrast 139.5 65.1 74.2 67.0 54.7 42.6 80.2 88.0
CNR 0.8 0.5 0.6 0.2 0.8 0.4 1.2 1.0
MTF 10% 0.3 0.2 0.1 0.2 0.0 0.1 0.1 0.1
MTF 50% 0.1 0.1 0.0 0.1 0.1 0.1 0.1 0.1
Nyquist Frequency 0.0 0.0 0.0 0.0 0.0 0.0 0.0 0.0
FIGURES
Figure 1. Adult phantom dosimeter locations.
OSL ID No.
Adult phantom location
(level of OSLD location) Phantom Levels
1 Calvarium anterior (2) 2 Mid brain (2)
3 Calvarium left (3) 4 Mid brain (3)
5 Calvarium posterior (4) 6 Pituitary (4)
7 Right lens of eye (4-5) 8 Left lens of eye (4-5) 9 Right ethmoid (5) 10 Left maxillary sinus (6) 11 Oropharyngeal airway (7) 12 Right parotid (7)
13 Left parotid (7) 14 Right ramus (7) 15 Left ramus (7) 16 Left back of neck (8)
17 Right submandibular gland (8) 18 Left submandibular gland (8) 19 Center sublingual gland (8) 20 Center C spine (8)
Figure 2. Child phantom dosimeter locations.
OSL
ID No. (level of OSLD location) Child phantom location Phantom Levels
1 Calvarium anterior (2) 2 Calvarium left (2) 3 Calvarium posterior (2) 4 Mid brain (2)
5 Mid brain (3) 6 Pituitary (4) 7 Right orbit (4)
8 Right lens of eye (4-5) 9 Left lens of eye (4-5) 10 Right maxillary sinus (5) 11 Left nasal airway (5) 12 Right parotid (6) 13 Left parotid (6) 14 Left back of neck (6) 15 Right ramus (7) 16 Left ramus (7)
17 Right submandibular gland (7) 18 Left submandibular gland (7) 19 Center sublingual gland (7) 20 Center C spine (8)
21 Thyroid superior–left (8) 22 Thyroid – left (9)
Figure 3. QUART DVT_AP phantom.
Figure 4. Effective doses for the child and adult phantoms at the same high-definition settings. 0 50 100 150 200 250 Teen, Max Teen, Man Teen, Full Sm Adult, Max Sm Adult, Man Sm Adult, Full Eff e ctiv e D o se (µ Sv )
Exam (Setting, FOV)
HD On
Figure 5. Effective doses for the child and adult phantoms at the same standard settings.
Figure 6. Effective doses for the child phantom at the high-definition settings. 0 10 20 30 40 50 60 70 80 Teen, Max Teen, Man Teen, Full Sm Adult, Max Sm Adult, Man Sm Adult, Full Eff e ctiv e D o se (µ Sv )
Exam (Setting, FOV)
HD Off
Child phantom Adult phantom
R² = 0.9993
R² = 0.9818 R² = 0.9751
0 50 100 150 200 250
0 5 10 15 20 25 30
Ef fe ct iv e Dos e (µ Sv) mAs
HD On - Child phantom
Figure 7. Effective doses for the child phantom at the standard settings.
Figure 8. Effective doses for the adult phantom at the high-definition settings. R² = 0.9649
R² = 0.9438 R² = 0.9574
0 10 20 30 40 50 60 70 80
0 2 4 6 8 10 12
Ef fe ct iv e Dos e (µ Sv) mAs
HD Off - Child phantom
Full Max Man
R² = 0.9998 R² = 0.9964 R² = 0.9939
0 20 40 60 80 100 120 140 160 180
0 5 10 15 20 25 30 35
Ef fe ct iv e Dos e (µ Sv) mAs
HD On - Adult phantom
Figure 9. Effective doses for the adult phantom at the standard settings.
R² = 0.9469
R² = 0.9944 R² = 0.9957
0 10 20 30 40 50 60 70
0 2 4 6 8 10 12 14
Ef
fe
ct
iv
e
Dos
e
(µ
Sv)
mAs
HD Off - Adult phantom
Figure 10. Equivalent dose measurements (µGy) for the child phantom. *Oral mucosa 1531 27% Salivary glands 1440 25% *Extrathoracic airway 1168 20% Thyroid 771 13% Brain 387 7% Bone surface 194 3% *Lymphatic nodes 58 1% *Muscle 58 1% Bone Marrow 56 1% Skin 55 1% Esophagus 44 1%
Figure 11. Equivalent dose measurements (µGy) for the adult phantom. *Oral mucosa 1922 31% Salivary glands 1863 30% *Extrathoracic airway 1291 20% Thyroid 378 6% Bone surface 261
4% Brain
238 4% Bone Marrow 85 1% *Lymphatic nodes 71
1% *Muscle 70 1% Skin 60 1% Esophagus 45 1%
Figure 12. Comparison of thyroid level in child and adult.
* *
Thyroid position in child Thyroid position in adult
* A.D.A.M. medical images http://www.adamimages.com
REFERENCES
1. Ionizing radiation exposure of the population of the United States: Recommendations of the national council on radiation protection and measurements. NCRP Publications; 2009. Report nr 160.
2. Brenner DJ, Hall EJ. Computed tomography--an increasing source of radiation exposure. N Engl J Med 2007 Nov 29;357(22):2277-84.
3. Goaz PW WS, editor. Oral radiology, principles and interpretation. 3rd edition ed. St. Louis: Mosby; 1994.
4. Smith-Bindman R, Lipson J, Marcus R, Kim KP, Mahesh M, Gould R, Berrington de
Gonzalez A, Miglioretti DL. Radiation dose associated with common computed tomography examinations and the associated lifetime attributable risk of cancer. Arch Intern Med 2009 Dec 14;169(22):2078-86.
5. Ludlow JB, Ivanovic M. Comparative dosimetry of dental CBCT devices and 64-slice CT for oral and maxillofacial radiology. Oral Surg Oral Med Oral Pathol Oral Radiol Endod 2008 Jul;106(1):106-14.
6. Brenner D, Elliston C, Hall E, Berdon W. Estimated risks of radiation-induced fatal cancer from pediatric CT. AJR Am J Roentgenol 2001 Feb;176(2):289-96.
7. 1990 recommendations of the international commission on radiological protection. ICRP publication 60; Ann ICRP 1991.
8. The 2007 recommendations of the international commission on radiological protection. ICRP publication 103. Ann ICRP 2007;37(2-4):1-332.
9. Ludlow JB, Davies-Ludlow LE, White SC. Patient risk related to common dental radiographic examinations: The impact of 2007 international commission on radiological protection recommendations regarding dose calculation. J Am Dent Assoc 2008 Sep;139(9):1237-43. 10. Scarfe WC, Farman AG, Sukovic P. Clinical applications of cone-beam computed
tomography in dental practice. J can Dent Assoc 2006 Feb;72(1):75-80.
11. Thomas SL. Application of cone-beam CT in the office setting. Dent Clin North Am 2008 Oct;52(4):753,9, vi.
12. Mussig E, Wortche R, Lux CJ. Indications for digital volume tomography in orthodontics. J Orofac Orthop 2005 May;66(3):241-9.
14. White SC PE. Patient image selection criteria for cone beam computed tomography imaging. Semin Orthod 2009(15):19-28.
15. Merrett SJ, Drage NA, Durning P. Cone beam computed tomography: A useful tool in orthodontic diagnosis and treatment planning. J Orthod 2009 Sep;36(3):202-10.
16. Mah JK, Huang JC, Choo H. Practical applications of cone-beam computed tomography in orthodontics. J Am Dent Assoc 2010 Oct;141 Suppl 3:7S-13S.
17. Kapila S, Conley RS, Harrell WE,Jr. The current status of cone beam computed tomography imaging in orthodontics. Dentomaxillofac Radiol 2011 Jan;40(1):24-34.
18. Nervina JM. Cone beam computed tomography use in orthodontics. Aust Dent J 2012 Mar;57 Suppl 1:95-102.
19. Grunheid T, Kolbeck Schieck JR, Pliska BT, Ahmad M, Larson BE. Dosimetry of a cone-beam computed tomography machine compared with a digital x-ray machine in orthodontic imaging. Am J Orthod Dentofacial Orthop 2012 Apr;141(4):436-43.
20. Pauwels R, Beinsberger J, Collaert B, Theodorakou C, Rogers J, Walker A, Cockmartin L, Bosmans H, Jacobs R, Bogaerts R, et al. Effective dose range for dental cone beam computed tomography scanners. Eur J Radiol 2012 Feb;81(2):267-71.
21. Ludlow JB. Comment on "effective dose range for dental cone beam computed tomography scanners". Eur J Radiol 2012 Dec;81(12):4219,20; author reply 4221-4.
22. Ludlow JB, Walker C. Assessment of phantom dosimetry and image quality of i-CAT FLX cone-beam computed tomography. Am J Orthod Dentofacial Orthop 2013 Dec;144(6):802-17.
23. Watanabe H, Honda E, Tetsumura A, Kurabayashi T. A comparative study for spatial resolution and subjective image characteristics of a multi-slice CT and a cone-beam CT for dental use. Eur J Radiol 2011 Mar;77(3):397-402.
24. American Academy of Oral and Maxillofacial Radiology. Clinical recommendations regarding use of cone beam computed tomography in orthodontics. [corrected]. position statement by the american academy of oral and maxillofacial radiology. Oral Surg Oral Med Oral Pathol Oral Radiol 2013 Aug;116(2):238-57.
25. Peck JL, Sameshima GT, Miller A, Worth P, Hatcher DC. Mesiodistal root angulation using panoramic and cone beam CT. Angle Orthod 2007 Mar;77(2):206-13.
26. Liu DG, Zhang WL, Zhang ZY, Wu YT, Ma XC. Three-dimensional evaluations of
27. Sherrard JF, Rossouw PE, Benson BW, Carrillo R, Buschang PH. Accuracy and reliability of tooth and root lengths measured on cone-beam computed tomographs. Am J Orthod
Dentofacial Orthop 2010 Apr;137(4 Suppl):S100-8.
28. Katheria BC, Kau CH, Tate R, Chen JW, English J, Bouquot J. Effectiveness of impacted and supernumerary tooth diagnosis from traditional radiography versus cone beam computed tomography. Pediatr Dent 2010 Jul-Aug;32(4):304-9.
29. Van Elslande D, Heo G, Flores-Mir C, Carey J, Major PW. Accuracy of mesiodistal root angulation projected by cone-beam computed tomographic panoramic-like images. Am J Orthod Dentofacial Orthop 2010 Apr;137(4 Suppl):S94-9.
30. Makedonas D, Lund H, Hansen K. Root resorption diagnosed with cone beam computed tomography after 6 months and at the end of orthodontic treatment with fixed appliances. Angle Orthod 2013 May;83(3):389-93.
31. Chaushu S, Chaushu G, Becker A. The role of digital volume tomography in the imaging of impacted teeth. World J Orthod 2004 Summer;5(2):120-32.
32. Walker L, Enciso R, Mah J. Three-dimensional localization of maxillary canines with cone-beam computed tomography. Am J Orthod Dentofacial Orthop 2005 Oct;128(4):418-23. 33. Guerrero ME, Shahbazian M, Elsiena Bekkering G, Nackaerts O, Jacobs R, Horner K. The
diagnostic efficacy of cone beam CT for impacted teeth and associated features: A systematic review. J Oral Rehabil 2011 Mar;38(3):208-16.
34. Nguyen E, Boychuk D, Orellana M. Accuracy of cone-beam computed tomography in predicting the diameter of unerupted teeth. Am J Orthod Dentofacial Orthop 2011 Aug;140(2):e59-66.
35. Rungcharassaeng K, Caruso JM, Kan JY, Kim J, Taylor G. Factors affecting buccal bone changes of maxillary posterior teeth after rapid maxillary expansion. Am J Orthod Dentofacial Orthop 2007 Oct;132(4):428.e1,428.e8.
36. Loubele M, Van Assche N, Carpentier K, Maes F, Jacobs R, van Steenberghe D, Suetens P. Comparative localized linear accuracy of small-field cone-beam CT and multislice CT for alveolar bone measurements. Oral Surg Oral Med Oral Pathol Oral Radiol Endod 2008 Apr;105(4):512-8.
37. Yagci A, Veli I, Uysal T, Ucar FI, Ozer T, Enhos S. Dehiscence and fenestration in skeletal class I, II, and III malocclusions assessed with cone-beam computed tomography. Angle Orthod 2012 Jan;82(1):67-74.
39. AlHadidi A, Cevidanes LH, Mol A, Ludlow J, Styner M. Comparison of two methods for quantitative assessment of mandibular asymmetry using cone beam computed tomography image volumes. Dentomaxillofac Radiol 2011 Sep;40(6):351-7.
40. Cevidanes LH, Alhadidi A, Paniagua B, Styner M, Ludlow J, Mol A, Turvey T, Proffit WR, Rossouw PE. Three-dimensional quantification of mandibular asymmetry through cone-beam computerized tomography. Oral Surg Oral Med Oral Pathol Oral Radiol Endod 2011 Jun;111(6):757-70.
41. Tucker S, Cevidanes LH, Styner M, Kim H, Reyes M, Proffit W, Turvey T. Comparison of actual surgical outcomes and 3-dimensional surgical simulations. J Oral Maxillofac Surg 2010 Oct;68(10):2412-21.
42. Heymann GC, Cevidanes L, Cornelis M, De Clerck HJ, Tulloch JF. Three-dimensional analysis of maxillary protraction with intermaxillary elastics to miniplates. Am J Orthod Dentofacial Orthop 2010 Feb;137(2):274-84.
43. Kim YI, Park SB, Son WS, Hwang DS. Midfacial soft-tissue changes after advancement of maxilla with le fort I osteotomy and mandibular setback surgery: Comparison of
conventional and high le fort I osteotomies by superimposition of cone-beam computed tomography volumes. J Oral Maxillofac Surg 2011 Jun;69(6):e225-33.
44. Lagravere MO, Carey J, Heo G, Toogood RW, Major PW. Transverse, vertical, and anteroposterior changes from bone-anchored maxillary expansion vs traditional rapid maxillary expansion: A randomized clinical trial. Am J Orthod Dentofacial Orthop 2010 Mar;137(3):304.e1,12; discussion 304-5.
45. Kim YI, Choi YK, Park SB, Son WS, Kim SS. Three-dimensional analysis of dental
decompensation for skeletal class III malocclusion on the basis of vertical skeletal patterns obtained using cone-beam computed tomography. Korean J Orthod 2012 Oct;42(5):227-34. 46. Miner RM, Al Qabandi S, Rigali PH, Will LA. Cone-beam computed tomography transverse analysis. part I: Normative data. Am J Orthod Dentofacial Orthop 2012 Sep;142(3):300-7. 47. Hilgers ML, Scarfe WC, Scheetz JP, Farman AG. Accuracy of linear temporomandibular
joint measurements with cone beam computed tomography and digital cephalometric radiography. Am J Orthod Dentofacial Orthop 2005 Dec;128(6):803-11.
48. Cevidanes LH, Hajati AK, Paniagua B, Lim PF, Walker DG, Palconet G, Nackley AG, Styner M, Ludlow JB, Zhu H, et al. Quantification of condylar resorption in
temporomandibular joint osteoarthritis. Oral Surg Oral Med Oral Pathol Oral Radiol Endod 2010 Jul;110(1):110-7.
50. Swennen GR, Mollemans W, De Clercq C, Abeloos J, Lamoral P, Lippens F, Neyt N, Casselman J, Schutyser F. A cone-beam computed tomography triple scan procedure to obtain a three-dimensional augmented virtual skull model appropriate for orthognathic surgery planning. J Craniofac Surg 2009 Mar;20(2):297-307.
51. Carvalho Fde A, Cevidanes LH, da Motta AT, Almeida MA, Phillips C. Three-dimensional assessment of mandibular advancement 1 year after surgery. Am J Orthod Dentofacial Orthop 2010 Apr;137(4 Suppl):S53.e1,12; discussion S53-5.
52. da Motta AT, de Assis Ribeiro Carvalho F, Oliveira AE, Cevidanes LH, de Oliveira Almeida MA. Superimposition of 3D cone-beam CT models in orthognathic surgery. Dental Press J Orthod 2010 Mar 1;15(2):39-41.
53. Aboudara CA, Hatcher D, Nielsen IL, Miller A. A three-dimensional evaluation of the upper airway in adolescents. Orthod Craniofac Res 2003;6 Suppl 1:173-5.
54. Oh KM, Hong JS, Kim YJ, Cevidanes LS, Park YH. Three-dimensional analysis of
pharyngeal airway form in children with anteroposterior facial patterns. Angle Orthod 2011 Nov;81(6):1075-82.
55. Alsufyani NA, Flores-Mir C, Major PW. Three-dimensional segmentation of the upper airway using cone beam CT: A systematic review. Dentomaxillofac Radiol 2012 May;41(4):276-84.
56. Baumgaertel S, Hans MG. Buccal cortical bone thickness for mini-implant placement. Am J Orthod Dentofacial Orthop 2009 Aug;136(2):230-5.
57. Kau CH, English JD, Muller-Delgardo MG, Hamid H, Ellis RK, Winklemann S.
Retrospective cone-beam computed tomography evaluation of temporary anchorage devices. Am J Orthod Dentofacial Orthop 2010 Feb;137(2):166.e1,5; discussion 166-7.
58. Qiu L, Haruyama N, Suzuki S, Yamada D, Obayashi N, Kurabayashi T, Moriyama K. Accuracy of orthodontic miniscrew implantation guided by stereolithographic surgical stent based on cone-beam CT-derived 3D images. Angle Orthod 2012 Mar;82(2):284-93.
59. Garrett BJ, Caruso JM, Rungcharassaeng K, Farrage JR, Kim JS, Taylor GD. Skeletal effects to the maxilla after rapid maxillary expansion assessed with cone-beam computed
tomography. Am J Orthod Dentofacial Orthop 2008 Jul;134(1):8-9.
60. Domann CE, Kau CH, English JD, Xia JJ, Souccar NM, Lee RP. Cone beam computed tomography analysis of dentoalveolar changes immediately after maxillary expansion. Orthodontics (Chic ) 2011 Fall;12(3):202-9.
62. Underhill TE, Chilvarquer I, Kimura K, Langlais RP, McDavid WD, Preece JW, Barnwell G. Radiobiologic risk estimation from dental radiology. part I. absorbed doses to critical
organs. Oral Surg Oral Med Oral Pathol 1988 Jul;66(1):111-20.
63. Cristy M. Active bone marrow distribution as a function of age in humans. Phys Med Biol 1981 May;26(3):389-400.
64. ROBERTSON DF. Physical aspects of acute radiation exposure to superficial tissue. J Coll Radiol Australas 1963 Oct;7:214-6.
65. Ludlow JB, Davies-Ludlow LE, Brooks SL. Dosimetry of two extraoral direct digital imaging devices: NewTom cone beam CT and orthophos plus DS panoramic unit. Dentomaxillofac Radiol 2003 Jul;32(4):229-34.
66. Bogdanich W, Craven McGinty J. Radiation worries for children in dentists' chairs. The New York Times(NY ed) . 2010 Nov 23 2010;.