ENGINEERING & GINNING
Characterization of Cotton Gin Particulate Matter Emissions—Project Plan
Michael D. Buser*, Derek P. Whitelock, J. Clif Boykin, and Gregory A. Holt
M.D. Buser*, Department of Biosystems Engineering, Oklahoma State University, 214 Ag Hall, Stillwater, OK 74078; D.P. Whitelock, USDA-ARS Southwestern Cotton Ginning Research Laboratory, 300 E College Dr, P.O. Box 578, Mesilla Park, NM 88047; J.C. Boykin, USDA-ARS Cotton Ginning Research Unit, 111 Experiment Station Road, P.O. Box 256, Stoneville, MS 38776; and G.A. Holt, USDA-ARS Cotton Production and Processing Research Unit, 1604
E. FM 1294, Lubbock, TX 79401 *Corresponding author: [email protected]
ABSTRACT
In 2006, the U.S. Environmental Protection Agency implemented a more stringent standard for particulate matter with an effective diameter less than or equal to 2.5 microns (PM2.5). The implementation timeline for this standard will vary by state/district regulatory agency. For example, the San Joaquin Valley Air Pollution Control District has proposed to include cotton gins in their PM2.5 State Implementation Plan under the assumption that the PM2.5 emissions from cotton gins are significant enough to warrant further study and possibly additional control measures above and beyond the current mandate to install enhanced “1D-3D” cyclones on all emission points. All cotton gins across the cotton belt will eventually be impacted by this standard. The primary issues surrounding particulate matter regulations for the cotton ginning industry are: 1) limited or lack of PM2.5 data; 2) potential overprediction of current dispersion models; and 3) effects of sampler errors. The cotton ginners’ associations across the cotton belt, including the National, Texas, Southern, Southeastern, and California associations, have agreed that there is an urgent need to collect gin emission data to address these issues. In response to the gin association’s requests the project outlined in this paper was developed.
I
n 2006, the U.S. Environmental Protection Agency (EPA) implemented a more stringent standard forparticulate matter (PM) with an effective diameter less than or equal to 2.5 microns (PM2.5) (CFR,
2006). PM2.5 is listed as a criteria pollutant in the
National Ambient Air Quality Standards (NAAQS). The revised standards for PM2.5 require that
concentrations within any area must not exceed 35 micrograms per cubic meter (mg/m3), reduced from
the former value of 65 mg/m3; and the annual mean
PM2.5 concentrations for any area must not exceed
15 mg/m3, unchanged from before 2006. All cotton
gins will be impacted by this standard. The timeline by which this standard will be implemented in the individual cotton belt states will vary by state/district
agency. Although California appears to be the first
state to address these new federal standards, other states such as Texas are currently implementing PM2.5 regulations.
In California, the San Joaquin Valley Air Pollution Control District has proposed to include cotton gins in their PM2.5 State Implementation
Plan (SIP) under the assumption that the PM2.5
emissions from cotton gins are significant enough to
warrant further study and possibly additional control measures above and beyond the current mandate to install enhanced “1D-3D” cyclones on all emission points. In the district’s candidate control measures section of the 2008 PM2.5 SIP, the district considered
additional control measures such as baghouses, series cyclones, and other technologies that can
have substantially higher fixed and variable costs
compared to current control measures. If additional control measures such as baghouses are mandated,
the costs will be significant and will likely impact
ginning costs.
The primary issue affecting the cotton industry across the country in regards to the implementation of the PM2.5 standard is that little scientifically
sound information is available on cotton gin PM2.5
emissions. Some recent research indicated that current PM2.5 sampling methods (developed for
sources that emit PM with a relatively small particle diameter) could be overestimating cotton gin (PM with relatively larger particle diameters) PM2.5
some reports indicated that more than 30% of total cotton gin PM emissions were PM2.5 and others
indicated that this ratio was less than 3%.
States such as Missouri, North Carolina, South Carolina, and New Mexico are or have used dispersion modeling to estimate cotton gin boundary line PM10, particulate matter less than
or equal to 10 microns in diameter, concentration levels for comparison with the NAAQS. Cotton gins in states such as Missouri are finding it
difficult to meet the requirements necessary to
obtain air quality permits through modeling. The EPA-recommended dispersion models used by the states were not developed for low-level point sources such as cotton gins. Several studies included in the literature suggest that these models could be over-predicting cotton gin boundary line concentrations by as much as a factor of 10 (Fritz, 2002; Zwicke, 1998). These modeling errors coupled with the PM2.5 stack sampling errors
could make it extremely difficult for cotton gins
to meet PM2.5 modeled concentration limits set by
the individual states.
In response to this issue, cotton ginners’ associations across the cotton belt, including the National, Texas, Southern, Southeastern, and California associations, have agreed that there is an urgent need to begin collecting gin emissions data that might be used to refute inaccurate data used by state regulatory agencies. At the request of the ginning associations, Oklahoma State University and the USDA-ARS Ginning Laboratories at Lubbock, TX; Mesilla Park, NM; and Stoneville, MS developed a proposal for a four-year study to evaluate cotton gin PM emissions at several gins at locations across the cotton belt. The four objectives of the study were as follows:
1. Develop PM2.5 emission factors and verify
current PM10 emission factors for cotton gins
through stack sampling.
2. Develop a robust data set that can be used in the design, development, and evaluation of current and future air quality low-level dispersion models. This data set will consist of stack and ambient sampling data.
3. Characterize the PM emitted from cotton gins in terms of particle size distribution (PSD), particle density, and particle shape.
4. Collect field data to further quantify federal
reference method (FRM) ambient and stack PM10 and PM2.5 oversampling rates.
PROJECT PLAN
Advisory Groups. Two different advisory groups were formed to aid in project planning. The first advisory group, Gin Advisory Group, included persons from the National, California, Southeastern, Southern, and Texas Cotton Ginners’ Associations, Texas A&M University, Cotton Incorporated, and the National Cotton Council. This group was formed to identify prospective gins for sampling and act as liaison between the gins and the research team, and to aid in securing funding for the project. The second advisory group, Air Quality Advisory Group, included persons on the
Gin Advisory Group and individuals from the EPA, California Air Resources Board, San Joaquin Valley Air Pollution Control District, Texas Commission on Environmental Quality, Missouri Department of Natural Resources, and North Carolina Department of Natural Resources. This group was formed to advise on stack sampling, ambient sampling, equipment, sampler placement, sample handling and laboratory analysis, quality control and assurance protocols, and data analysis and reporting. For the project to be successful and accepted by the industry and regulatory agencies, participation of the two advisory groups was essential.
Based on Gin Advisory Group deliberation, four to seven sampling sites (based on total contributed funds) were targeted for evaluation. Plans included sampling a New Mexico gin in the fall of 2008, one South Texas gin in the summer of 2009, two California gins in fall of 2009, a West Texas and a Missouri gin in 2010, and a North Carolina gin in 2011. All gins included in the plan were saw-type gins with the exception of one
roller gin in California. The identified gins and initial
sampling timeline was flexible due to unforeseen
weather or crop issues. The specific gins sampled were
selected based on the input from the cotton gin advisory group. These gins were to be equipped with similar abatement technologies and process streams similar to: module feeder or suction, No. 1 pre-cleaning, No.
2 pre-cleaning, overflow, No. 1 lint cleaning, No. 2 lint
cleaning, mote fan, mote trash fan, battery condenser, and master trash. If the selected gins were equipped with additional process streams (e.g., feeder, No. 3 pre-cleaning, No. 3 lint cleaning) then those streams would
be sampled in the same manner as the 10 predefined
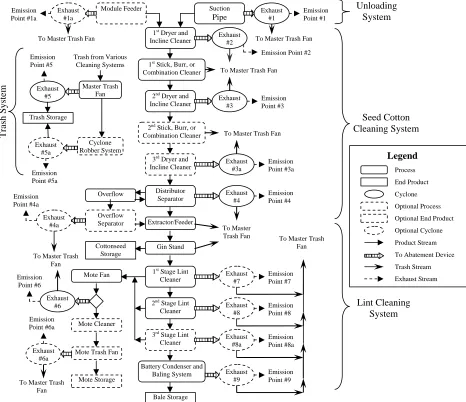
process streams. A generalized cotton gin process
stream flow diagram is shown in Fig. 1. Results from this study included replicated data for the predefined
Stack Sampling. Stack sampling adhered to
EPA protocols and was performed by a certified
stack sampling company under the supervision of the researchers. To maintain better quality control,
the same certified stack sampling company was
used at all sites. Stack sampling methods used with consensus of the Air Quality Advisory Group were:
1. Other Test Method 27 (OTM 27) — Determining PM10 and PM2.5 Emissions
from Stationary Sources — the EPA method for measuring PM2.5 filterable stack emissions
(EPA, 2008), converted to Method 201A by the EPA Administrator on 1 Dec. 2010; 2. Method 201A — Determination of PM10
Emissions (Constant Sampling Rate Procedure) — a standard EPA method for measuring PM10
filterable stack emissions (CFR, 1990); and
3. Method 17 — Determination of Particulate Matter Emissions from Stationary Sources — a standard EPA method for measuring total
filterable stack emissions (CFR, 1978).
The three methods are similar, but employ slightly different equipment to target different sizes of particulate. OTM 27 is a method to measure PM10
and PM2.5 filterable stack emissions. Particulate is
withdrawn isokinetically from the stack through a PM10 sizing cyclone and then a PM2.5 sizing
cyclone and collected on a filter (Fig. 2). Gravimetric
analyses were used to determine the mass for each size fraction. To measure both PM10 and PM2.5 the
method required selecting a gas sampling rate in the middle of the overlap zone of the performance curves for both cyclones. For this study, the method was
used specifically to collect PM2.5 emissions and the
Unloading System Module Feeder Suction
Pipe
1st Dryer and
Incline Cleaner
1st Stick, Burr, or
Combination Cleaner
2nd Dryer and
Incline Cleaner
2nd Stick, Burr, or
Combination Cleaner
3rd Dryer and
Incline Cleaner
Distributor Separator
Extractor/Feeder
Gin Stand
1st Stage Lint
Cleaner
2nd Stage Lint
Cleaner
3rd Stage Lint
Cleaner
Battery Condenser and Baling System Bale Storage Overflow Cottonseed Storage Mote Fan Mote Cleaner
Mote Trash Fan
Mote Storage Exhaust
#1a Exhaust #1
Exhaust #2 Exhaust #3 Exhaust #3a Exhaust #4 Exhaust #7 Exhaust #8 Exhaust #8a Exhaust #9 Emission Point #1a
To Master Trash Fan
Emission Point #1
To Master Trash Fan
Exhaust #6
Exhaust #6a
Emission Point #2
Emission Point #3 Emission Point #3a Emission Point #4 Emission Point #7 Emission Point #8 Emission Point #8a Emission Point #9
To Master Trash Fan
Emission Point #6
Emission Point #6a
To Master Trash Fan
To Master Trash Fan
To Master Trash Fan
To Master Trash Fan
To Master Trash Fan
Overflow Separator Exhaust #4a Emission Point #4a Exhaust #5 Master Trash Fan Cyclone Robber System Exhaust #5a Trash Storage
Trash from Various Cleaning Systems Emission Point #5 Emission Point #5a Process End Product Cyclone Optional Process Optional End Product Optional Cyclone Product Stream To Abatement Device Trash Stream Exhaust Stream Legend Seed Cotton Cleaning System Lint Cleaning System Tra sh Sys te m
gas sampling rate was targeted to optimize the PM2.5
cyclone. Method 201A is a federal reference method to measure PM10 filterable stack emissions. The method
is similar to OTM 27, but does not employ a PM2.5
sizing cyclone in the sampling train (Fig. 3). Method 17 is similar to the other two methods, but uses neither PM10 nor PM2.5 sizing cyclones in the sampler train.
Instead, Method 17 uses a simple, total suspended
particulate nozzle before the filter (Fig. 4). Figure 5
is a photo of the three different stack sampling heads.
Figure 2. Environmental Protection Agency Other Test
Method 27 (method for measuring PM2.5 filterable stack
emissions) sampling train diagram (EPA, 2008).
Figure 3. Environmental Protection Agency Method 201A
- Determination of PM10 Emissions (Constant Sampling
Rate Procedure) sampling train diagram (CFR, 1990).
Figure 4. Environmental Protection Agency Method 17
- Determination of Particulate Matter Emissions from Stationary Sources sampler train diagram (CFR, 1978).
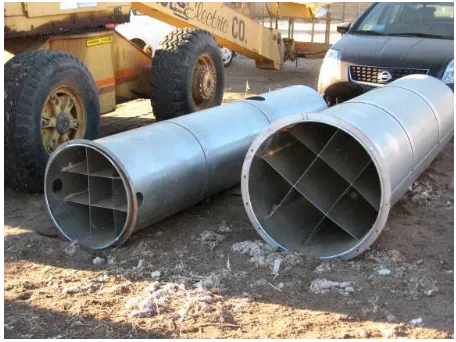
Cotton gin cyclones are typically source sampled via a sampling port in either a cyclone-stack extension or “candy cane”. A cyclone-cyclone-stack extension (Fig. 6) is a section of duct added to the top of the cyclone exit that extends a prescribed distance upwards from the exit and contains straightening
vanes (Fig. 7) to eliminate the cyclonic flow of the air
exiting the cyclone (EPA, 1989). A candy cane (Fig. 8) is a section of duct that is connected to the cyclone exit which, via a 90° elbow, brings the exhaust down to near ground level for easier sampling.
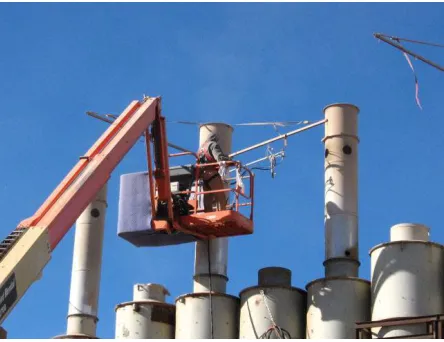
Figure 5. OTM 27 (top), Method 201A (middle), and Method 17 (bottom) sampler heads.
Based on discussions with the Air Quality Advisory Group, a cyclone-stack extension with straightening vanes was attached to each cyclone exit tube prior to the start of a sampling campaign at a
particular gin. The justification for using cyclone-stack
extensions instead of candy canes was as follows: 1. Less impact on ambient sampling.
Three-meter tall extensions in place for the duration of the source and ambient sampling would have less impact on the ambient sampling results than candy canes that would bring the emissions for a source essentially to ground level and would change as they were moved from one source to the next.
2. Time savings. Cyclone-stack extensions could be installed on all cyclones to be tested before actual source testing began. Thus, delays to move
extensions or candy canes while the certified
source tester was on-site would be eliminated. 3. Cost savings. Although 10 or more extensions
would be needed to source test all the stacks at a particular gin, a crane and operator would need to be on-site to install and take down the extensions for only a day or two before and after the source testing period, whereas the crane and operator would need to be on-site most days of sampling to move the candy canes from one stack to the next.
For this project the extensions were designed to meet EPA criteria (EPA, 1989) with overall length of 3 m (10 ft) and sampling port 1.2 m (48 in) above straightening vanes and 0.9 m (36 in) upstream from the extension exit (at least two times the average equivalent diameter of the vane openings downstream of the straightening vanes and at least one-half of the overall stack diameter upstream of the stack outlet) (Fig. 9).
Three replications of each sampling protocol were performed for each process stream. Forty-seven–
millimeter (mm) Zefluor filters (Pall Corporation,
Port Washington, NY) were used as the primary
filters for all sampling methods. All filters were
pre-labeled, pre-weighed, and stored in sealed containers at the USDA-ARS Air Quality Laboratory (AQL) in Lubbock, TX for shipping to the sampling site. After
each test the filters and washes were retrieved in
accordance to EPA respective protocol. The exposed
filters were stored in individual sealed Petri dishes and
packed for transportation to the AQL. Sampler heads were acetone washed according to EPA protocol into pre-weighed tubs and acetone was evaporated on-site at 49°C in a conduction oven housed in the AQL air
Figure 7. Stack extension with straightening vanes.
quality mobile unit. Dried acetone wash containers were then sealed with a pre-weighed lid and placed in individual sealed plastic bags for transportation back
to the AQL. All filters and washes were analyzed by
the AQL. Individual source test reports for each site
were prepared by the investigators and the certified
stack testing company personnel.
4.5, 7.25, and 10 m; (c) ambient temperature, relative humidity, and barometric pressure collected at approximately 1 m; (d)
USDA-ARS-designed flow control and data collection
system electronics; (e) wind speed, ambient temperature, relative humidity, barometric
pressure, and sampler flow rate; (f) data was
stored on-board every 17 sec on secure digital (SD) data cards and relayed to the base station at 5-min intervals with a radio frequency modem.
Figure 9. Stack extension with straightening vanes design.
Ambient Sampling. For the most robust modeling data set, the Air Quality Advisory Group determined that ambient sampling should run concurrently with the stack sampling. The target duration of ambient sampling was 15 d; therefore, ambient sampling was launched before and continued throughout the duration of the stack sampling portion of the study. A set of ambient samples were collected from the ambient sampler network once in every 24-h period. The actual sampling time was less than 24 h and depended on the
time required to change out filters and prepare for the
next run. Ambient air sampling was conducted by the researchers and followed AQL protocol. The equipment used in the ambient sampling network included:
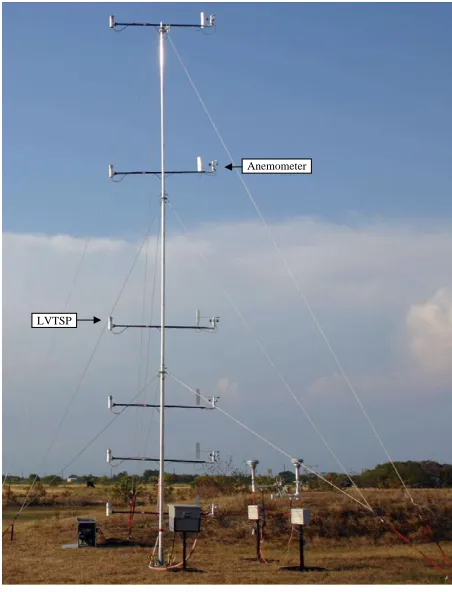
1. Twelve 10-m tower samplers (Fig. 10) with (a) low-volume (16.7 liters per minute (lpm) target flow rate) Texas A&M/USDA-ARS-designed total suspended particulate (LVTSP) (Wanjura et al., 2005) sampler heads located at 1.0, 2.0, 3.0, 4.5, 7.25, and 10 m; (b) MetOne (Grants Pass, OR) 034B anemometers (wind speed and direction) located at 1.0, 2.0, 3.0,
LVTSP
Anemometer
Figure 10. Ten meter tower samplers with low-volume (16.7
lpm target flow rate) equipped with a TAMU-USDA total
suspended particulate (LVTSP) sampler heads and wind
anemometers at 1.0, 2.0, 3.0, 4.5, 7.25, and 10 m.
2. Forty-eight stand-alone PM samplers (Fig. 11) with (a) low-volume (16.7-lpm target
flow rate) sampler heads located 2 m above
the ground and equipped with TAMU-USDA LVTSP sampler head, PM10 sampler head
(Thermo Scientific, East Greenbush, NY),
Well Impactor Ninety-Six (WINS) PM2.5
sampler head (BGI Incorporated, Waltham, MA), or very sharp cut cyclone (VSCC)
PM2.5 sampler head (Thermo Scientific, East
Greenbush, NY); (b) ambient temperature, relative humidity, and barometric pressure collected at approximately 1 m; (c)
system electronics; (d) ambient temperature, relative humidity, barometric pressure, and
sampler flow rate data collected; (e) data
stored on-board every 17 sec on SD data cards and relayed to the base station at 5-min intervals with a radio frequency modem.
Through discussions with the Air Quality Advisory Group, a robust uniform sampling array was developed based on the available sampling equipment to maximize data quality, while minimizing the effects of changing wind direction. The sampling array consisted of samplers located at 30º intervals encompassing the gin at three radial distances from a predetermined center point located near the gin’s main cyclone bank. The radial distances were determined by the available land area associated with each site. As each gin site was
different, this sampling array allowed for flexibility
in sampler location to account for site restrictions. Also, the magnitude and density of the sampling array limited the impact of necessary deletion of some sampling points altogether due to on-site restrictions, such as buildings or roads. An example of an array, with deviations, is shown in Fig. 13. The inner and outer rings were comprised of stand-alone samplers and the middle ring was comprised of tower samplers. In this example, three samplers were not deployed in the inner circle because of site restrictions (e.g., buildings) and several of the samplers on the inner and middle circles were moved to accommodate site restrictions (e.g., roadways). LVTSP
PM10
PM10 with
WINS PM2.5
PM10 with
VSCC PM2.5
Figure 11. Low-volume (16.7 lpm target flow rate) stand-alone
samplers equipped with a TAMU-USDA total suspended
particulate (LVTSP) sampler head, a PM10 sampler head,
a Well Impactor Ninety-Six (WINS) PM2.5 sampler head,
and a very sharp cut cyclone (VSCC) PM2.5 sampler head.
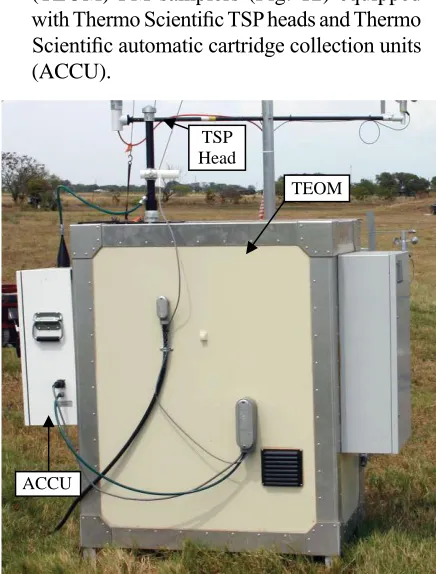
3. Four Thermo Scientific (East Greenbush, NY)
tapered element oscillating microbalance (TEOM) PM samplers (Fig. 12) equipped
with Thermo Scientific TSP heads and Thermo Scientific automatic cartridge collection units
(ACCU).
ACCU
TEOM TSP
Head
Figure 12. Tapered element oscillating microbalance (TEOM) samplers with TSP head and automatic cartridge collection unit (ACCU).
~95 meters ~95 meters ~95 meters GIN
Tower Sampler (PM sampler heads and anemometers located at 1.0, 2.0, 3.0, 4.5, 7.25, and 10.0 meters)
Stand Alone Sampler {PM sampler head located at 2.0 meters}
30°
The number and location of ambient samplers located at each site varied. As previously mentioned, stand-alone samplers with LVTSP sampler heads (Fig. 11) were deployed at each site on the inner and outer rings shown in Fig. 13. For the middle ring of 10-m
tower samplers, one of six different configurations
(Table 1) of samplers was located at each site. Wind
roses were generated from met data for a location
near each site and tower site configurations were
located based on the predominant wind direction.
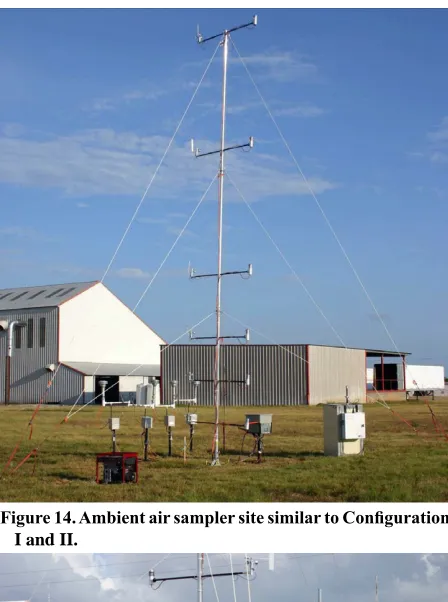
Configurations I and II with a tower sampler, two
collocated PM10 stand-alone samplers, a TEOM
sampler, and two collocated PM10\VSCC-PM2.5 or
PM10\WINS-PM2.5 samplers (Fig, 14) were sited
at locations downwind from the gin cyclone bank.
Configurations III and IV with a tower sampler, a PM10
stand-alone sampler, a TEOM sampler, and a PM10\
VSCC-PM2.5 or PM10\WINS-PM2.5 sampler were
sited at locations upwind and opposite locations for
configurations I and II, respectively. Configurations
V and VI with a tower sampler, a PM10
stand-alone sampler, and a PM10\VSCC-PM2.5 or PM10\
WINS-PM2.5 sampler (Fig. 15) were then alternated
around the middle ring among the remaining sites.
Configurations I and II had collocated VSCC and
WINS sampler heads, respectively, to provide a measure of the variability for the measurements, as recommended by the EPA participants of the Air
Quality Advisory Group. Depending on the final
layout, approximately 125 total ambient sampling points were deployed at each gin.
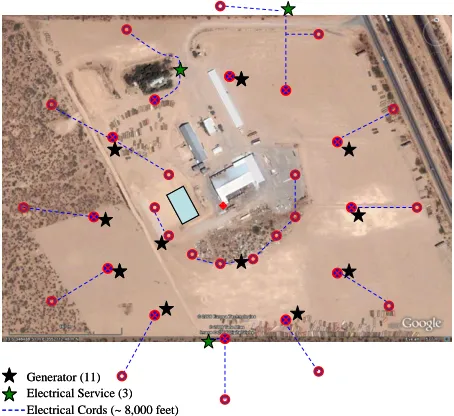
Generally, generators would be required at each sampling site to provide electrical power for the samplers. However, due to number of sampling sites, the need to conduct stack sampling and ambient sampling simultaneously, and the importance of reducing the possible impact of combustion engine emissions on the samples collected, the number of generators was minimized. Each stand-alone ambient sampler draws roughly 0.9 amps, requiring only light
Table 1. Listing of ambient samplers for tower site configurations located at the middle sampler ring.
Configuration
No.
Number of Sites
Samplers in Configuration
10 m Tower Sampler with
LVTSP Headsz
Stand-alone Samplers with
TEOM
Samplerv
PM10
Heady
PM10\VSCC PM2.5
combination headx
PM10\WINS PM2.5
combination headsw
I 1 1 2 2 --- 1
II 1 1 2 --- 2 1
III 1 1 1 1 --- 1
IV 1 1 1 --- 1 1
V 4 1 1 1 ---
---VI 4 1 1 --- 1
---z LVTSP Head: Texas A&M/USDA-ARS-designed total suspended particulate sampler head.
y PM
10 Head: Thermo Scientific ambient PM10 sampler head.
x VSCC PM
2.5: Thermo Scientific very sharp cut cyclone PM2.5 sampler head.
w WINS PM
2.5: BGI Incorporated Well Impactor Ninety-Six PM2.5 sampler head.
v TEOM: Thermo Scientific tapered element oscillating microbalance PM samplers.
Figure 14. Ambient air sampler site similar to Configuration
I and II.
Figure 15. Ambient air sampler site similar to Configuration
Figure 16. Sampler power distribution example.
gauge electrical wire to run approximately 95 m from a power source to a stand-alone sampler. Based on the pre-test site evaluation visits, on-site electrical
service sites were identified and used to the full extent
to reduce the number of gasoline powered generators. An example of routing the power is shown in Fig. 16. In Fig. 16, the dotted lines and stars correspond to electrical lines and power sources, respectively. All electrical lines running though the gin yard in which
the integrity could be compromised by traffic or other
normal activities were buried approximately 15 cm deep. The research team worked closely with the gin
management to identify the most efficient means of
powering the samplers, while minimizing the impact on normal gin operations.
of the 36 sites all be switched off manually and the time recorded within a short timeframe. Then, the
filters from 3.0-, 4.5-, 7.25-, and 10-m tower levels
were changed using man-lifts. As the remaining
tower sampler filters near ground level (1 and 2
m) and the stand-alone samplers at each tower site were changed, the stand-alone sampler and tower sampler pumps were restarted together and the start time recorded. This procedure was repeated for each tower sampler site.
Generator (11) Electrical Service (3) Electrical Cords (~ 8,000 feet) Generator (11)
Electrical Service (3) Electrical Cords (~ 8,000 feet)
Prior to each sampling run, labeled and
pre-weighed 47-mm Zefluor filters were removed from sealed Petri dishes and loaded into filter cassettes in
an enclosed room in the AQL air quality mobile unit.
The filter cassettes, shown in Fig. 17, were stored
in air tight canisters for transportation to and from
the field and were used to facilitate filter changes
reducing time, errors, and possible contamination.
Each deployed sampler head had two filter cassettes. In the field, exposed filters were retrieved from
sampler heads, quickly placed in empty cassettes for transport back to the AQL mobile unit, and replaced
by clean filters in the sampler heads. The exposed filters were extracted from the cassettes in the AQL
mobile unit clean room and sealed in Petri dishes for transport to the AQL in Lubbock, TX. In general, the
protocol for retrieval of exposed filters and loading of clean filters required that the sampler pumps at each
Figure 17. Filter cassette with clean filter being deployed in
an ambient air sampler.
After stack testing and ambient sampling at a particular gin were completed, the SD data storage
cards containing flow data were retrieved from each sampler, all exposed filters were sealed Petri dishes,
all sampler head washes were sealed in containers, all samples were placed in secure enclosures and transported to the AQL in Lubbock, TX for laboratory analysis.
L a b o r a t o r y A n a l y s e s . P r e a n d p o s t
-processing of all filter and wash samples from
the stack and ambient sampling were conducted at the USDA-ARS AQL in Lubbock, TX and followed AQL standard operating procedures (SOP). Depending on the type of sample, this included observational, gravimetric, particle size, and/or particle shape analysis. Each sample was visually inspected for unusual characteristics, such as high cotton lint content or extraneous material.
Digital pictures were taken of all samples, filters
and washes, for documentation purposes prior to further analysis.
Gravimetric analysis was conducted on all
samples. All filters, clean and exposed (pre- and
for 48 h prior to weighing. Filters were weighed in the environmental chamber on a Mettler MX-5 microbalance (Mettler-Toledo Inc., Columbus, OH) after being passed through an anti-static device. To reduce recording errors, weights were digitally transferred from the microbalance to a Microsoft Excel spreadsheet using Mettler’s BalanceLink software. Technicians wore latex gloves and a particulate respirator mask covering the mouth and nose when handling samples to avoid contamination. SOP requires that samples be weighed three times each in batches of 20. If the standard deviation of
the weights for a given sample exceeded 10 μg, the
sample was reweighed as part of the next batch of 20. Once the pre- and post-gravimetric analyses are completed, the data was merged and the total mass
collected on each filter calculated. Gravimetric SOP
for the acetone washes was similar, except a Mettler AG285 balance (Mettler-Toledo Inc., Columbus, OH) was used.
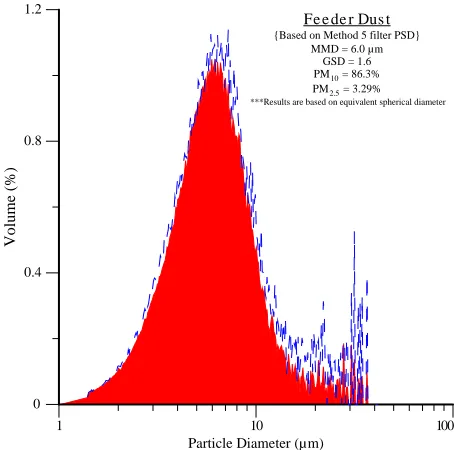
Particle size analysis was conducted on a Beckman Coulter Counter Multisizer III and/ or a Beckman LS 230 laser diffraction system (Beckman Coulter, Inc., Fullerton, CA). Both systems have unique advantages and disadvantages, so both systems were used in the overall analysis to strengthen the overall data set. Sample preparation for all samples was identical and followed AQL SOP (Buser, 2004). An example of information from the particle size analysis is shown in Fig. 18.
Particle size analyses will not be completed on all samples. USDA-ARS SOP requires that lightly loaded samples not be analyzed due to accuracy concerns. When conducting the PSD analyses with the Coulter Counter or laser diffraction system, the number of particles counted would be low and the time required to count those particles greater
than 5 min for a lightly loaded filter, degrading
the accuracy of the test. A sample’s eligibility for particle size analysis will be determined by visual inspection and review of the gravimetric analysis
results. It is expected that all filters and the majority
of the acetone washes from stack sampling will
be analyzed and approximately 50% of the filters
from the ambient sampling will be analyzed. This percentage will be lower for samples collected on days where high wind and/or rain events occurred. It is important to note that particle size analysis is a destructive process so every effort was made to preserve as much sample as possible for additional analyses, such as particle shape analysis. Also, when possible both the Coulter Counter or laser diffraction system analyses will be conducted on a sample.
Data Analyses. The data from each individual gin site were merged and combined with the
corresponding field data. Emission concentrations
and rates were calculated for the ambient and stack data, respectively. Wind roses, snapshot wind site
profiles, temperature and relative humidity profiles,
and ambient concentration contour maps were developed. This information would be captured in individual sampling campaign reports and submitted to collaborators for review. After the completion of all sampling campaigns, the entire set of data would be compiled and prepared for publication.
Reporting. An important aspect of the project plan was reporting. Quarterly and annual reports were submitted to all contributors and participants in the project. Additionally, presentations were made at the various industry and society meetings throughout the project duration. Besides these progress type reports, the end products of the project included several peer reviewed journal manuscripts. The planned publications included coverage of the following results:
1. P M2 . 5 e m i s s i o n f a c t o r s — t h e f i r s t
comprehensive set of cotton gin PM2.5
emission factors published;
2. PM10 emission factors — verifying and
enhancing cotton gin PM10 emission factors
previously published;
1
1 0 100
Particle Diameter (µm) 0
0.4 0.8 1.2
V
olume
(%
)
Feeder Dust {Based on Method 5 filter PSD}
MMD = 6.0 µm GSD = 1.6
PM10 = 86.3%
PM2.5 = 3.29%
***Results are based on equivalent spherical diameter
3. Particulate characteristics — the first comprehensive set of cotton gin particulate characteristics for every unique emissions source from gin plants across the entire cotton belt;
4. Cotton gin modeling dataset — the first comprehensive set of cotton gin emissions d i s p e r s i o n m o d e l i n g d a t a i n c l u d i n g simultaneously collected stack emissions, ambient concentrations, onsite meteorological data, and particulate matter characteristics; and 5. FRM and TSP/PSD comparison — further
documentation of the differences in concentrations measured using FRM samplers and TSP samplers with PSD analyses of the
filters when sampling PM from agricultural
operations.
SUMMARY
The development of PM2.5 emission factors
for gins across the belt will benefit local cotton
gins and state air pollution regulatory agencies by providing accurate, science based data needed to amend cotton gin air quality permits for PM2.5
emissions. Because more and more states are moving towards using dispersion modeling to determine a gin’s eligibility for an operating permit, the development of a high quality data set that can be used to evaluate and modify current dispersion models is critical and urgently needed. This data set could be used to develop new, more accurate models for low-level agricultural point sources,
which would greatly benefit cotton gins and other
agricultural processing facilities. Under current regulatory agency assumptions, cotton gins will be regulated and permitted based on PM2.5 data that are
likely more than 10 to 14 times higher than actual PM2.5 levels. Conducting this comprehensive study
and including state and federal regulatory agencies in all phases of the study will provide science-based information with which policy and regulatory issues can be addressed by state and federal agencies.
The goals of this research project were based on environmental stewardship and economic viability. From an environmental perspective: determination
of scientifically sound PM2.5 cotton gin emissions
data. Will cotton gins meet the upcoming PM2.5
regulations? Will cotton gins have problems obtaining PM2.5 operating permits? From an economic viability
perspective: if state regulatory agencies mandate
additional cotton gin PM2.5 controls, the decisions
need to be based on sound science. If substantial
abatement system changes are mandated, fixed and
variable costs could substantially increase and would likely be passed on to the producers. With cotton production input costs soaring, all input decisions including ginning issues need to be based on sound science. Sound science is a key to ensuring that the US cotton industry remains strong and competitive on the world market.
ACKNOWLEDGMENTS
The authors would like to thank the cooperating gin managers and personnel who generously allowed and endured sampling at their gins. We would like to thank the Texas State Support Committee, Cotton Incorporated, Cotton Foundation, Southern Cotton Ginners Association, California Cotton Growers and Ginners Association, Texas Cotton Ginners Association, Southeastern Cotton Ginners Association, California Air Resources Board, and the San Joaquin Valley Unified Air Pollution Control District for their generous support of this project. The authors would also like to thank Texas A&M University, U.S. EPA, Texas Commission on Environmental Quality, North Carolina Department of Natural Resources, Missouri Department of Natural Resources, National Cotton Council, National Cotton Ginners Association, and USDA Natural Resources Conservation Service for serving on the advisory groups for this project.
DISCLAIMER
Use of a trade name, propriety product or specific
equipment does not constitute a guarantee or warranty by the USDA and does not imply approval of a product to the exclusion of others that may be suitable.
REFERENCES
Buser, M.D. 2004. Errors associated with particulate matter measurements on rural sources: appropriate basis for regulating cotton gins. Ph.D. diss. Texas A&M Univ., College Station.
Buser, M.D., C.B. Parnell, Jr., B.W. Shaw, and R.E. Lacey. 2006b. Particulate matter sampler errors due to the interaction of particle size and sampler performance characteristics: Ambient PM10 samplers. Trans. ASAE 50: 229–240.
Buser, M.D., C.B. Parnell, Jr., B.W. Shaw, and R.E. Lacey. 2006c. Particulate matter sampler errors due to the interaction of particle size and sampler performance characteristics: Ambient PM2.5 samplers. Trans. ASAE 50: 241–254.
Fritz, B.K. 2002. Dispersion modeling of particulate emissions from low-level point sources. Ph.D. diss. Texas A&M Univ., College Station.
U.S. Code of Federal Regulations (CFR). 1978. Method 17— Determination of particulate matter emissions from
stationary sources. 40 CFR 60 Appendix A [Online]. Available at http://www.epa.gov/ttn/emc/promgate/m-17.
pdf (verified 6 Mar. 2012).
U.S. Code of Federal Regulations (CFR). 1990. Method 201A—Determination of PM10 emissions (Constant sampling rate procedure). 40 CFR 51 Appendix M [Online]. Available at http://www.epa.gov/ttn/emc/ promgate/m-201a.pdf (verified 6 Mar. 2012). U.S. Code of Federal Regulations (CFR). 2006. National
ambient air quality standards for particulate matter; final rule. 40 CFR, Part 50. U.S. Government Printing Office,
Washington, D.C.
U.S. Environmental Protection Agency (EPA). 1989.
Particulate sampling in cyclonic flow [Online]. Available
at http://www.epa.gov/ttn/emc/guidlnd/gd-008.pdf
(verified 6 Mar. 2012).
U.S. Environmental Protection Agency (EPA). 2008. Other test method 27 – August 11, 2009: Determination of PM10and PM2.5 emissions from stationary sources (Constant sampling rate procedure) [Online]. Available at http://www.epa.gov/ttn/emc/prelim/otm27.pdf
(verified 6 Mar. 2012).
Wanjura, J.D., C.B. Parnell, Jr., B.W. Shaw, R.E. Lacey. 2005. Design and evaluation of a low-volume total suspended particulate sampler. Trans ASAE 48:1547–1552.