Probabilistic risk analysis in manufacturing situational operation:
application of modelling techniques and causal structure to improve
safety performance
Jose C. Pereirai and Gilson B. A. Limaii
Industrial Engineering Department, Universidade Federal Fluminense - UFF Rua Passo da Pátria, 156, BLOCO D, Niterói, RJ, Brasil, 24.210-240 i [email protected] ii [email protected]
Abstract: The use of probabilistic risk analysis in jet engines manufacturing process is essential to prevent failure. The objective of this study is to present a probabilistic risk analysis model to analyze the safety of this process. The standard risk assessment normally conducted is inadequate to address the risks. To remedy this problem, the model presented in this paper considers the effects of human, software and calibration reliability in the process. Bayesian Belief Network coupled to a Bow Tie diagram is used to identify potential engine failure scenarios. In this context and to meet this objective, an in depth literature research was conducted to identify the most appropriate modeling techniques and an interview were conducted with experts. As a result of this study, this paper presents a model that combines fault tree analysis, event tree analysis and a Bayesian Belief Networks into a single model that can be used by decision makers to identify critical risk factors in order to allocate resources to improve the safety of the system. The model is delivered in the form of a computer assisted decision tool supported by subject expert estimates.
Key words: Probabilistic Risk Analysis, Situation Model, Bayesian Belief Net-work.
1. Introduction
Organizations may fail when they make no investment in a probabilistic risk analysis. This paper aims to present a model for probabilistic risk analysis to be used in the manufacturing of jet engines. The traditional method of assessing the system correctness relies on testing and simulation techniques. The proposed model uses an approach that employs a representation of scenarios based on the analysis of operational situations. The concept of proposed operational status is deal with the structural and behavioral complexity of systems (Beugin et al.,
2007). In the jet engine manufacturing resources are limited; the ultimate decision is one of cost against benefits. An educated guess, based on carefully designed and constructed models, is much better than blindly judgments alone (Ale et al., 2009). The knowledge of experts in the process of jet engines manufacturing can be used to estimate the probability of engine failure. The information obtained from these experts should be combined in a formal way. Clemen and Winkler (1999),
Droguett, Groen and Mosleh (2004) claim that formal procedures are increasingly applied to elicit the opinion of specialists. If the data are obtained systematically from well-informed experts in primary and secondary processes, the opinion of experts can offer acceptable precision in quantification.
Considering the context presented above, this paper aims to present a proposal for probabilistic risk analysis based on Bow Tie methodology for building a combined model with Bayesian Belief Network, which can be used to analyze critical activities that can affect the reliability of the safety system in the manufacturing of jet engines.
The structure of the paper is divided in 5 items. The first item presents the introduction highlighting the importance of probabilistic risk analysis in the jet engines manufacturing process. The second presents a brief description of techniques fault tree, event tree, and Bayesian Belief Network. The third presents the application of probabilistic risk analysis in the manufacturing of jet engines. The fourth describes the results and discussion of the study and the fifth presents the conclusion of the research.
This paper presents an update to the preliminary proposal of systemic application of bayesian belief network coupled to a Bow Tie diagram to identify potential engine failure scenarios (Pereira and Lima, 2014). Risks dversely affect the performance of offshore industry. The understanding of the mutual interaction among various risks, which affect the performance of the offshore outsourcing, is crucial (Kumara et al., 2014). The same approach applies to jet engines manufacturing industry.
2. Modelling Techniques and Causal
Structure in Risk Modelling
Despite the impressive level of safety in aviation, it is generally acknowledged that the accident rate has to be decreased still further. The main reason is the projected growth in air traffic movements (Ale et al., 2006). The management of risks integrated with the operations of the manufacturing reduces accidents (Petersen, 2000) and improves productivity and the economic and financial performance of the company (Nureg, 2001). Accidents result from a combination of factors, such as design errors, mechanical failures, software errors, user errors, and organizational or regulatory factors (Marais and Robichaud, 2012). Based on causal scenarios derived from hazardous events, use of safety goals and risk un-certainty calculations is essential (Kumamoto, 1996). Assigning risk budgets to manufacturing process requires an understanding of how the risks of individual elements in the system influence the overall level of safety. This implies knowledge of causal sequences of engine failure in operation situation. This approach reduces accidents (Petersen, 2000) and improves productivity and the economic and financial performance of the company (Rechenthin, 2004). The proposed model can be an important decision support tool for decision-making. Quantitative risk analysis is an ideal method to map one’s risks, but it has limitations due to the complexity of model and scarcity of data (Marais
and Robichaud, 2012). This limitation needs to be overcome by expert elicitation procedures.
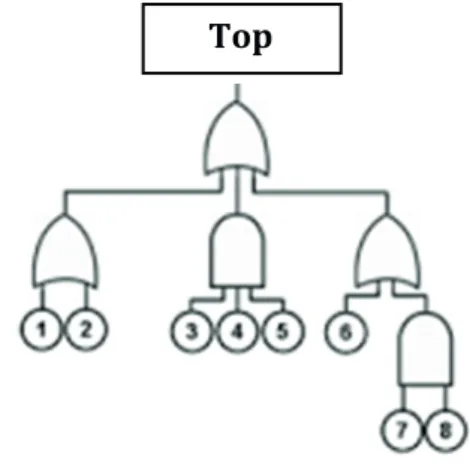
2.1. Fault Tree and Event Tree Modeling H. A. Watson from Bell Telephone Laboratories first conceived fault-tree analysis in 1961. US Air Force also used Fault-Tree to study missiles launch control system. In 1965 Safety Symposium, sponsored by the University of Washington, Boeing Company presented Fault tree, several papers were presented about fault-tree analysis. These papers marked the beginning of a widespread interest in using Fault-Tree Analysis as a system safety reliability tool for complex dynamic systems, such as nuclear reactors. The fundamental concept in fault-tree analysis is the conversion of a physical system into a structured logic probabilistic evaluation diagram (fault tree), in which certain specified causes lead to one specified top event of interest, as shown in Figure 1.
Top
Event
Figure 1. Logical Gates “AND” and “OR”.
Fault trees can adequately describe probabilistic relationships and even the role of human behavior in accident generation. It provides a rigorous way to link causes and effects in a technological system (Rausand, 2011). Data are required for basic events related to human failure, software failure and calibration failure. Missing data are obtained by expert opinion.
hazardous events should be identified and a number of barriers should be planned to mitigate the consequences of events. The fault tree may be combined with the event tree to form a Bow Tie diagram. Each path through the diagram is a scenario. The proposed model employs the combined fault tree and event tree and allows the representation of several scenarios.
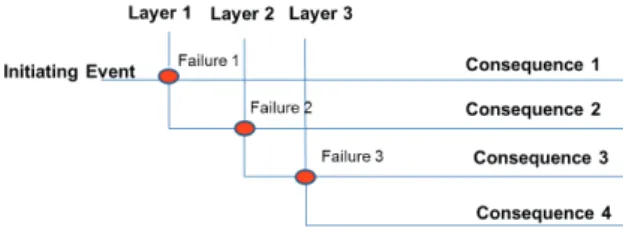
An event tree represents the possible consequences of a hazard or event called initiator event. The construction of an event tree begins with the specification of an initiation event. Figure 2 represents this condition, success leads to a specific consequence and failure leads to the next reactive layer.
Figure 2. Event Tree.
In order to quantify the event tree, the probabilities of occurrence of the initial event and the success or failure of the reactive layers are considered. Considering that the fault trees are used to obtain the probability of a system failure, the fault tree may be combined with the event tree to form a Bow Tie diagram. The pivot event is the final failure event obtained with the fault tree and the initial event for the event tree. The pivot event may occur or not, which leads to different final situations. Each path through the diagram is a scenario. The model combines fault tree, event tree and allows the representation of several scenarios.
2.2. Bayesian Belief Networks Modelling Bayesian Networks (BNs, also called Bayesian Belief Networks (BBNs) provides a causal structure that allows probability risk analysis practitioners to gain deeper insight into risk drivers and into specific interventions that reduce risk (Mosleh, 1992; Rechenthin, 2004). There has been an increase trend in the application of Bayesian networks in fields related to reliability, safety and maintenance (Mahadevan et al., 2001). Bayesian approaches to aggregate expert judgments on probabilities have been extensively investigated in risk and reliability analysis (Mosleh, 1986; Droguett et al.,
2004; Podofillini and Dang, 2013). BNs provide a framework for addressing many of the shortcomings of human reliability analysis from a researcher perspective and from a practitioner perspective (Boring et al., 2010; Groth, Swiler, 2013). External human performance factors depend on company, society and technology (Calixto, 2013).
The Bayesian Network methodology was developed to make predictions easier. It can be defined as graphic frameworks, which represents arguments in uncertain domain. Such frameworks are unicycle Graphs, since they cannot make up closed cycles and have only one direction. The node represents random variables and arcs represent direct dependency between variables. The arcs direction represents cause effect relation between variables. Figure 3 represents the Bayesian Network, being node H consequence from causes T and P. In Figure 3, nodes T and P are fathers of H and are called ancestral of H.
Figure 3. Bayesian Network.
In Human Reliability analysis, for example, the Nodes T and P represents performance human factors and node H represents human error probability conditioned to human performance factors T and P. In each node there is a conditional probability table, which represent variables. General equation (1) represents the probability of occurrence of variable H conditioned to the occurrence of variables T and P.
P(H)= p H 1 T I P j, p T i p P j
j i 0 1 0 1 # # = = = # = # = =
=
/
^ h ^ h ^ h/
(1)Equation (2) estimates the probability of variable H becoming true, conditioned to variables P and T being true or false.
P(H=true)= p(H=true/T=true, P=true)×p(T=true) ×p(P=true) p(H=true/T=true, P=false)×p(T=true) ×p(P=false) p(H=true/T=false, P=true)×p(T=false) ×p(P=true) p(H=true/T=false, P=false)×p(T=false) ×p(P=false)
2.3. Bow Tie Modelling
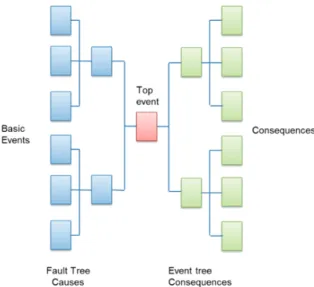
Bow Tie models are tools for integrating broad classes of cause-consequence models. The familiar fault tree and event tree models are ‘Bow Tied’ in this way; indeed, attaching the fault tree’s top event with the event tree’s initiating event originally suggested the Bow Tie terminology. .
A bow-tie chart is used to show the combination of a fault tree on the left and an event tree on the right. Figure 4 shows the fault tree connected via the top event to the event tree.
Figure 4. Bow tie chart.
3. Risk Management in the
Manufacturing of jet engines
The objective of this paper is to develop a probabilistic risk analysis model to analyse the safety of the jet engine manufacturing process. Therefore, the following hypothesis is being addressed in this paper: Causal modelling using Bayesian network with quantitative and expert elicitation process is feasible and has a positive effect on the determination of engine failure in manufacturing situational operation. Risk management examines the different phases of the jet engine manufacturing process to assess, evaluate and control safety conditions. It uses techniques to prevent failures or reduce their consequences to an acceptable level and works to identify critical risks that may affect safety. The risk management process evaluates the diverse system activities (Beugin et al., 2007). For technical systems, risk is related to the probability
of failure of components or of an entire system causing exposure to hazard and related consequences (Esteves et al., 2005). Probabilistic risk analysis provides the framework for evaluating safety in the manufacturing of jet engines in operating situation. Performance management has become a key success factor for any organization (Gurrea et al., 2014). Risk and performance management should be combined with financial management using quantitative and probabilistic risk analysis.
The values of probabilities to feed the model may be obtained by historical data. However the necessary parameters for modelling are not always known with certainty.
Experts may have valuable knowledge about models and parameters for problems in their specific field of interest (Goossens et al., 2008). It is very important to develop practical models with a transparent mathematical foundation for the use of expert opinion (Cooke, 1991; Clement et al., 2005; Brooker, 2011). In the proposed model, the quantification and aggregation of expert’s opinion on human, software and calibration failure provide important input to a decision maker. Approaches that can capture the tacit knowledge of operators and technicians and transform this to the mathematical format required in the predictive models are needed (Rosqvist, 2000). If all of the experts agree on a probability, then the combined probability must also agree (Clemen and Winkle, 1999). The flow chart of Figure 5 represents an overview of the jet engine manufacturing process. The Jet engine manufacturing process represented in Figure 5 starts with the turbine rotor assembly in Process 1. The next process in the sequence is the compressor rotor assembly in Process 2. The turbine and compressor rotors are then attached to one another in Process 3. These three processes are very critical, since the engine components are all assembled with interference, and needs to be heated or cooled properly under controlled conditions. The turbine/compressor rotor are machined together in Process 4 in order to set up the tip of the blades in the required assembly dimensions. Once the rotor is finished, another sub-assembly processes is started, which is the engine core assembly in Process 5. The engine is then finally built up by attaching all the previous assembled submodules together in Process 6.
a defect. In process 7 the engine is submitted to operation l test in a test cell that simulates on wing operation, at this point the engine is run in different conditions including take off, which the most extreme one. In process 8 an internal boroscope inspection of the engine is conducted, where the internal hardware is inspected for damages that might have occurred during the test. This procedure is normally recorded in a video for traceability purposes. In process 9 the engine is reinspected with boroscope at the customer to ensure damages have not occurred during engine transportation. In process 10 the engine is tested on wing by the airframer and in process 11 the engine is also tested on wing in the airline before being put in operation.
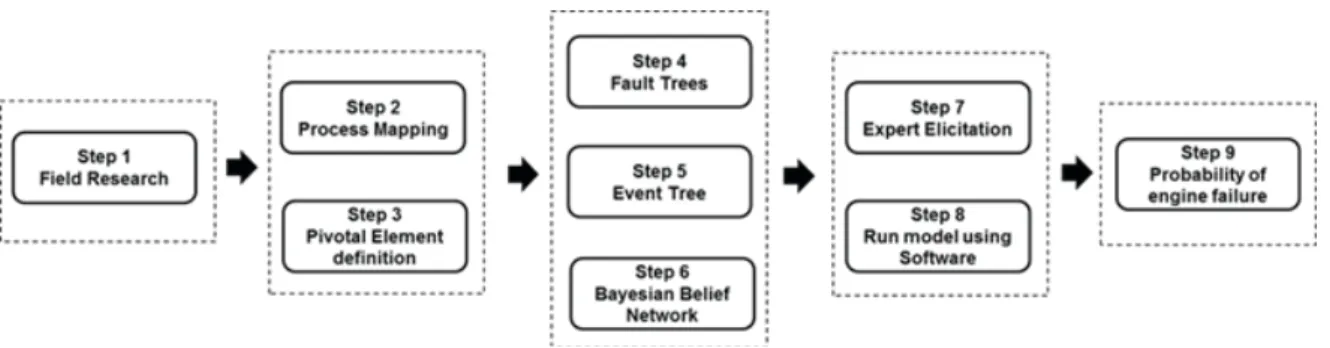
Figure 6 represents the methodology used to build the model. The first step is to conduct a field research with experts in the process. The second step is to build a high-level jet engine assembly process map
(Figure 5). The third is to define the pivotal event that represents a split where the assembled engine could be manufactured right or wrong.
The fourth step is to employ the fault tree, then the event tree (Step fifth) and BBN (Step sixth) to graphically represent the model.
Once the BBN is complete, in the seventh step specialists elicit the probabilities of failure in the different manufacturing processes using structured protocols.
In the eight step, the conditional probability tables of a specific software are completed with the conditional probabilities.
The last step (Step ninth) is to run the free downloadable commercial BBN software named Agena Risk to obtain the final probability of engine failure.
Figure 5. Jet Engine Manufacturing Process.
Probability risk analysis mostly deals with evaluation of components, systems and equipment failure probabilities, human error probabilities and quantification of accident scenarios, which includes modelling of physical processes (Moieni, 1994; Clément et al., 2005). The model is a computer assisted decision tool that combines all the previously mentioned probabilities.
The main advantage of the model is that it provides decision makers with the final probability of engine failure. The drawback is the time it takes to elicit probabilities from experts.
4. Results and Discussion
This paper presents a model that combines fault tree analysis, event tree analysis and a Bayesian Belief Networks that can be used by decision makers to identify critical risk factors in order to allocate resources to improve the safety of the system. The Bayesian belief nets, fault-trees and event trees are combined in an integrated model.
The flowchart of Figure 7 portrays progression of events over time, while BBN, fault-trees and event trees represent the logic corresponding to failure of complex systems. It shows the integrated structure of the model.
The connection between the integrated structure of Figure 7 and the flowchart of Figure 5 are detailed in the next paragraph. In the model, a bow-tie chart is used to show the combination of a fault tree on the left and an event tree on the right. Figure 7 shows the framework of the fault tree connected via the top event ET, which is an incorrect engine assembly, to the base of an event tree.
The latter is branching out from the initiating critical event to potential consequences of engine failure in operation named FO. Figure 7 represents the preventive barriers CP1, CP2 and CP3 for the processes 1, 2 and 3 shown in Figure 1. If the process 1 (IE1 - Turbine Assembly) is performed incorrectly, the preventive layer (CP1 – Turbine Balancing) will detect the mistake, which must be corrected before proceeding with the assembly process. The same process will be followed with the preventive layers CP2 and CP3. The reactive layers CR1, CR2 and CR3 for the processes 7, 8 and 9 also shown in Figure 5. If the engine is assembled incorrectly (ET), the first reactive layer (CR1) will detect the error and the engine will need to be reworked before proceeding with the manufacturing process. The same process will be followed with the reactive layers CR2 and CR3.
The connecting lines from a fault tree basic fault to any event tree branch end consequence form a scenario; so one Bow Tie can show many scenarios (Pereira et al., 2014). Figure 7 shows the factors F1,
F2 and F3 that cause human failure, software failure and calibration failure.
These factors are aggregated by BBN to estimate the probability of occurrence of basic events EB1, EB2 and EB3, as shown in Figure 7 These basic events represent the probability of human failure, software failure and calibration failure respectively. Figure 7 also shows the basic events leading to failure of Intermediate events EI1, EI2 and EI3, which represents the different manufacturing processes, such as the processes 1, 2 and 3 shown in Figure 5. According to the diagram, If ET does not occur; the engine will operate normally (ON). In case ET occurs, the reactive layers CR1, CR2 and CR3 will be in the path and the result will be some kind of rework (RT). If none of the final reactive layers functions, the result will be operational failure (FO). The final probability of engine failure is given by combining all the probabilities.
The probabilities of occurrence of factors F1, F2 and F3 elicited from experts are aggregated with specific BBN software, which will take into account the interdependency among these factors. The fault trees and event trees are converted into BBN’s and then they are aggregated into a larger BBN. In order to validate the model with a practical demonstration,
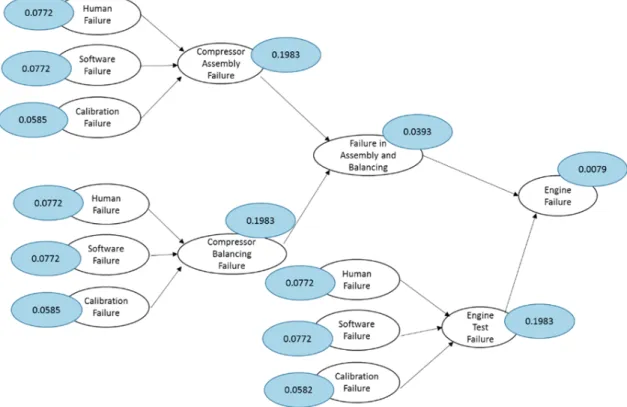
Figure 8 shows an example of a larger BBN aggregating some basic events, intermediate events, preventive layers and reactive layers. Each node has a conditional probability table associated to it. The software Agena Risk adds up the conditional probability values and estimates a final probability for the engine failure.
Figure 8 shows an example of practical application of the general Bayesian network to some limited part of the jet engines manufacturing. This network was obtained with the combination of specific Bayesian networks generated from the fault tree and event trees. The network represents the node “failure in compressor assembly”, the node “failure in compressor balancing” and the node “failure in engine testing”. The Bayesian network software named Agena Risk is used to run the model, the probability values obtained for the nodes are also shown in the Figure 8. The aggregation of all probabilities results in a probability of engine failure of 0.0079. This value was obtained assigning the probability of failure of 0.01 to all primary independent variables. The value 0.01 is just a random value for demonstration purposes. The real values will be elicited from experts.
A failure in testing contributes with a probability of 0.1983. If engine testing is incorrectly conducted
and fails to detect oil and fuel leaks, vibration and poor performance, the engine will fail in operation in the aircraft with serious consequences. A failure in compressor balancing has a probability of 0.0393. In the test failure, the human failure contributes with 0.0772, software failure with 0.0772 and calibration failure with 0.0582. The failure of assembling and balancing the compressor contributes with 0.1983. In the compressor assembly failure, the human failure contributes with 0.0772, the software failure with 0.0772 and calibration failure with 0.0585. The same happens to the failure of balancing.
5. Conclusion
This paper presents a model that combines Fault Tree analysis, Event Tree analysis and Bayesian Belief Networks in an integrated model that can be used by decision makers to identify critical risk factors in order to allocate resources to improve the safety of the system. The result of this study adds to the body of evidence that the methodology for probabilistic risk analysis and causal model in jet engine manufacturing industry is feasible and the model is a powerful tool to be used by decision makers in the jet engine manufacturing industry. The application of the model for probabilistic risk assessment to the manufacturing of jet engines has been presented.
It combines Bayesian belief network fault tree, event tree and Bow Tie in a situational operation. The single homogeneous structure of the model allows consistent handling of probabilities of the factors affecting engine failure and their interdependence. The proposed hypothesis, which is the feasibility of constructing a causal modelling using Bayesian network with quantitative and expert elicitation process for determination of engine failure in manufacturing situational operation, is therefore validated and it may have a positive effect on the jet engines manufacturing safety.
The application of the model to jet engines manufacturing process in a real situation needs to be done in order to identify improvement opportunties. Independent data obtained from experts elicitation process need to be used to complete the conditional probability tables in the software Agena Risk and verify the probability of engine failure.
Result of calculations need to be discussed with the experts to identify discrepancies to be corrected. The causal model can be used as a tool to safety decisions in the industries of jet engines manufacturing.
References
Ale, B.J.M., Bellamy, L.J., Cooke, R.M., Goossens, L.H.J., Hale, A.R., Roelen, A.L.C., Smith, E. (2006). Towards a causal model for air transport safety –an ongoing research project. Safety Science, 44(8): 657-673. doi:10.1016/j.ssci.2006.02.002
Ale, B.J.M., Bellamy, L.J., van der Boom, R., Cooper, J., Cooke, R.M., Goossens, L.H.J., Hale, A.R., Kurowicka, D., Morales, O., Roelen, A.L.C., Spouge, J. (2009). Further development of a Causal model for Air Transport Safety (CATS): Building the mathematical heart. Reliability
Engineering & System Safety, 94(9): 1433-1441. doi:10.1016/j.ress.2009.02.024
Beugin, J., Renaux, D., Cauffriez, L. (2007). A SIL quantification approach based on an operating situation model for safety evaluation in complex guided transportation systems. Reliability Engineering & System Safety, 92(12): 1686-1700. doi:10.1016/j.ress.2006.09.022 Boring, R.L., Hendrickson, S.M.L., Forester, J.A., Tran, T.Q., Lois, E. (2010). Issues in benchmarking human reliability analysis methods: A
literature review. Reliability Engineering & System Safety, 95(6): 591-605. doi:10.1016/j.ress.2010.02.002
Brooker, P. (2011). Experts, Bayesian Belief Networks, rare events and aviation risk estimates. Safety Science, 49(8-9): 1142-1155. doi:10.1016/j.ssci.2011.03.006
Calixto, E., Lima, G.B.A., Firmino, P. R. A. (2013). Comparing SLIM, SPAR-H and Bayesian Network Methodologies. Open Journal of Safety
Science and Technology, 3: 31-41. doi:10.4236/ojsst.2013.32004
Čepin, M., He, X. (2006). Development of a method for consideration of dependency between human failure events. In: Soares CG, Zio E,
editors.Proceedings of ESREL2006: safety and reliability for managing risk, 285-91.
Čepin, M. (2007). Importance of human contribution within the human reliability analysis (IJS-HRA). Journal of Loss Prevent Process
Clemen, R.T., Winkler, R.L. (1999). Combining probability distributions from experts in Risk analysis. Risk Analysis, 19(2):187-203. doi:10.1111/j.1539-6924.1999.tb00399.x
Clément, B., Haste, T. Krausmann, E., Dickinson, S., Gyenes, G., Duspiva, J., de Rosa, F., Paci, S., Martin-Fuertes, F., Scholytssek, W., Allelein, H.-J., Güntay, S., Arien, B., Marguet, S., Leskovar, M., Sartmadjiev, A. (2005). Thematic network for a Phebus FPT1 international standard problem (THENPHEBISP). Nuclear Engineering and Design, 235(2-4): 347-357.
Cooke, R.M. (1991). Experts in uncertainty. Opinion and subjective probability in science. Oxford University Press.
Droguett, E.L., Groen, F., Mosleh, A. (2004). The combined use of data and expert estimates in population variability analysis. Reliability
Engineering & System Safety, 83(4): 311-321. doi:10.1016/j.ress.2003.10.007
Esteves, A. da S., Quelhas, O.L.G., Lima, G.B.A. (2005). Process Risk Assessment and Management in a Petroleum Production Nucleus.
Petroleum Science and Technology, 23(5-6): 611-639. doi:10.1081/LFT-200032883
Groth, K., Swiler, L.P. (2013). Bridging the gap between HRA research and HRA practice: A Bayesian network version of SPAR-H. Reliability
Engineering & System Safety, 115: 33-42. doi:10.1016/j.ress.2013.02.015
Gurrea, V., Alfaro-Saiz, J., Rodríguez, R., Verdechob, M. (2014). Application of fuzzy logic in performance management: a literature review.
International Journal of Production Management and Engineering, 2(2): 93-100. doi:10.4995/ijpme.2014.1859
Kumamoto, H., Henley, E.J. (1996). Probabilistic risk assessment and management for engineers and scientists. IEEE Press.
Kumara, S., Sharma, R.K., Chauhan, P. (2014). ISM Approach to Model Offshore Outsourcing Risks. International Journal of Production
Management and Engineering, 2(2): 101-111. doi:10.4995/ijpme.2014.2096
Goossens, L.H.J., Cooke, R.M., Hale, A.R., Rodić-Wiersma, Lj. (2008). Fifteen years of expert opinion at TUDelft, Safety Science, 46(2): 234-244. doi:10.1016/j.ssci.2007.03.002
Lahtinen, J., Valkonen, J., Bjorkman, K., Frits, J., Niemelä, I., Heljanko, K. (2012). Model checking of safety-critical software in the nuclear engineering domain. Reliability Engineering & System Safety, 105: 104-113. doi:10.1016/j.ress.2012.03.021
Mahadevan, S., Zhang, R., Smith, N. (2001). Bayesian networks for system reliability reassessment. Structural Safety, 23(3): 231-51. doi:10.1016/S0167-4730(01)00017-0
Marais, K.B., Robichaud, M.R. (2012). Analysis of trends in aviation maintenance risk: An empirical approach. Reliability Engineering &
System Safety, 106: 104-118. doi:10.1016/j.ress.2012.06.003
Moieni, P., Spurgin, J.A., Singh, A. (1994). Advances in HRA, methodology. Part I: frameworks, models and data. Reliability Engineering &
System Safety, 44(1): 27–55. doi:10.1016/0951-8320(94)90105-8
Mosleh, A., Apostolakis, G. (1986). The assessment of probability distributions from Expert opinions with an application to seismic fragility curves. Risk Analysis, 6(4): 447-461. doi:10.1111/j.1539-6924.1986.tb00957.x
Mosleh, A. (1992). Bayesian modeling of expert-to-expert variability and dependence in estimating rare event frequencies. Reliability
Engineering & System Safety, 38(1-2): 47-57. doi:10.1016/0951-8320(92)90104-S
Netjasov, F., Janic, M. (2008). A review of research on risk and safety modelling in civil aviation. Air Transport Management, 14(4): 213-220. doi:10.1016/j.jairtraman.2008.04.008
Nureg. (2001). Fault Tree Handbook Nuclear Regulatory Commission. Nureg.
Pasman, H., William, R. (2013). Bayesian networks make LOPA more effective, QRA more transparent and flexible, and thus safety more definable! Journal of Loss Prevention in the Process Industries, 26(3): 434-442. doi:10.1016/j.jlp.2012.07.016
Pereira, J. C., Lima, G. B. A., Sant’Anna, A. P., Peres, L., Pizzolato, N. (2014). Causal Model for Probabilistic Risk Analysis of Jet Engine Failure in Manufacturing Situational Operation (CAPEMO). International Journal of Engineering Science and Innovative Technology, 3(3): 701-717.
Pereira, J.C., Lima, G.B.A. (2014). Probabilistic Risk Analysis in Manufacturing Situational Operation. Phd Seminar. CIO-ICIEOM-IIIEC 2014. Malaga, Spain.
Petersen, D. (2000). Safety management our strengths & weaknesses. Professional Safety, 16-19.
Podofillini, L., Dang, V.N. (2013). A Bayesian approach to treat expert-elicited probabilities in human reliability analysis model construction.
Rausand, M. (2011). Risk Assessment. Theory, Methods and Applications. John Wiley & Sons, Inc.
Rechenthin, D. (2004). Project safety as a sustainable competitive advantage. Journal of Safety Research, 35(3): 297-308. doi:10.1016/j. jsr.2004.03.012
Roelen, A. (2008). Causal risk models of air transport: Comparison of user needs and model capabilities. Engineering Technische universitat Delft. Thesis submitted for the degree of Doctor, 2008.
Rosqvist, T. (2000). Bayesian aggregation of experts’ judgment on failure intensity. Reliability Engineering & System Safety, 70(3): 283-289. doi:10.1016/S0951-8320(00)00064-8