187
DINAMICS OF ROMANIAN SYLVICULTURE BETWEEN 1990- 2011
IORDACHE COSTELA
Keywords: sylviculture, forest land, dynamics, county, Romania
ABSTRACT
At the end of the year 2011, forest and other forest land in Romania totaled 6522 thou hectares, making up a share of 28,3% of the total land area of the country, ranking at 17th spot in the EU, 8,0% below the EU average. The present study is focused on analyzing a series of indicators such as forest land trends, forest land by county, forest species composition, ownership structure, harvested wood volume , cutting wood area, forest regeneration, afforestation trends between 1990- 2011
INTRODUCTION
The sylviculture is a branch of the economy that includes the planning and protection of the heritage forests, providing the raw material for the forest industry (DEX, 1998, p.987). In other words, the sylviculture is the branch of the national economy linked to the activities of planting, maintenance and protection of forests, as long as the biological process continues until the exploitation stage (I.N.S, 2013, p.5).
MATERIAL AND METHOD
For the preparation of this study I used as basic material the statistical data from the National Institute of Statistics.The processed data correspond to the period 1990- 2011.The methodology of research focused on the use of the following method: statistico- mathematics, statistics- graphics,analysis and synthesis.
RESULTS AND DISCUSSIONS
During 1990 - 2011, the growing stock area has extended from 6.371 million ha to 6.522 million ha, which means 151 000 additional ha, an increase of 2.4%. The analysis (Fig. 1 ) shows a negative trend in the first decade, with an average annual regression of 0.5 thousand ha, and during 2000-2011 there was registered an average annual increase of 14 180 ha.
Fig.1 The evolution of forest area between 1990-2011
188
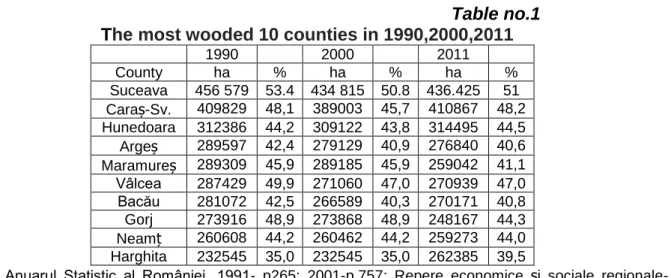
Table no.1 The most wooded 10 counties in 1990,2000,2011
Source: Anuarul Statistic al României, 1991- p265; 2001-p.757; Repere economice și sociale
regionale-2013-p.357-361
The table no. 2 shows the evolution of the least wooded 10 counties. In comparison to the first reference year, at the end of the analyzed period, there is a decrease in the forest area with 3678 ha (1.0%), with most significant decrease (16.4%) in Galați county and with an expansion of 4638 ha (16.6%) in Brăila county
Table no.2 The least wooded 10 counties in 1990,2000,2011
1990 2000 2011
County ha % ha % ha %
Călărași 21838 4,3 21867 4,3 22051 4,3
Brăila 23223 4,9 26000 5,5 27861 5,8
Mun.
București
25531 14,0 25936 14,2 26411 14,5
Ialomița 25855 5,8 25970 5,8 26318 5,9
Teleorman 29615 5,1 26206 4,5 28960 5,0
Constanța 37368 5,3 35371 5,0 38934 5,5
Giurgiu 37637 10,7 38106 10,8 38823 11,0
Galați 45036 10,1 36273 8,1 37658 8,4
Botoșani 57215 11,5 57215 11,5 56361 111,3
Olt 57745 10,5 58301 10,6 54008 9,8
Source: Anuarul Statistic al României, 1991- p265; 2001-p.757; Repere economice și sociale
regionale-2013-p.357-361
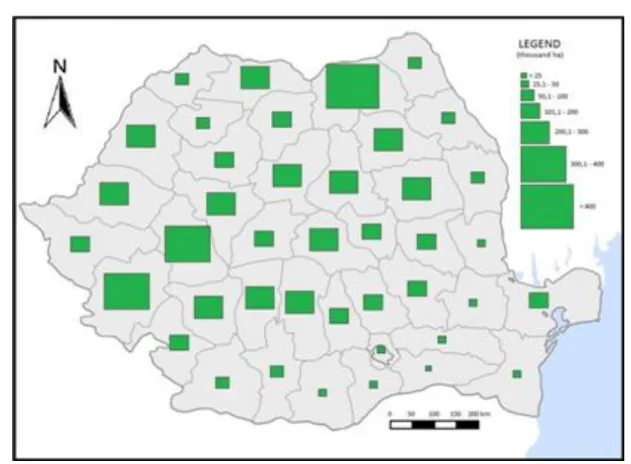
The geographical distribution of the growing stock per counties in 2011 is
particularly heterogeneous, due to geo-ecological and socio-economic conditions of the administrative units. We observe the favourable positions of the counties: Suceava (436,425 ha), Caraș-Severin (410,867 ha), Hunedoara (314,495 ha), Argeș, Vâlcea, Bacău, Harghita, Neamț, Maramureș and Gorj (above 200 hectares each). At the opposite pole there are the counties: Călărași (22051 ha), Ilfov (25779 ha), Ialomița (26318 ha) (Fig.2).
1990 2000 2011
County ha % ha % ha %
Suceava 456 579 53.4 434 815 50.8 436.425 51
Caraș-Sv. 409829 48,1 389003 45,7 410867 48,2
Hunedoara 312386 44,2 309122 43,8 314495 44,5
Argeș 289597 42,4 279129 40,9 276840 40,6
Maramureș 289309 45,9 289185 45,9 259042 41,1
Vâlcea 287429 49,9 271060 47,0 270939 47,0
Bacău 281072 42,5 266589 40,3 270171 40,8
Gorj 273916 48,9 273868 48,9 248167 44,3
Neamț 260608 44,2 260462 44,2 259273 44,0
189
Fig 2 The forest land by county, in 2011
In 2011, most of the growing stock (66.1%) was public property of the state, administered mainly by the Autonomous Department of Forests, and 33.9% was private
property owned by individuals or legal entities.
The share of forests in the total forest area decreased from 98.1% in 1990 to 97.6% in 2011, but their area increased from 6.252 million ha to 6.365 million ha, i.e. an increase of 1.8%.
The volume of harvested timber increased from 16,547 thousand m3 to 18,705 thousand m3 gross volume, representing an additional of 13%. It is worth mentioning the strongly oscillating evolution with continuous decrease until 1994 and with the inflection point in 1998, when there was recorded the minimal amount of harvested timber, of 12.642 thousand m3.
In terms of species, we observe the upward trend of conifers, from 34.9% to 40.2% and from 29.9% to 33.0% of the beech. The share of various species (acacia, maple, ash, walnut, etc.) records a downward trend from 12.4% to 0.4%. The same negative trend was recorded by the various softwood species (linden, willow, poplar, etc.) which lost 3.4 percentages in the analyzed period.
190
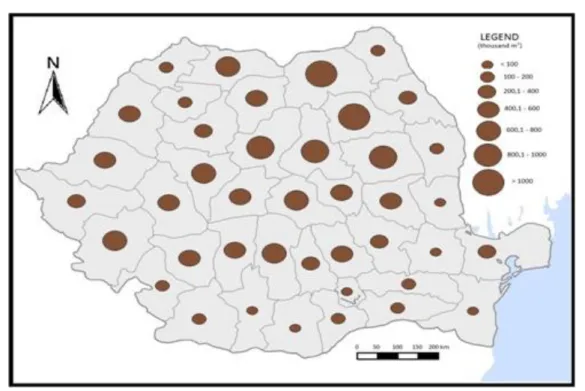
Fig. 3 The harvested wood volume by county in 2011
Regarding the structure of the harvested wood in the main destinations, it is dominant for the certified legal persons; it is worth mentioning the reduction of the wood percentage for the individuals, forest owners with the entry into force of Law no. 46/2008 (the Forest Code) so that if in 2008 these destinations represent 6.4% of the total, in 2010 it reached a minimum of the period, of 2.3%.
In terms of ownership in the last year of reference, the volume of timber was distributed as follows: 52.2% of public property forests, 28.2% of private forests, 16.9% of public property forests of the administrative-territorial units, and the remaining 2.7% of forest vegetation located on lands outside the forest.
The structure of the harvested timber volume on wood products category is dominated by primary products, which share is of 70.3%, they are followed by secondary products, holding 19.2% and hygiene products, representing 10.5 % of the total.
The woodcuttings area extended from 72 915 ha to 107 690 ha, which is almost
double (47.7%) in the two analyzed decades. The share of the surface with forest
regeneration cuttings was reduced by 18.3 percentages, from 91.2% (66 493 ha) in 1990
to 72.9% (78 536 ha) in 2011. Concomitant, the coppice regeneration cuttings have expanded, the areas increasing from 3109 ha (representing 4.5% of the total area covered with regeneration cuttings) to 4097 ha (7.5%) in 2000 to 4565 ha (4.2%) in 2011. The
substitutions - recovery cuttings followed a downward curve from an area of 3313 ha to
1480 ha, respectively 1088 ha in 2011, as opposed to conservation cuttings which share reached 22.9% in the last year of reference.
The analysis of statistical data on the structure of forest regeneration cuttings, highlights the following issues:
- a strong reduction of gardening cuttings which share decreased from 42.6% to 6.2%;
- progressive cuttings doubled their share from 40.2% to 81.4%;
- a decrease by 6.8% of the successive cuttings percentage (from 13.2% to 6.8%, with a maximum of 22.6% in 2000;
- the total cuttings which require the total harvest of wood, had lower shares throughout the studied period, representing between 4% and 5.56% of the total area with coppice regeneration cuttings.
In addition to the mentioned types of treatments, there were performed other cuttings such
191
the hygiene and cleaning of forests on a surface decreased by 55.3%, or accidental
cuttings reduced by 16%.
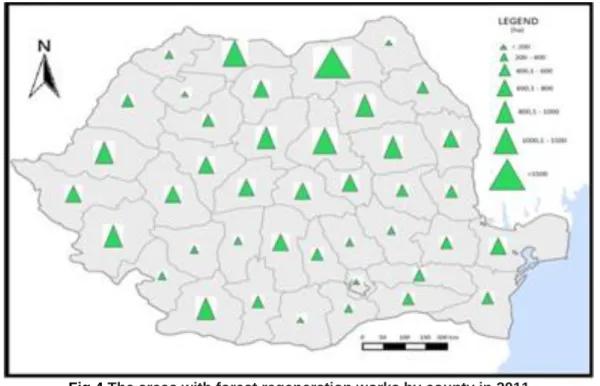
In 2011, the area of forest regeneration works totalled 25,727 ha of which 57.1% were natural. The geographic distribution map of areas with forest regeneration works in 2011 (Fig.4) reveals major discrepancies in the counties. On one hand, there are observed administrative-territorial units with large areas, as in the case of the counties: Suceava (2764 ha), Harghita (1322 ha), Maramureș (1091 ha), Dolj (965 ha), Caraș-Severin (962 ha), Arad (936 ha), Neamț (908 ha), Mureș, Bacău, Sibiu, Tulcea and Bistrița-Năsăud. On the other hand, there are the counties where this type of works was carried out on small areas, such as in the following cases: Sălaj (121 ha), Botoșani (133 ha), Teleorman (139 ha), Ilfov (171 ha).
The afforestations decreased from 25489 ha in 1990 to 11499 ha in 2011(54,9%).Afforestations with coniferous trees decreased by 36,4% from 9195 ha în 1990 to 5741 ha in 2011;afforestations with broad-leaved trees decreased by 58% from 16150 ha to 5758 ha. In other words, in terms of species, we observe the upward trend of conifers, from 36,1% to 49,9% and negative trend from 63,4% to 50,0% of broad-leaved trees.
Fig 4 The areas with forest regeneration works by county in 2011
CONCLUSIONS
The sylviculture is the branch of the national economy linked to the activities of forests, providing the raw material for the forest industry.
During 1990 - 2011, the growing stock area has extended from 6.371 million ha to 6.522 million ha, which means 151 000 additional ha, an increase of 2.4%. The negative evolution of the first analyzed period was determined by the massive exploitation, often illegal of the forest, by the legislative ambiguity regarding the retrocession and infringement of the law in the forestry sector.The constant positive growth since 2003 refers to the public domain and is due to the policy makers’ accountability regarding the protection and conservation of the biodiversity.
192
BIBLIOGRAPHY
1.Giurgiu, V.(coord.),2005- Pădurea şi modificările de mediu. Editura Academiei Române, Bucureşti
2.Drăgoi, M.,2000- Economie forestieră, Edit. Economică, București
3.Milescu, I., 2002- Economie forestieră, Edit. Crai Nou- Mușatinii, Suceava 4.Ungur, A., 2008- Pădurile României, Edit. Delavada, Bucureşti
5.***1984,Geografia României, vol. II, Geografie umană şi economică, Edit. Academiei, Bucureşti
6.***1998-Dicționarul Explicativ al Limbii Române, Edit. Univers Enciclopedic, București 7.***1991, 2001- Anuarul statistic al României, I.N.S.,București