Research Article
a
July
2019
International Journals of Advanced Research in
Computer Science and Software Engineering
ISSN: 2277-128X (Volume-9, Issue-7)
Role of Tailorability to Access Software Product Line Orthogonal
Variability Model Maintainability
Satinderjit Kaur Gill
Amita Sharma
Abstract: Software product line is defined as a set of similar software systems that sharejoint and managed set of features to satisfy the specific need of a particular market segment and these are developed from core assets in a prescribedway1. All the systems that come in product line have commonalities and variability. Anincreasing trend in software development is the requirement to develop new multiple and similar products at same time instead of single individual product. There may be quite a lot of reasons behind this. For continue the function of any product and developit as needed, it is important to look upon all the quality attributes that may affect it in future. There can be two types of quality attributes: internal and external. We can directly measure the internal quality attributes on the basis of product features such as size, length or complexity. Whereas there are external attributes like efficiency, reliability and maintainability. The maintainability which can be measuredrelating to how software relates with its environment and consequently, can be measured one time the software systems fully developed and deployed. Maintainability is one of these external quality attributes that is much valued at the present time. Maintainability is according to ISO/IEC 9126 standard means “the capability of software product to be modified.In current research we predict how the tailorability will predict OVM product line maintainability by using of developed metrics.
Keywords: Software Product Line, Orthogonal Variability Model, Tailorability, Maintainability, Empirical evaluation.
I. INTRODUCTION
As defined by Clements, Software product line is “A set of similar software systems that share a common and managed
set of features to satisfying the specific needs of a particular market segment”1. Rather than developing a single product, the growing tendency in software engineering is to develop several product and similar products at one time. Software product line engineering (SPLE) offers a solution to eradicate this particular type of problem. Line means a set of products those are linked and share commonalties like data structure, software components, some features and architecture etc.3. Software product line(SPL) is a set of similar software systems that share a common, managed set of features to satisfy the specific needs of a particular market section that are developed from common set of core assets in prescribed way2.Software product line has two phases: domain engineering and application engineering. In domain engineering,shared software artifacts are designed and developed for reuse. In application engineering, the particular products are derived by reusing a set of afore mentioned domain artifacts4.Relating to the newest software quality model which is proposed by an ISO i.e. ISO/IEC 9126 model, Maintainability is the characteristic that is ability of software product to be amended. Maintainability is one of the external quality attributes. Others are Functionality, Efficiency, Portability, Reliability and Usability. All these characteristics have their own sub characteristics1. Maintainability is such ansignificant quality attribute and management of this is still a problematic area. Maintainability is concerned with assessing how well the model is analyzable or changeable. The level of maintainability acts as a major determinant of the success or failure of the product line.
Although various attempts have been done in the domain of software measurement for improving product quality, but most of them practices the goal of evaluations in late stages by using quantitative measurements by nature. Measuring quality at early phase of development is the key area to develop high quality software product line.
In a nutshell, the major contributions of this paper are:
a) To describe the benefits of assessing maintainability quality attribute in reference to SPL orthogonal variability models.
b) Development of new metrics to assess SPL orthogonal variability models maintainability.
c) To empirically validate the developed metrics to assess OVM Maintainability.
ISSN(E): 2277-128X, ISSN(P): 2277-6451, pp. 27-31
II. OVM
Orthogonal variability model is one of the best methodologies for modeling the variability in SPL. OVM is a proposal for documenting software product line variability5. In OVM, only variability of product line can be documented. In this model VP (Variation Point) that documents a variable item and V(Variant) documents the possible instances of that variable item. All the variation points are related to at least one variant and each variant (V) is related tone VP. Both VPs and Vs. can be either mandatory or optional. A mandatory VP must always be bound i.e. all the products of the product line must have this VP and its Vs must always be chosen. An optional VP does not have to be bound, it may be chosen to specific products. Always that a VP, mandatory or optional, is bound, its mandatory Vs must be chosen to a specific product. Always that a VP, mandatory or optional is bound, its mandatory Vs must be chosen and is optional Vs can, but do not have to be chosen6.
The following diagram shows the example of OVM Product line:(Ref from website).
III. MAINTAINABILITY AND ITS SUB CHARACTERISTIC ANALYZABILITY
According to ISO the term quality can be defined as “the totality of characteristics of an entity that bear on its ability to satisfy stated or implied needs.1 For continue the function of any Product and evolve as needed, it is imperative to look upon all the quality attributed that may affect it in future. Quality attribute can be categorized into two categories: internal and external. It is an indirect measurement based on internal quality attributes is devised. The reason being that internal quality attributes are suitable determinants for external quality attributes. One of these external quality attribut es that is much valued at the present time is maintainability.. Maintainability is one of such external quality attributes is
concerned with evaluating how well the developed software models can be understood changed and analyzed8. Research
in the field of empirical software engineering has already shown that internal quality attributes can be appropriate determinants of external quality attributes 9,10.
Observing that the potential future significance of maintainability standards, it seems reasonable enough to study and analyze measures to assess maintainability quality attributes in reference to OVM product line. This assessment will lead to increased maintainability eventually leading to increase productivity, usage, adoption, satisfaction of user, and reduced development time and cost.
IV. EXPERIMENT DESIGN AND SETUP
A) VARIABLES
1. Independent Variables:
In our research we will develop our own independent variables. To which we categorize as independent because within the cause- effect relationship which is our major concern, they will represent the cause, i.e. we want to study if these metrics are or are not correlated with maintainability of software product line OVM.
2. Dependent Variables:
In our experiments the dependent variable will sub characteristics of maintainability i.e. analyzability.
B) OBJECTS OF STUDY:
ISSN(E): 2277-128X, ISSN(P): 2277-6451, pp. 27-31 C) VALIDATION OF DATA
Once we collected data, to ascertain the degree of consent among the subjects we employed the Cronbach‟sAlpha11. This analysis is important as the subject should reach a certain level of agreement else convincing conclusions cannot be drawn. That‟s why we used Cronbach‟s Alpha to retrieve the level of resemblance among the qualitative behavior of the participants. Results are shown in table 1.obtained from test.
Table1. Cronbach‟s Alpha For Degree Of Resemblance Between The Opinions Of The Participants
No of Items Tailorability
14 .815
As seen in above table that the degree of similarity of all the participants is above than 8. It indicates that there exists a reasonable agreement between participants. As a result this reliability analysis, we conclude that it is reliable fo r further analysis.
Data Analysis
All the OVM models which we used in our experiment are from different domain and thus form satisfactory set of objects of study. They are also differs in metric values. The data collected empirically is also quantitatively reasonable. The quantity of data validates this. We have 2100data points as participants‟ opinion (14 OVM models and 150 participants 1 sub characteristics). We applied these techniques for few prospective:
Table.2 To study inter correlation between tailor ability and developed metrics RoM
dtV
NTop V
NTop VP
RoC RoA
ltVP Tail
orab ility
Pearson Correlati
on
-.624
-.844**
-.207 .174
-.133
Sig.(2-tailed)
.017 .000 .478 .551 .651
As we see in table two metrics out of five has significant Correlation between developed metrics and tailorability. But it does not mean that we cannot predict maintainability by using these metrics. That‟ why, we perform multiple regression analysis to prove this.
Multiple regression analysis performed to predict the model for Tailorability
Tailorability:Tailorability is a loose term used in component-based software development to describe the ability to customize and configure components, but also to add new components to the system and combining services of multiple components in novel ways.
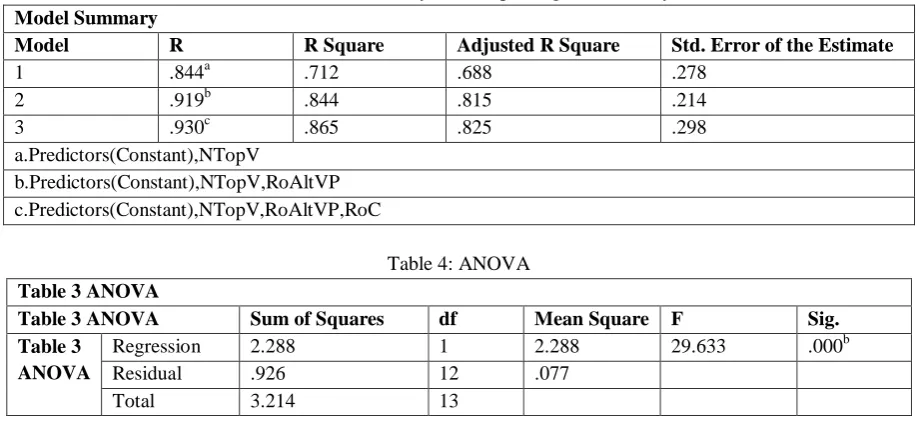
Table 3: Model Summary of Multiple Regression Analysis
Model Summary
Model R R Square Adjusted R Square Std. Error of the Estimate
1 .844a .712 .688 .278
2 .919b .844 .815 .214
3 .930c .865 .825 .298
a.Predictors(Constant),NTopV
b.Predictors(Constant),NTopV,RoAltVP c.Predictors(Constant),NTopV,RoAltVP,RoC
Table 4: ANOVA
Table 3 ANOVA
Table 3 ANOVA Sum of Squares df Mean Square F Sig. Table 3
ANOVA
Regression 2.288 1 2.288 29.633 .000b
Residual .926 12 .077
ISSN(E): 2277-128X, ISSN(P): 2277-6451, pp. 27-31
Table 3 ANOVA
Regression 2.712 2 1.356 29.727 .000c
Residual .512 11 .046
Total 3.214 13
Table 3 ANOVA
Regression 2.781 3 .927 21.402 .000d
Residual .433 10 .043
Total 3.214 13
a. Dependent Variable: Tailorability
b. Predictors: (Constant), NTopV
c. Predictors(constant),NTopV,RoAltVP
d. Predictors(constant),NTopV,RoAltVP,RoC
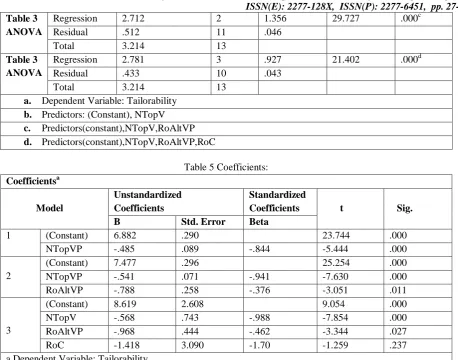
Table 5 Coefficients:
Coefficientsa
Model
Unstandardized Coefficients
Standardized
Coefficients t Sig. B Std. Error Beta
1 (Constant) 6.882 .290 23.744 .000
NTopVP -.485 .089 -.844 -5.444 .000
2
(Constant) 7.477 .296 25.254 .000
NTopVP -.541 .071 -.941 -7.630 .000
RoAltVP -.788 .258 -.376 -3.051 .011
3
(Constant) 8.619 2.608 9.054 .000
NTopV -.568 .743 -.988 -7.854 .000
RoAltVP -.968 .444 -.462 -3.344 .027
RoC -1.418 3.090 -1.70 -1.259 .237
a.Dependent Variable: Tailorability
Inference:
In table3 , The „R‟ column represents the value of r, the multiple correlation coefficients. R can be considered as one of the measures of the quality of prediction of the dependent variable. The “R Square” column represents the R2 value, which is the proportion of variance in the dependent variable that can be explained by ratio of alternative variation points explain 93.0% of the variability of dependent variable i.e. tailorability. No of top variants and ratio of alternative variation points collectively explain 91.9 of variability of tailorability and number of top variants independently explains only 84.4% of variability of tailorability. Rest all the variables are excluded due to high level of tolerance.
In table 4, the F-ratio in the ANOVA table tests whether the overall regression is good fit for data or not. Statistically speaking, the metrics named Number of top variants; Rigidity of Configuration and ratio of alternative variation points can be significantly predict the level of dependent variable tailorability. F value of 21.372 is significant at the 0.000 level (i.e. the regression model is a good fit of the data).
In table 5, the significance value of predictors in model 3, also shows that the metrics are significant as well as strong predictors of tailorability, therefore, with the help of metrics used in model 3 tailorability can be predicted. Therefore referring to the results of table 4, we formed following equation:
Tailorability= 8.619-.568(NTopV)-.968(RoAltVP)-1.418(RoC)
V. RESULTS VERIFICATION
For the verification of results we calculated the values of 14 models by using the linear equation which we formed from regression analysis and then we compared these values to subjective opinions of respondents which we got through questionnaire. There is 85.5% similarity between opinions and values calculated from equation. This proves that we can predict the maintainability by using these metrics. Tailorability can predict the model for maintainability of OVM product line.
VI. CONCLUSION AND FUTURE
ISSN(E): 2277-128X, ISSN(P): 2277-6451, pp. 27-31
REFERENCES
[1] P. Clements, L. Northrop and L.M. Northrop, Software Product Line: Practices and Patterns. Addison-Wesley
Professional, August 2001.
[2] ISO/IEC 9126-1:2001, Software Engineering-Product Quality-Part 1: Quality Model, Int‟ 1 Organization for Standardization,2001, : URL: http://www.iso.org.
[3] GeetikaVyas, Amita Sharma, AsthaPareek,Software Product Line Engineering:Paradigm for Product Family,
International Journal of Information and computation Technology,ISSN-0974-2239, volume 3,(2013),pp355- 360.
[4] FabriciaRooz-Frantz.A Preliminary Comparison of Formal Properties on Orthogonal Variability Model and
Feature Models.
[5] K.Pohl, G. Bockle and FJ. VnaderLinde. Software Product Line Engineering‟ Foundation, Principles and Techniues, Springer,DE,2005.
[6] FabricaRoos-Frantz, Sergio Seguria, Automated Analysis of Orthogonal Variability Models, A first step.
[7] EbrahimBagheri, DraganGasevic. Assessing the maintainability of Software Product Line feature Models using
Structural Metrics, National Research Council Canada, pp1-30.
[8] M. Genero, J, OLiva. M. Piattini& F. Romero, “ Using Metrics to predict OO information system maintainability”, in Advance Information System Engineering, springer,2001,pp-388-401.
[9] M. Manso, M. Genero& M. Piattini, “ No redundant metrics for UML class diagram structural complexity”, in
Advance Information System Engineering, Springer,2010. Pp 1029-1029.
[10] L. Briand, J Daly & D. Victor Porter, “Exploring the relationship between design measure and software quality in object oriented systems; Journal of Systems and Software, vol.51, no.3, 2000,pp-245-273.