HIV-Positive Individuals’ Motivations for Enrolling in Curative Trials
By Ben Murray
A Master’s Paper submitted to the faculty of the University of North Carolina at Chapel Hill
in partial fulfillment of the requirements for the degree of Master of Public Health in
the Public Health Leadership Program
Table of Contents
Abstract i – ii Manuscript 1 – 16 Appendix A: Systematic Review 17 – 28 Appendix B: Expanded Methods 29 – 34 Appendix C: Expanded Results 35 – 41 Appendix D: Expanded Discussion 42 – 43
Abstract
Objectives
The advent of highly active anti-retroviral therapy (HAART) has turned Human Immunodeficiency Virus (HIV) infection into a chronic illness for those with access to
medications. Despite having a predicted length of life comparable to age-matched healthy adults, many HIV-positive people are eager to be involved in curative trials. It is important for
researchers to understand the motivations of these individuals when deciding to enroll participants into potentially dangerous studies. We present the results of a survey of HIV-positive patients at two Boston hospitals to help inform future cure research.
Methods
Participants (n = 200) were age 23–74 (M = 51.9; SD 10.4), 76% of whom were mean. All had been HIV-infected for at least 6 months, on anti-HIV therapy with stable CD4 counts, and able to read English or Spanish. The survey was distributed to a convenient sample of HIV-positive people after routine physician visits at Massachusetts General Hospital and Brigham and
Women’s Hospitals from June 2015 to February 2016. Participants were approached sequentially until the desired number of completed surveys was obtained. The survey consisted of 42
Results
The median time since diagnosis was 19 years [interquartile range (IQR) = 13, 24 years], with the median time on HAART of 15 years [IQR = 9, 20 years]. Seventy-three percent (142 of 195) stated that they would likely take a 1 in 100 chance of death in a trial, while 26% (51 of 196) stated they would likely take a 99 in 100 chance of death. Sixty-five percent (118 of 182)
expected their health to be better in five years if they were cured of HIV compared to continuing their medications. Forty-one percent (75 of 182) estimated a 50% or greater risk that the virus would stop responding to their medications. Fifty-four percent (98 of 182) of respondents estimated a 50% or greater risk of experiencing serious side effects in the next 20 years due to their medications. Seventy-nine percent (154 of 196) of respondents reported some degree of stigma.
Conclusions
A substantial portion of the HIV-positive people we surveyed were willing to take a significant risk of death in pursuit of a cure. A majority felt that a cure would improve upon their current health state in the short-term, and reduce their risk of negative health outcomes over the next two decades. Uncertainty existed among our study participants as to how long their current treatment regimens will remain tolerable and effective. Most participants reported experiencing
Why Risk Death for a Cure? A Survey of HIV Patients Introduction
With the development of highly active anti-retroviral therapy (HAART) in the mid-1990s, Human Immunodeficiency Virus (HIV) infection has become a chronic disease for those with access to treatment. It is now widely assumedin the medical and research communities that individuals with HIV, on proper therapy, will have near normal quality of life and life
expectancies.1 Despite this fact, there remains significant demand among HIV-positive people on stable therapy for a cure. A global survey of individuals with HIV found that 95% were
interested in cure studies, with 59% willing to take “substantial risks”.2 Similar enthusiasm has been seen in America, and a recent survey found a majority of respondents desired to participate in a wide range of cure studies.3
At present, phase II/III HIV cure research studies are uncommon, but there are reasons to believe that many more are on the horizon. It is probable that many of these trials will entail a great deal of risk on behalf of the study participants, whether due to ingestion of a toxic
medication or merely discontinuation of anti-retroviral therapy.4 This risk raises ethical concerns regarding enrollment of HIV patients, given that the expectation from the medical community is that they would attain marginal benefit to their health and quality of life. A great question of interest is what do people on stable HAART hope to gain from enrolling in potentially dangerous curative trials?
for how their lives would change were they to be cured of HIV, and their willingness to enroll in clinical trials. This survey is meant as a pilot study to inform the hypotheses of future research.
Methods
This study consisted of a cross-sectional survey of 200 people on stable anti-retroviral therapy at two hospitals in Boston, MA: Massachusetts General and Brigham and Women's. Participants were age 18 or older, HIV-infected for at least 6 months, on anti-HIV therapy with stable CD4 counts, and able to read English or Spanish. Clinical staff approached consecutive eligible patients from June 2015 to February 2016. Those who completed the survey were given a $10 gift card for their time.
The survey was distributed on paper and consisted of 42 questions, ranging from basic demographic information to hypothetical cure scenarios. Key topics addressed included a self-assesment of health status, stigmatization, household finances, willingness to take risk, and the meaning of a cure. Question designs were mixed methods, including a 0-100 scale, a 5-point Likert scale, and several free-response questions.
The current utility scores for participants were measured using two metrics. The first was a 0 to 100 scale that asked for respondents to mark their current health status. The second, known as the EuroQol five dimension questionnaire (EQ-5D), is a standardized instrument for
measuring generic health status. The five questions concern mobility, self-care, performing usual activities, pain/discomfort, and anxiety/depression. For each question, one of five responses can be given: “no problem,” “slight problem,” “moderate problem,” “severe problem,” and
To assess participants’ desire to enroll in risky clinical trials, each was presented with the question: “If there was a 1 in 100 chance you would die by taking this HIV treatment, and a 99 in 100 chance you would survive and be cured of HIV, would you take this treatment?” The next question flipped these numbers: “If there was a 99 in 100 chance you would die by taking this HIV treatment, and a 1 in 100 chance you would survive and be cured of HIV, would you take this treatment?” The final question on risk taking asked: “If asked to take a treatment that
included a chance of causing death, what is the largest chance of death (0-100) you would accept in order to be cured of HIV?” An individuals’ stated “largest chance of death” score was
compared to the previous two questions to gauge the internal validity of responses. Statistical analyses were conducted on the quantitative data to assess for correlations between various self-reported factors and participants’ willingness to take risk in clinical trials.
At the end of the survey, participants were presented with two free response questions: “What would an HIV cure mean to you?” and “How would your life be different (and what would be the same) now and in the future if you were cured of HIV?”. Two members of the research team read each free response answer and categorized responses based upon general theme. These designations aligned 91% of the time, and a third person resolved the few differences that arose.
Results
Respondent Characteristics
a whole in the US, where 76% are men.16 The median length of time since HIV diagnosis was 19 years (IQR = 13, 24), and the median length of time on anti-retroviral medications was 15 years (IQR = 9, 20). More than half (57.8%) of participants had at least some college education. The two utility scores were quite similar, with current health averaging 77.6 (SD = 16.7) and EQ-5D averaging 0.79 (SD = 0.2).
Willingness to take risk
Participants reported a high willingness to risk death in order to enroll in potentially curative trials. For the question, “would you take a 1 in 100 risk of death”, 73% (142 of 195) of respondents answered that they “definitely” or “probably” would enroll in this trial, while only 16% (32 of 195) stated they “probably” or “definitely” would not. To the question, “would you take a 99 in 100 risk of death”, only 26% (51 of 196) of respondents said they definitely or probably would, while 63% (123 of 196) answered they probably or definitely would not.
Of the 200 people to finish the survey, 179 (90%) answered the question on “largest chance of death (0-100) you would accept in a cure trial.” There was a wide distribution of responses, with a high percentage reporting significant willingness to take risk [Figure 1].
While 18% (32 of 179) said that they would not take any risk of death in pursuit of a cure, more than a quarter (26%) said they would accept a greater than 50% chance of death. Thirteen individuals stated that they would take a 100% chance of death in pursuit of a cure, and 25 people stated that they would take a 50% chance of death.
questions. For example, 3 of the 13 people to report a “largest change of death” score of 100 also stated they “definitely” would not take a 99 out to 100 risk in the prior question.
Expectation of health improvement
Most people believe a cure will improve their health status [Figure 2], which may contribute to their motivation to participate in a curative trial. The average current health score for our population was 77.6 (SD = 16.7), and this remained essentially unchanged when
respondents predicted their health status five years from now if they continued their medications (M = 77.7, SD = 17.3). When asked to estimate their health status five years from now if they were cured, the score average rose to 89.1 (SD = 12.0).
Ten percent (20 of 198) of respondents said their health was “100” currently, and 32% (59 of 185) said it would be “100” in five years if cured. Sixty-five percent (118 of 182) of respondents expected their health to be better in five years if they were cured of HIV compared to continuing their medications. Among this group, 83% (98 of 118) thought their health would be better in five years than it is currently. While 32% (58 of 182) did expect their health to be the same in five years whether or not they were cured of HIV, only 8% (15 of 184) expected their health to be worse in five years if they were to be cured today.
This expectation of improved health status is partially explained by participant
of death over the next 20 years would be reduced. A much lower percentage of participants (20%) expected their chance of injury to change if they were cured of HIV.
Concerns over medications
Many of the people we surveyed perceive a significant 20-year risk of their medications failing or causing serious side effects [Figure 3]. The median estimated probability that the virus would stop responding to medications was 30% (IQR = 10, 50), while the median estimated probability that participants would experience serious side effects from medications was 50% (IQR = 15, 70).
Forty-one percent (75 of 182) of respondents estimated a 50% or greater risk that the virus would stop responding to their medications. Twenty-three percent (41 of 182) gave a less than 10% chance of the virus would no longer respond to their medications in five years. Fifty-four percent (98 of 182) of respondents estimated a 50% or greater risk of experiencing serious side effects in the next 20 years due to their medications. Fifteen percent (27 of 182) gave a less than 10% chance of experiencing serious side effects.
The answers to these two questions had a correlation coefficient of 0.6, indicating that many of the same people had concerns about their medications over the long-term.
Stigma
Written comments
Of the 200 people who completed the survey, 161 responded to one or both of the free response questions regarding the meaning of a cure. Several prominent themes emerged from those answers [Table 3].
The most commonly cited, burden of medications (36%), refers to both the concern that the medications are having harmful effects on the body (e.g. loss of bone density) as well as the need to take one or more pills every day.
Twenty-seven percent wrote that a cure would have a positive effect on their
relationships. This broad category encompasses both feelings of stigmatization from society and challenges of intimacy related to HIV. These issues are closely related, as many people feel their romantic and social lives are limited due to the stigma that accompanies being HIV-positive. Also included in this category were worries of sexual transmission and the ways in which infection necessitates changes in behavior.
Nearly one-quarter of respondents emphasized that a cure would directly improve their health status in the long-term. Again, this finding is consistent with the earlier data regarding expected health improvement with a cure.
Discussion
Previous studies have shown that there is substantial stated enthusiasm for involvement in risky curative trials by HIV-positive people.2,3 Our survey was designed to gain further insight into the reasons why people on stable antiretroviral therapy would choose to participant in such research.
A clear finding from our study was that a substantial portion of respondents say they are willing to take a significant risk of death in pursuit of an HIV cure. The reason for this desire to participate in risky trials appears to be tied to perceptions that a cure would improve an
individual’s current health state. A majority of participants in our study believe their present health problems could be at least modestly reversed with a cure. This finding suggests that people with HIV attribute much of their current and future health status to the infection and/or their anti-retroviral medications. This belief seems to come, in part, from the idea that the 20-year risk of heart attack and cancer would be reduced substantially by being cured of HIV. An important question for researchers becomes how realistic are these expectations, and do they align with our current understanding of HIV’s health effects? If the medical field believes that a cure is unlikely to improve upon an individual’s current health state, then it would be important to convey this to HIV-positive individuals before enrolling them in curative trials.
Another finding of the survey was that significant uncertainty exists among our study participants as to how long their current treatment regimens will remain tolerable and effective. Often it was the same people who were concerned about serious side effects as well as the virus no longer responding to their medications over the long run. These worries may cause
for physicians and researchers to assess the validity of these concerns and to address them prior to enrolling people in trials.
Not all of the survey data focused on health related motivations for enrollment, and the vast majority of respondents stated that they experience at least some degree of stigmatization. While it has been speculated that overt stigmatization would be reduced now that HIV is treated like a chronic disease,17 it evidently remains prevalent in the lives of those that we surveyed.
The free-response section proved to be important for illuminating motivations for clinical trial enrollment that the pre-defined survey questions either did not address directly or with adequate depth. One of the primary takeaways from these comments was that many factors aside from current and future health status may motivate someone to enroll in a clinical trial.
Consistent with the 5-point scale responses, social stigma was frequently reported in the free response section as well, and many participants wrote that it negatively influenced their
relationships with family members and sexual partners. One of the most frequently cited changes a cure would provide was relief from the physical and psychological burden of taking anti-retroviral medications. This is a consideration that may be underappreciated by clinicians and researchers.
The use of the 0 to 100 “largest chance of death” scale proved to be one of the main limitations of our study. Two answers in particular arose repeatedly that made interpretation of the results challenging. The first was that 25 people stated that they would take a 50% chance of death. Evidence from other studies has shown that “50” is equivalent to “I do not know,” and is a fundamentally different response from either 45 or 55.18 The second issue that arose was that 13 individuals stated they would take a 100% chance of death in pursuit of a cure. This could mean either that these people are willing to sacrifice themselves for the sake of finding a cure, are suicidal, or they did not understand the meaning of their answer. We cannot rightly know which it is, but when we compared these answers to the other risk questions (e.g. “99 in 100”) we found 23% (3 of 13) gave conflicting responses. This points to the maximum risk score as being a difficult concept for many people, and therefore an imperfect measure of willingness to take risk.
The difficulty participants in our study had with the “willingness to take risk” measure raises concern for consent processes that utilize numbers or probabilities of events occurring. Alternative means of informing participants of associated risks may be to give more specific information as to the potential harms (e.g. CD4 count dropping below 250 or detectable viral load for >6 months).2 Another solution may be to provide more descriptive terminology to accompany the numerical estimates, such as 10% risk of harm as “slight” and 50% risk of harm as “extreme”.
Another limitation of this study was that we asked participants their willingness to take risk in hypothetical studies, which is fundamentally different than enrolling people in an actual trial.19 In addition, we used a convenience sample, and our results would likely be more
Future research should include detailed assessment of what a “100” out of 100 “largest chance of death” means to respondents. It will also be important to collect comorbidity data, as this may help to explain why QOL and EQ-5D statistics were lower than expected. Finally, our survey did not collect information on the race of participants, an important point when
considering perceptions of stigmatization and trust in researchers.
Conclusion
Our study found that many HIV-positive people on stable anti-retroviral therapy say they are willing to incur substantial risk to be involved in cure research. This enthusiasm appears to be motivated by expectations of improved health, reductions in the chance of negative health outcomes, and concerns about the safety and efficacy of anti-retroviral medications over multiple decades. Other factors such as perceptions of stigmatization, the burden of daily medications, and the psychological toll of the infection are important considerations as well.
References
1. Nakagawa F, Lodwick RK, Smith CJ, et al. (2012). Projected life expectancy of people with HIV according to timing of diagnosis. AIDS. 26: 335–43.
2. Simmons, R, Kall, M, Collins, S, et. al. (2016) A global survey of HIV
positive people's attitudes towards cure research. HIV Med. [Epub ahead of print]. 3. Dubé K, Taylor J, Evans D, et al. Emerging Results of an Extensive Survey of Potential
Participants’ Willingness to Participate in HIV Cure Research in the United States. 7th International Workshop on HIV Persistence during Therapy. Miami, FL, 2015. 4. https://clinicaltrials.gov/ct2/results?term=hiv+cure&cond="HIV+Infections"
5. DeFreitas, D. (2010). Race and HIV clinical trial participation. J Natl Med Assoc, 102(6), 493–499.
6. Dong, Y., Shen, X., Guo, R., Liu, B., Zhu, L., Wang, J., … Xu, J. (2014). Willingness to participate in HIV therapeutic vaccine trials among HIV-infected patients on ART in China. PLoS ONE, 9(11).
7. Ethier, K. A., Rodriguez, M. R., Fox-Tierney, R. A., Martin, C., Friedland, G., & Ickovics, J. R. (1999). Recruitment in AIDS clinical trials: Investigation of sociodemographic and psychosocial factors affecting participation in clinical research. AIDS and Behavior, 3(3), 219–230.
8. Garber, M., Hanusa, B. H., Switzer, G. E., Mellors, J., & Arnold, R. M. (2007). HIV-infected African Americans are willing to participate in HIV treatment trials. Journal of General Internal Medicine, 22(1), 17–42.
9. Gwadz, M. V, Leonard, N. R., Nakagawa, A, et. al. (2006). Gender Differences in
Attitudes toward AIDS Clinical Trials among Urban HIV-Infected Individuals from Racial and Ethnic Minority Backgrounds. AIDS Care, 18(7), 786–794.
10. Luzi, A. M., Gallo, P., Colucci, A., Marcotullio, S., Bellino, S., Longo, O., & Ensoli, B. (2011). Communication, recruitment and enrolment in the preventative and therapeutic phase I clinical trial against HIV/AIDS based on the recombinant HIV-1 Tat protein. AIDS Care, 23(8), 939–946.
11. Rivera-Goba, M. V., Dominguez, D. C., Stoll, P., Grady, C., Ramos, C., & Mican, J. M. (2011). Exploring Decision-Making of HIV-Infected Hispanics and African Americans Participating in Clinical Trials. Journal of the Association of Nurses in AIDS Care, 22(4), 295–306.
12. Rodrigues, R. J., Antony, J., Krishnamurthy, S., Shet, A., & de Costa, A. (2013). “What Do I Know? Should I Participate?” Considerations on Participation in HIV Related Research among HIV Infected Adults in Bangalore, South India. PLoS ONE, 8(2).
13. Wendler, D. (2008). Why Patients Continue to Participate in Clinical Research. Archives of Internal Medicine, 168(12), 1294–1300.
14. Shaw J. W., Johnson J. A., Coons S. J. (2005). U.S. valuation of the EQ-5D™ health states: development and testing of the D1 valuation model. Medical Care, 43(3), 203-20.
15. Calculating the U.S. Population-based EQ-5D™ Index Score. (2005). Agency for Healthcare Research and Quality, Rockville, MD.
http://www.ahrq.gov/rice/EQ5Dscore.htm. Accessed My 31, 2016. 16. CDC, 2006
18. Need citation
19. Halpern, S. D., Metzger, D. S., Berlin, J. A., Ubel, P. A. (2001). Who Will Enroll? Predicting Participation in a Phase II AIDS Vaccine Trial. Journal of Acquired Immune Deficiency Syndromes, 27: 281-288.
APPENDIX A: Systematic Review of the Literature
Adult HIV-Positive Patients’ Motivations for Participating in Therapeutic Clinical Trials Introduction
With the advent of highly active antiretroviral therapy (HAART) in the mid-1990s, the health outlook for tens of thousands of HIV-positive Americans changed dramatically. No longer is HIV a death sentence, but a chronic disease that when managed carefully only minimally reduces one’s life expectancy (Deeks, 2013). This improved prognosis has not, however, removed the immense burden many people with HIV must endure in their everyday lives. Whether it’s regular check-ups to monitor disease progression or the high levels of
stigmatization that persist, infection with HIV can cause harms well-beyond one’s physical health. Certainly there are many HIV-positive individuals who continue to hold out hope for a cure.
There are those in the research community who share this objective as well, and millions of dollars each year go toward finding a permanent solution to one of the world’s deadliest diseases (KFF, 2014). While no safe and scalable means of cure have yet been achieved, there is reason to believe that curative trials will be increasing in number in the next decade. One
participants be allowed to risk their lives if their motivations are to escape societal
stigmatization? Or what if they have a unrealistic expectations of how the disease will progress over their lifetime? The answers to these questions are fundamental to ethical research, but they are not the focus here. This appendix will review the published literature to establish what is currently known about what motivates individuals with HIV to enroll in clinical trials.
Dhalla and Poole looked at a related question in 2014 when they reviewed motivators for willingness to participate (WTP) in actual HIV vaccine trials. They discovered that the principle reasons for enrollment were based on a sense of altruism, while a large percentage of subjects also cited personal motivators (e.g. protection from infection) (Dhalla, 2014). The review presented here is fundamentally different, however, as the subjects we are concerned with have already acquired the virus and therefore have an inherent attachment to trial results. To my knowledge this is the first systematic review of its kind to focus on what motivates adult HIV-positive patients to enroll in therapeutic clinical trials. The purpose is to elucidate consistencies between the given motivations by subjects across multiple studies, beginning with the use of HAART in 1996. A secondary analysis will include investigating characteristics of individuals that are correlated with willingness to participate in clinical trials.
Methods
references that may have been missed with the given search strategy. The search was then
extended to clinicaltrials.gov to look for unpublished studies and results known as grey literature. To be eligible for inclusion, study
participants had to be HIV-positive adults (18+) directly questioned on their reasons for enrolling in either hypothetical or actual therapeutic clinical trials for HIV [Table 1]. Both quantitative and qualitative approaches were included, consisting of both defined lists of responses and open-ended
questions. Studies earlier than 1996 were not considered, given the change in the meaning of an HIV diagnosis at that time, and only English language studies were considered.
Studies were abstract screened by two reviewers (BM and MH) to exclude those clearly outside the purpose of this review. Articles that passed the initial screen were then appraised in their entirety, with particular attention given to whether the reported results addressed
motivations for participation. Several studies had respondents answer questions on motivations for participation among a longer list of questions, the results of those were included as well.
Studies deemed appropriate for inclusion were reviewed in detail using a standardized rubric for extracting the relevant components into a table (see Results). Data recorded included study population, primary purpose of study, methodology, means of measuring WTP, real vs. hypothetical trial, primary results, major theme(s), and risk of bias. To be included under primary results, the study had to have found a statistically significant (p<0.05) association between an answer and WTP (for quantitative studies) or have been one of the most frequent answers given (for qualitative studies). When available, the percentage of subjects that stated a particular reason
Table 1: Inclusion Criteria Adults (18+)
HIV positive
Therapeutic trial (real or hypothetical)
Measured motivations for participation
English Language
for enrolling in a study was included in parenthesis. If a clear theme emerged from an individual study it was included in the table as well.
The risk of bias present in each study was assessed using a 10 question approach
described by Korhonen et. al, an example of which can be found at the end of this section under “Qualitative Appraisal Scale” (Korhonen, 2012). Studies were rated as “good”, “fair”, or “poor”, and only those with at least a “fair” scoring were included in the synthesis of results. To receive a “good” rating, the study had to fulfil each of the 10 criteria, while a “fair” rating was between 7 and 9. Anything less than 7 was deemed to be of “poor” quality.
Results were summarized by compiling similar responses into standardized wording (e.g. “to further biomedical research”). The proportion of studies having found a particular motivation were then compared to assess the frequency of that response across the sample. While this can help to identify the most consistently given motivations in the literature, there is a risk of bias as not all studies asked the same questions in the same manner. As such, results will be presented both in aggregate and on their own to avoid obscuring any important findings. The secondary analysis of subject characteristics and WTP was collected to potentially enhance the primary results table, but due to stated inclusion criteria does not represent all the available literature on the topic.
Results
trials. The search of unpublished (grey) literature revealed one study that was eligible for inclusion, however the results had yet to be released (Menezes, 2016). Of those included in the review, there was considerable variability in the
predefined questions asked of participants among studies.
The risk of bias was determined to be “good” or “fair” for each of the
studies included in the qualitative synthesis using the criteria of Korhonen et. al. Seven studies were deemed “good” because they fulfilled all 10 of the criteria. Two received a “fair” mark for having at least 8 out of 10. None of the studies have fewer than 8 criteria fulfilled.
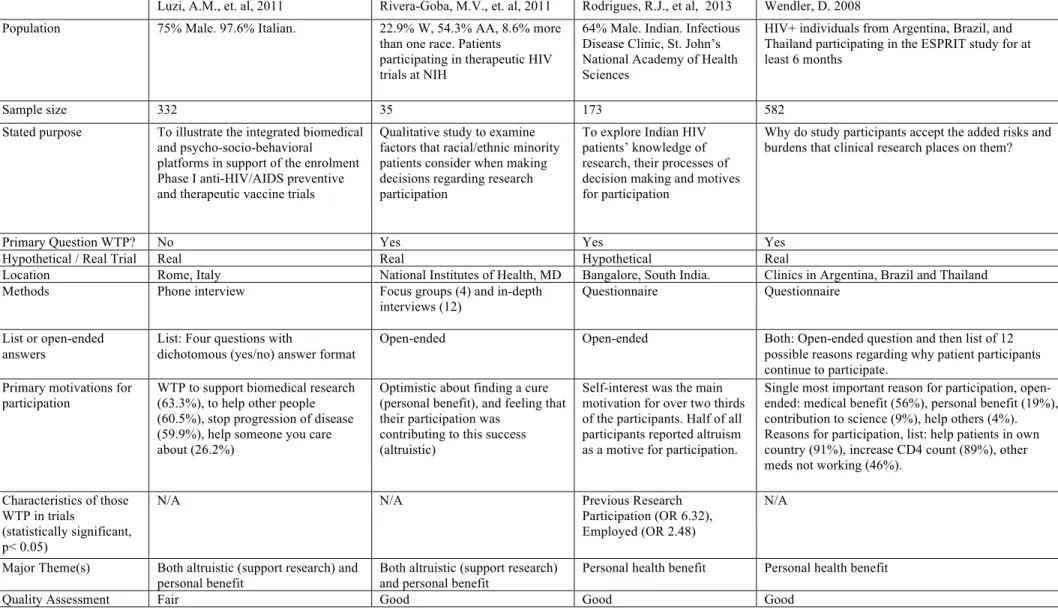
When viewing the results of the trials in aggregate, one clear theme that emerges is the expectation of participants to receive a health benefit from participation. This factor was listed as the primary motivation in 70% of the studies reviewed. Although not every study elicited a detailed meaning of “benefit,” the few that did considered it to be delayed progression of disease or improved access to health care. Another theme that emerged was the altruistic perception that one’s involvement in clinical trials could have benefits for biomedical research generally, or other HIV-positive patients specifically. These two themes, personal health benefit and altruism tied to furthering the development of therapies, were not mutually exclusive among trial
Table 2 Motivations for volunteering in HIV clinical trial
DeFreitas, D., et. al, 2010. Dong, Y., et. al, 2014. Ethier, K., et. al, 1999 Garber, M., et. al. 2007 Gwandz, M.V., et. al, 2006 Population 56% Caucasian, 19% other, 16%
African American, and 13% Hispanic
Hospitalized Chinese adults 61.5% W, 28.4% AA, 11%
Latino HIV-infected African-American 60% male. 55% AA, 34% Latino, 11% White/ Other
Sample size 145 175 213 200 286
Stated purpose Examine role race/ethnicity plays in HIV clinical trial enrollment
To investigate the WTP in HIV therapeutic vaccine trials among Chinese HIV-infected patients.
Identify factors that influenced recruitment in AIDS clinical trials
To determine actual participation rates and willingness to participate in future HIV treatment trials among HIV-infected African Americans
To examine gender differences in willingness to participate in ACTs among urban HIV-infected individuals
Primary Question WTP? No Yes Yes No Yes
Hypothetical / Real Trial Hypothetical Hypothetical Both Hypothetical Hypothetical
Location California, US Shanghai Public Hospital,
China Primary care clinic, New Haven, NC Pittsburgh AIDS Center for Treatment, PA New York City, NY
Methods Questionnaire Questionnaire Structured interviews Questionnaire Questionnaire
List or open-ended answers
List: 49-item survey, scored on Likert scale of 1 to 5
List: subjects willing to participate were able to select one to three out of the seven closed answer choices
Open-ended questions Single question with 8 possible answers. Participants allowed to check as many as desired or use open response box
List: different items used to assess health status, substance use, trust in scientists, barriers to participation, and altruism
Primary motivations for
participation Not well described in results, but African Americans showed a trend toward being more willing to do a trial for money
Delay/reduce ART side effects (76.6%), delay disease progression (74.9%), prevent opportunistic infections (57.7%), prevent drug resistance (37.1%), economic incentives (15.4%), reduce potential transmission (36.6%), support family (5.1%)
Potential for personal health benefits (61.1%), altruism: others will benefit (23.9%), improved health care (29.2%)
The reasons for
willingness to participate in future trials were to help find a cure for AIDS (86%), to help the HIV community (65%) and to obtain new and effective experimental HIV medication (47%)
For females, importance placed on altruism, and the importance placed on receiving free care as part of a trial. For males, importance placed on receiving free care in the trial.
Predictors of WTP in trials (statistically significant, p< 0.05)
Patients were more willing to enroll in a trial if they had been asked to be part of a trial in the past, were not depressed, took fewer doses of medication, and had been given a sense of understanding of trials
HIV diagnosis >5 years (OR 7.12), HIV-related infectious complications (OR 2.75), Sexual transmission (OR 2.75)
No differences in willingness to participate based on sex, race, risk factor, or history of injection drug use. Prior awareness of clinical trials influenced whether patients would participate in a trial.
The only significant factor related to willingness to participate in future research was prior research
participation (OR = 0.6).
Women in better physical health were less willing to enter ACTs, although health status did not predict willingness among men. Women with higher rates of substance use were more willing to join ACTs
Major Theme(s) Personal financial incentive Personal health benefit Personal health benefit Altruistic (help research) Personal health benefit
Table 2 Cont. Motivations for volunteering in HIV clinical trial
Luzi, A.M., et. al, 2011 Rivera-Goba, M.V., et. al, 2011 Rodrigues, R.J., et al, 2013 Wendler, D. 2008 Population 75% Male. 97.6% Italian. 22.9% W, 54.3% AA, 8.6% more
than one race. Patients
participating in therapeutic HIV trials at NIH
64% Male. Indian. Infectious Disease Clinic, St. John’s National Academy of Health Sciences
HIV+ individuals from Argentina, Brazil, and Thailand participating in the ESPRIT study for at least 6 months
Sample size 332 35 173 582
Stated purpose To illustrate the integrated biomedical and psycho-socio-behavioral platforms in support of the enrolment Phase I anti-HIV/AIDS preventive and therapeutic vaccine trials
Qualitative study to examine factors that racial/ethnic minority patients consider when making decisions regarding research participation
To explore Indian HIV patients’ knowledge of research, their processes of decision making and motives for participation
Why do study participants accept the added risks and burdens that clinical research places on them?
Primary Question WTP? No Yes Yes Yes
Hypothetical / Real Trial Real Real Hypothetical Real
Location Rome, Italy National Institutes of Health, MD Bangalore, South India. Clinics in Argentina, Brazil and Thailand
Methods Phone interview Focus groups (4) and in-depth
interviews (12)
Questionnaire Questionnaire
List or open-ended answers
List: Four questions with
dichotomous (yes/no) answer format
Open-ended Open-ended Both: Open-ended question and then list of 12
possible reasons regarding why patient participants continue to participate.
Primary motivations for
participation WTP to support biomedical research (63.3%), to help other people (60.5%), stop progression of disease (59.9%), help someone you care about (26.2%)
Optimistic about finding a cure (personal benefit), and feeling that their participation was
contributing to this success (altruistic)
Self-interest was the main motivation for over two thirds of the participants. Half of all participants reported altruism as a motive for participation.
Single most important reason for participation, open-ended: medical benefit (56%), personal benefit (19%), contribution to science (9%), help others (4%). Reasons for participation, list: help patients in own country (91%), increase CD4 count (89%), other meds not working (46%).
Characteristics of those WTP in trials
(statistically significant, p< 0.05)
N/A N/A Previous Research
Participation (OR 6.32), Employed (OR 2.48)
N/A
Major Theme(s) Both altruistic (support research) and
personal benefit Both altruistic (support research) and personal benefit Personal health benefit Personal health benefit
In our secondary analysis we looked for characteristics of patients (e.g. demographics) to
see if there were any statistically significant associations between these variables and willingness
to participate in clinical research. While results were generally mixed between studies, a
common theme that emerged was that participants who had previously been involved in clinical
trials were more likely to enroll in the future. In general, it also appears that participants in better
health were less likely to enroll in therapeutic trial, but we hesitate to draw any conclusions from
such a small number of studies reporting this predictor as significant.
Discussion
When reviewing the available literature on HIV-positive individuals’ motivations to
enroll in clinical trials, the theme that emerges most frequently is the belief that study
participants will personally benefit from involvement. This is certainly rational from the
perspective of those entering the trial, but as a substantial benefit from trial participation is
infrequently seen, there may be unrealistic expectations attached to enrollment. It is imperative
that researchers make clear the likelihood of personal benefit during the consenting process.
The second motivation that was recognized is that of altruism – the belief that
involvement in the study will have benefit to other HIV patients or the advancement of
biomedical science. Such an outcome is the most likely of a successful research trial, and this
review suggests that it should be the primary incentive offered during enrollment. It is both an
ethically appropriate incentive–because there is less risk of misleading participating that they
will see personal health benefit–and focusing on altruism should not have a detrimental effect on
enrollment numbers, as it is already a frequent motivation for many HIV-positive individuals’ to
There are several limitations to this review. First, several large databases (e.g.
ScienceDirect) were not searched for content, and prominent figures in the field were not
consulted on papers that may not be easy to retrieve through traditional search strategies. Second,
the studies included in this review, though all focused on motivations for enrollment, were quite
varied in their methodology. There was a great deal of inconsistency between studies as to the
type of answers participants were able to give, and large themes (e.g. “personal benefit”) were
too general for a more nuanced assessment.
This review adds to the current literature on motivations for patients to enroll in clinical
trials by focusing on a population (HIV-positive patients) that had not received sufficient
consideration up to this point. There remains research to be done to elicit more specific reasons
for enrollment. In particular, many of the trials reviewed here were hypothetical in nature, and
there may be important differences between those who actually enroll in research and those who
just state their intentions. Future reviews could focus more heavily on the secondary questions
asked here, and expand the inclusion criteria to allow for more papers that address patient
characteristics and WTP.
Conflicts of Interest None.
References – Appendix A
Deeks, S., Lewin, S., Havlir D. V. (2013). The end of AIDS: HIV infection as a chronic disease. The Lancet, 382, 1525-33.
DeFreitas, D. (2010). Race and HIV clinical trial participation. J Natl Med Assoc, 102(6), 493– 499. Retrieved from http://www.ncbi.nlm.nih.gov/pubmed/20575215
Dong, Y., Shen, X., Guo, R., Liu, B., Zhu, L., Wang, J., … Xu, J. (2014). Willingness to participate in HIV therapeutic vaccine trials among HIV-infected patients on ART in China. PLoS ONE, 9(11). Retrieved from
http://www.embase.com/search/results?subaction=viewrecord&from=export&id=L600434 457
Ethier, K. A., Rodriguez, M. R., Fox-Tierney, R. A., Martin, C., Friedland, G., & Ickovics, J. R. (1999). Recruitment in AIDS clinical trials: Investigation of sociodemographic and
psychosocial factors affecting participation in clinical research. AIDS and Behavior, 3(3), 219–230. http://doi.org/10.1023/A:1025456527845
Kaiser Family Foundation. (2014). Fact Sheet: The HIV/AIDS Epidemic in the United States. Korhonen, A., Hakulinen-Viitanen, T., Jylha ̈, V., Holopainen, A. (2012). Meta-synthesis and
evidence-based health care – a method for systematic review. Scand J Caring Sci, 27, 1027–1034. doi: 10.1111/scs.12003.
Garber, M., Hanusa, B. H., Switzer, G. E., Mellors, J., & Arnold, R. M. (2007). HIV-infected African Americans are willing to participate in HIV treatment trials. Journal of General Internal Medicine, 22(1), 17–42. http://doi.org/10.1007/s11606-007-0121-8
Gwadz, M. V, Leonard, N. R., Nakagawa, a, Cylar, K., Finkelstein, M., Herzog, N., … Mildvan, D. (2006). Gender Differences in Attitudes toward AIDS Clinical Trials among Urban HIV-Infected Individuals from Racial and Ethnic Minority Backgrounds. AIDS Care, 18(7), 786–794. http://doi.org/http://dx.doi.org/10.1080/09540120500428952
Luzi, A. M., Gallo, P., Colucci, A., Marcotullio, S., Bellino, S., Longo, O., & Ensoli, B. (2011). Communication, recruitment and enrollment in the preventative and therapeutic phase I clinical trial against HIV/AIDS based on the recombinant HIV-1 Tat protein. AIDS Care, 23(8), 939–946. http://doi.org/10.1080/09540121.2010.542124
Menezes, Prema. (2016). Determining the Barriers and Motivations to Clinical Trial Participation. University of North Carolina, Chapel Hill. (Results unpublished). https://clinicaltrials.gov/ct2/show/NCT01937091
Rivera-Goba, M. V., Dominguez, D. C., Stoll, P., Grady, C., Ramos, C., & Mican, J. M. (2011). Exploring Decision-Making of HIV-Infected Hispanics and African Americans
Participating in Clinical Trials. Journal of the Association of Nurses in AIDS Care, 22(4), 295–306. http://doi.org/10.1016/j.jana.2010.10.007
Rodrigues, R. J., Antony, J., Krishnamurthy, S., Shet, A., & de Costa, A. (2013). “What Do I Know? Should I Participate?” Considerations on Participation in HIV Related Research among HIV Infected Adults in Bangalore, South India. PLoS ONE, 8(2).
http://doi.org/10.1371/journal.pone.0053054
Walters, M.C. (2015). Update of hematopoietic cell transplantation for sickle cell disease. Current Opinion in Hematology, 22(3), 227-233.
Full Search Terms
Full search details for PUBMED:
"HIV" AND ("participate"[All Fields] OR "motivators" [All Fields]) AND ("research" [All Fields] OR "trials" [All Fields] OR "trial" [All Fields]) AND ("humans"[MeSH Terms] AND "adult"[MeSH Terms])
APPENDIX B: Methods
As this paper has laid out, the survey data brought to light a number of notable factors
related to HIV-positive people’s perceptions of a cure. This was best presented in a descriptive
manner, and only a short portion of the “Results” section mentions the more rigorous statistical
analyses that were undertaken. This section explains in detail the steps that were taken to look
for associations between the dependent and independent variables in our sample.
Independent variables
From the survey data, we were able to isolate 14 dependent variables for analysis. This
included: sex, age, educational attainment, years with HIV, years on HIV medications, general
health, EQ-5D index score, expectation of medication failure in next 20 years, expectation of
side effects from medications in next 20 years, amount of perceived stigma, household financial
situation, employment status, expected change in health in five years with cure, and subjective
numeracy score. The multivariable analyses that were run ultimately excluded “expectation of
medication failure in 20 years” due to its high correlation with “expectation of side effects from
medication in 20 years.”
The EuroQol five dimension questionnaire (EQ-5D) is a standardized instrument for
measuring generic health status. The five questions concern mobility, self-care, performing usual
activities, pain/discomfort, and anxiety/depression. For each question, one of five responses can
be given: “no problem,” “slight problem,” “moderate problem,” “severe problem,” and “unable”
(Shaw, 2005). The scores form each these questions are then combined into a single index score
The subjective numeracy scale (SNS) is a self-reported measure of one’s perceived
aptitude for mathematics, as well as one’s preference for receiving information, numerical or
otherwise (Fagerlin, 2007). It has been validated as a reasonably good predictor of a person’s
actual mathematical ability (Zikmund-Fisher, 2007). The scale consists of eight questions, with
the first four asking about competency with fractions, percentages, calculating a tip, and
calculating retail discounts. For each, respondents can answer using a 6-point Likert-type scale
ranging from “Not at all good” to “Extremely good.” Questions 5 through 8 ask how respondents
prefer to view information: tables or graphs (“Not at all helpful” to “Extremely helpful”),
percentages or prose (“Always prefer words” to “Always prefer percentages”), and general
usefulness of numerical information (“Never” to “Very often”). These responses can then be
coded and combined into a single score ranging from 0 (lowest) to 6 (highest).
Using the 0-100 scale questions on current health and expected health in five years with a
cure, we were able to develop a new variable known as “expected change in health in five years
with cure.” This was simply calculated by subtracting expected health in five years with a cure
from their expected health in five years were they to continue their medications.
Dependent variables
The challenges of working with the dependent variables in this data set were explained in
the “Discussion” section of the paper, but bear repeating here. Our outcome variables assessed
participant’s willingness to take risk in a clinical trial. This measure came from the question: “If
asked to take a treatment that included a chance of causing death, what is the largest chance of
death (0-100) you would accept in order to be cured of HIV?” This proved to be a difficult
significant number of respondents gave an answer of “50” [Appendix C]. This matters because
“50” is an answer frequently given when respondents mean “I do not know.” Therefore, we
cannot view the step from 40 to 45 the same as 45 to 50. This leads to challenges in running
regressions on the data set without accounting for the “50’s”. The second point concerns the
respondents that gave an answer of “100”. Much like “50”, without a follow-up question, it is not
possible to know what exactly this answer means. It could indicate a willingness to take any risk
for altruistic purposes, that the respondent is suicidal, or that the person answering does not have
a complete understanding of probabilities.
The other outcome measures we used were based on two hypothetical scenarios that
utilized the traditional 5-point Likert scale. The first asked participants: “If there was a 1 in 100
chance you would die by taking this HIV treatment, and a 99 in 100 chance you would survive
and be cured of HIV, would you take this treatment?”. Respondents were given a pictograph
[Appendix F] that was meant to help them conceptualize one person out of 100. The follow-up
question flipped the numbers around and asked about much greater risk: “If there was a 99 in
100 chance you would die by taking this HIV treatment, and a 1 in 100 chance you would
survive and be cured of HIV, would you take this treatment?” It was expected that these
questions would be reasonably straightforward, and were asked prior to the “maximum risk of
death” question to help frame the concept. The result, however, was that a large proportion of
respondents gave answers that were not internally consistent. This means that their response to
the “1 in 100” and/or the “99 in 100” contradicted their answer to “maximum risk of death.” This
presents issues with how best to analyze the data–namely whether to include inconsistent
respondents or not–and was addressed by running analyses with a variety of approaches (see
Approach to statistical analyses
The overall approach to analyzing the survey data was to go searching for correlations
rather than to test out any particular hypotheses. This was because the survey is meant as the first
step in a long line of research projects, and these results are intended to inform future research
rather than confirm theories about HIV-positive people’s motivations.
Part A
The initial analyses that were run considered the “1 in 100” chance of death variable as
the outcome. This variable was made dichotomous, with those that answered “Definitely Yes” or
“Probably No” considered willing to accept at least some risk, while those that answered
“Definitely No” or “Probably No” viewed as accepting no risk. This necessarily excludes
respondents that stated “Don’t Know,” but this was deemed appropriate as they represented only
a small portion of total participants. Multivariate logistic regression was run with inclusion of
each of the independent variables listed above. Analyses were conducted with and without basic
demographic information (e.g. age, education, etc.) to see the effect of their inclusion.
Part B
We next turned our attention to the “maximum acceptable risk of death” variable. Given
the issues outlined previously with this scale, several approaches were taken to balance the
competing objectives of grouping data in a meaningful manner and avoiding exclusion of a
significant portion of the data set. It was determined early on that simple linear regression of all
do not know.” In addition, we were skeptical that a score of “70” was fundamentally different
from a “90”, as both represented a willingness to take substantial risk.
The first method of accounting for all these factors was to place the “maximum risk of
death” scores into three categories. Respondents that would accept no risk (0), those that would
accept a minimal amount of risk (>0–10), and those would accept a substantial amount of risk
(11-99). These categories were established after lengthy deliberation, and neatly divide the data
into three approximately equal in size groups. Thus divided, it was possible to run multivariate
ordinal regressions with all of the dependent variables included. A follow-up analysis was run
using these same categories but removing the “50”s, given the unclear meaning in this response.
Part C
Continuing with the “maximum risk” outcome variable, we next separated those that
would take any risk (>0) from those that would take no risk (0). This allowed us to run
multivariate logistic regression of the now dichotomous outcome. Next, the “0”s were excluded
from consideration and the “any risk” group was run as a continuous variable in multivariable
linear regression. Each of these analyses were run with and without demographics and inclusion
of “50”s and “100”s was varied.
Part D
In an effort to isolate respondents that seemed to understand the “maximum risk”
question from those that did not, we considered the internal consistency of respondents. This was
assessed by comparing answers to the “1 in 100” and the “99 in 100” questions to their answers
ran the same sequence of regressions listed above (linear, logistic, and ordinal, as appropriate).
The inconsistent respondents were then evaluated in a similar manner.
Part E
The final set of analyses considered the respondents based upon their subjective
numeracy score (SNS). Survey participants were divided into tertiles and evaluated separately.
Once again, the sequence of regressions listed previously (linear, logistic, and ordinal) were run
to see if any dependent variables would correlate better or worse depending on stated numerical
ability.
References – Appendix B
Calculating the U.S. Population-based EQ-5D™ Index Score. (2005). Agency for Healthcare Research and Quality, Rockville, MD. http://www.ahrq.gov/rice/EQ5Dscore.htm. Accessed May 31, 2016.
Fagerlin, A., Zikmund-Fisher, B.J., Ubel, P.A., Jankovic, A., Derry, H, Smith, D.M. (2007). Measuring Numeracy without a Math Test: Development of the Subjective Numeracy Scale. Medical Decision Making, 27: 672-680.
Shaw JW, Johnson JA , Coons SJ. (2005). U.S. valuation of the EQ-5D™ health states: development and testing of the D1 valuation model. Medical Care, 43(3), 203-20.
APPENDIX C: Results Part A
When considering the “1 in 100 chance of death” response as a dichotomous outcome
(“definitely no” or “probably no” vs. “definitely yes” or “probably yes”) we are left with a
portion of respondents that do not fall into either category. Ten percent of respondents (21 of
195) said “I don’t know” to the question and were therefore excluded from the analysis.
Multivariable logistic regression did not show any significant correlations with the
independent variables in our model when demographics were excluded. The inclusion of basic
demographic information (age, educational attainment, employment status) showed two
variables to be correlated: subjective numeracy score [OR 1.68 (95% CI: 1.146, 2.449), p=0.008]
and employment status [OR 4.66 (95% CI: 1.658, 13.075), p=0.004].
* multivariable regression results, with demographics
Part B
With the “maximum risk of death” variable divided into three categories, it became
possible to run multivariate ordinal regressions with “0” as 0, “1” as >0 to 10, and “2” as 11 to
OR p =
General Health 0.70 (95% CI: 0.443, 1.112) 0.130 Side Effects 1.00 (95% CI: 0.986, 1.015) 0.958 Years with HIV 1.02 (95% CI: 0.939, 1.116) 0.595 Years on HIV Medications 0.94 (95% CI: 0.850, 1.033) 0.196
Stigma 1.03 (95% CI: 0.721, 1.455) 0.892
Finances 1.05 (95% CI: 0.676, 1.637) 0.821
Subjective Numeracy Scale 1.68 (95% CI: 1.146, 2.449) 0.008
Change in Health 1.02 (95% CI: 0.991, 1.059) 0.152 EQ-5D index 0.42 (95% CI: 0.028, 4.543) 0.512
Age 0.97 (95% CI: 0.926, 1.017) 0.209
Educational Attainment 1.30 (95% CI: 0.784, 1.763) 0.843
99. The “100”s were excluded and “50”s included in the first test but not the second. Regardless
of inclusion of demographics or “50”s, our analyses showed there were no variables that
correlated with the ordered “maximum risk” outcome.
* ordinal regression results, with demographics, excluding “50”s and “100”s
Part C
Running multivariate logistic regression of those that took any risk (“maximum risk” > 0)
compared to those that took no risk (“maximum risk” = 0) showed two statistically significant
odds ratios when the “50”s and “100”s were excluded from analyses: SNS [OR 1.51 (95% CI:
1.00, 2.29), p=0.050] and Finance [OR 0.546 (95% CI: 0.304, 0.980), p=0.043].
OR p =
General Health 0.82 (95% CI: 0.526, 1.276) 0.378 Side Effects 1.01 (95% CI: 0.991, 1.019) 0.457 Years with HIV 1.01 (95% CI: 0.935, 1.090) 0.805 Years on HIV Medications 0.99 (95% CI: 0.908, 1.086) 0.882
Stigma 1.08 (95% CI: 0.774, 1.498) 0.659
Finances 0.89 (95% CI: 0.587, 1.348) 0.580 Subjective Numeracy Scale 1.29 (95% CI: 0.919, 1.807) 0.142 Change in Health 1.02 (95% CI: 0.988, 1.054) 0.216 EQ-5D index 0.51 (95% CI: 0.034, 7.615) 0.622
Age 0.99 (95% CI: 0.955, 1.032) 0.727
Educational Attainment 0.98 (95% CI: 0.648, 1.495) 0.941 Employment Status 1.26 (95% CI: 0.501, 3.195) 0.619
OR p =
General Health 1.26 (95% CI: 0.722, 2.204) 0.415 Side Effects 1.00 (95% CI: 0.983, 1.019) 0.900 Years with HIV 1.02 (95% CI: 0.927, 1.116) 0.722 Years on HIV Medications 1.04 (95% CI: 0.932, 1.150) 0.512
Stigma 0.92 (95% CI: 0.603, 1.399) 0.692
Treating “any risk” as a continuous variable in multivariable linear regression, and excluding the
“0”s, “50”s and “100”s gave a single significant correlation: [Finance: 11.79 (95% CI: 4.118,
19.469), p=0.003].
Part D
This section focused on respondents’ internal consistency between their answers to the “1
in 100” and “99 in 100” questions and their “maximum risk of death” score. A total of 27
respondents lacked internal consistency between their “maximum risk” score and “1 in 100”
answer. Meanwhile, 31 respondents lacked internal consistency between their “max risk” score
and “99 in 100” answer. Eight survey participants gave answers that were inconsistent on both “1
in 100” and “99 in 100” compared to their “maximum risk” score. This was achievable by giving
Subjective Numeracy Scale 1.51 (95% CI: 0.999, 2.291) 0.050
Change in Health 1.02 (95% CI: 0.982, 1.061) 0.297 EQ-5D index 0.37 (95% CI: 0.015, 9.369) 0.547
Age 0.95 (95% CI: 0.899, 1.007) 0.083
Educational Attainment 1.17 (95% CI: 0.680, 2.029) 0.563 Employment Status 0.83 (95% CI: 0.253, 2.694) 0.752
Coefficient p =
General Health -5.60 (95% CI: -13.338, 2.142) 0.153 Side Effects 0.11 (95% CI: -0.131, 0.352) 0.364 Years with HIV 0.292 (95% CI: -1.168, 1.751) 0.691 Years on HIV Medications -1.33 (95% CI: -3.058, 0.407) 0.131
Stigma 0.13 (95% CI: -5.755, 6.006) 0.966
Finances 11.79 (95% CI: 4.118, 19.469) 0.003
Subjective Numeracy Scale 0.26 (95% CI: -6.105, 6.620) 0.936 Change in Health -0.22 (95% CI: -0.751, 0.314) 0.415 EQ-5D index -6.69 (95% CI: -54.046, 40.669) 0.779
Age 0.61 (95% CI: -0.067, 1.292) 0.076
a “max risk” of “0” and also stating that one would take both the “1 in 100” and “99 in 100”
scenarios. Or, alternatively, giving a “max risk” of “100” and stating that one would not take
either “1 in 100” or “99 in 100” scenarios. In total, 50 respondents were identified as not being
internally consistent, and for the purposes of these analyses were separated from the other data.
The respondents that were not internally consistent were considered first. Similar
regressions to those in parts A–C were undertaken, with varied inclusion of demographics and
the “50”s and “100” maximum risk scores. Under no circumstances were any of the independent
variable found to correlate in a statistically significant manner with our outcome measures.
We next ran regressions on the 128 respondents that were deemed to be internally
consistent. Treating “1 in 100” as a dichotomous outcome and leaving in the “50s” and “100s”
gave similar findings to this method in Part A. Both SNS [OR 1.78 (95% CI: 1.095, 2.890),
p=0.020] and employment status [OR 3.83 (95% CI: 1.075, 13.635), p=0.038] were once again
statistically significant, while the others variables did not meet our p=0.05 threshold.
Making the outcome variable ordered categorical (0, >0 to 10, 11 to 99) as in part B, and
still focusing exclusively on internally consistent answers, leaves us with only 80 of 179 (46%)
OR p =
General Health 0.71 (95% CI: 0.407, 1.222) 0.214 Side Effects 1.00 (95% CI: 0.992, 1.035) 0.220 Years with HIV 1.06 (95% CI: 0.954, 1.181) 0.277 Years on HIV Medications 0.97 (95% CI: 0.824, 1.067) 0.327
Stigma 1.14 (95% CI: 0.756, 2.162) 0.524
Finances 1.27 (95% CI: 0.744, 2.162) 0.381
Subjective Numeracy Scale 1.78 (95% CI: 1.10, 2.891) 0.020
Change in Health 1.03 (95% CI: 0.991, 1.081) 0.121 EQ-5D index 0.53 (95% CI: 0.032, 9.032) 0.664
Age 0.97 (95% CI: 0.916, 1.018) 0.193
Educational Attainment 1.07 (95% CI: 0.606, 1.880) 0.822
of the initial respondents. With the inclusion of all independent variables there were three that
had statistically significant odds ratios: years on HIV medications [OR 0.860 (95% CI: 0.752,
0.983), p=0.027], change in health with a cure [OR 1.061 (95% CI: 1.009, 1.116), p=0.020], and
employment status [OR 3.97 (95% CI: 1.148, 13.730), p=0.029].
Continuing with this select group of participants, we repeated the process from part C and
treated “maximum risk” as a dichotomous outcome (0 = no risk, 1 = any risk). Once again,
removing the “50”s and “100”s leaves us with only 46% of our original sample. As in the
previous analysis, the same independent variables gave statistically significant odds ratios: years
on HIV medications [OR 0.682 (95% CI: 0.475, 0.980), p=0.039], change in health with a cure
[OR 1.11 (95% CI: 1.000, 1.241), p=0.049], and employment status [OR 10.50 (95% CI: 1.169,
94.437), p=0.036].
OR p =
General Health 0.57 (95% CI: 0.321, 1.008) 0.053 Side Effects 1.01 (95% CI: 0.990, 1.026) 0.394 Years with HIV 1.10 (95% CI: 0.993, 1.229) 0.067
Years on HIV Medications 0.86 (95% CI: 0.752, 0.983) 0.027
Stigma 1.09 (95% CI: 0.720, 1.653) 0.681
Finances 0.98 (95% CI: 0.579, 1.662) 0.944 Subjective Numeracy Scale 1.29 (95% CI: 0.822, 2.022) 0.268
Change in Health 1.06 (95% CI: 1.009, 1.116) 0.020
EQ-5D index 3.56 (95% CI: 0.128, 99.233) 0.455
Age 1.00 (95% CI: 0.953, 1.045) 0.944
Educational Attainment 0.98 (95% CI: 0.558, 1.727) 0.950
Employment Status 3.97 (95% CI: 1.148, 13.730) 0.029
OR p =
General Health 0.66 (95% CI: 0.249, 1.769) 0.413 Side Effects 1.01 (95% CI: 0.980, 1.038) 0.550 Years with HIV 1.37 (95% CI: 0.991, 1.894) 0.057
Years on HIV Medications 0.68 (95% CI: 0.475, 0.980) 0.039
Stigma 0.98 (95% CI: 0.499, 1.921) 0.951
The final analysis of the internally consistent respondents focused only on those that
agreed to accept some risk, and treated the “maximum risk” outcome variable as continuous.
This time the “0”s were excluded, along with the “50”s and “100”s, which left just 66 of 179
responses (37%) in consideration. Multivariable linear regression was conducted and revealed
only a single variable to correlate with our outcome measure in a statistically significant manner:
finances [OR 12.30 (95% CI: 3.381, 21.214), p=0.008].
Part E
Our final approach to the survey data was to divide it into tertiles by SNS. The lower
tertile contained 56 respondents, with SNS scores ranging from 1 to 3.375. The middle tertile had Subjective Numeracy Scale 1.28 (95% CI: 0.656, 2.488) 0.471
Change in Health 1.11 (95% CI: 1.001, 1.241) 0.049
EQ-5D index 2.68 (95% CI: 0.025, 290.963) 0.680
Age 0.92 (95% CI: 0.832, 1.011) 0.084
Educational Attainment 2.20 (95% CI: 0.795, 6.105) 0.129
Employment Status 10.50 (95% CI: 1.169, 94.437) 0.036
Coefficient p =
General Health -5.02 (95% CI: -13.609, 3.572) 0.247 Side Effects 0.047 (95% CI: -0.232, 0.327) 0.735 Years with HIV 0.40 (95% CI: -1.297, 2.089) 0.641 Years on HIV Medications -1.03 (95% CI: -3.180, 1.120) 0.341 Stigma -0.0050 (95% CI: -7.256, 7.246) 0.999
Finances 12.30 (95% CI: 3.381, 21.214) 0.008
Subjective Numeracy Scale -1.37 (95% CI: -8.701, 5.952) 0.708 Change in Health -0.014 (95% CI: -0.707, 0.680) 0.969 EQ-5D index -3.20 (95% CI: -58.127, 51.729) 0.907
Age 0.68 (95% CI: -0.059, 1.418) 0.071
58 respondents (scores ranging from 3.5 to 4.625). The upper tertile had 58 respondents (scores
ranging from 4.75 to 6).
Simple linear regression focusing on the highest tertile did not reveal any independent
variables that correlated with the “maximum risk” outcome measure. This did not change
whether or not the “50”s and “100”s were included or not. Similarly, simple linear regression of
the lowest tertile did not find any statistically significant correlations.
Consideration of only the middle SNS, however, found several independent variables to
be correlation with our outcome: general health [-14.88 (95% CI: -26.69, -3.067), p=0.015],
expectation of medication side effects in next 20 years [0.445 (95% CI: 0.0846, 0.806),
p=0.017], years since HIV diagnosis [2.872 (95% CI: 0.679, 5.065), p=0.012], years on HIV
medications [-4.434 (95% CI: -6.829, -2.039), p=0.001], expected change in health with a cure
[1.32 (95% CI: 0.262, 2.380), p=0.016], and employment status [25.43 (95% CI: 5.77, 45.08),
p=0.013].
Coefficient p =
General Health -14.88 (95% CI: -26.690, -3.067) 0.015
Side Effects 0.45 (95% CI: 0.0846, 0.806) 0.017
Years with HIV 2.87 (95% CI: 0.679, 5.065) 0.012
Years on HIV Medications -4.43 (95% CI: -6.829, -2.038) 0.001
Stigma -5.13 (95% CI: -2.483, 12.753) 0.179 Finances 7.092 (95% CI: -4.551, 18.734) 0.223 Subjective Numeracy Scale -2.65 (95% CI: -5.201, 4.941) 0.868
Change in Health 1.32 (95% CI: 0.263, 2.380) 0.016
EQ-5D index 23.77 (95% CI: -40.567, 88.099) 0.457
Age 0.46 (95% CI: -0.478, 1.398) 0.325
Educational Attainment 0.78 (95% CI: -8.810, 10.365) 0.870
APPENDIX D: Expanded Discussion
The statistical analyses conducted on our risk taking outcome measures did not provide
evidence of any clear associations. There had been speculation when crafting the survey that
factors such as perceived level of stigmatization or educational attainment would correlate with a
willingness to take risk. However, as described in Appendix C, it takes a great deal of
manipulation of the data to find any statistically significant correlations.
One method of stratifying the analyses that was expected to make a difference was
dividing respondents into tertiles by their subjective numeracy scores (SNS). The thought was
that those with higher SNS would be better at working with numbers and probabilities, and
would therefore be more likely to have correlating independent variables. On the other side, we
expected those with lower SNS to be less likely to have variables that correlated with their risk
scores due to a self-described dislike of numerical information. Neither of these predictions were
borne out, as no statistically significant correlations appeared for either the high or low
groupings. To our surprise, the middle SNS group had several variables that correlated in a
significant manner, for which we do not have a good explanation.
Ultimately, we believe these lack of associations is the result of a flawed outcome
measure in the “maximum risk of death” score. The measure is not particularly intuitive and it is
uncommon for people to think about risk taking in this manner. While a 0-100 scale is preferable
from the perspective of researchers analyzing the data, there may be superior methods of asking
individuals to assess their own propensity to take risk. One alternative would be to use a 5-point
scale, with categories that include: “no risk”, “little risk”, “moderate risk”, “extreme risk”, or “I
don’t know”. It would be important to include an “I don’t know” option to avoid the confusion