ISSN: 2501 - 1235 ISSN-L: 2501 - 1235 Available on-line at: www.oapub.org/edu
doi: 10.5281/zenodo.1341640 Volume 4 │ Issue 10 │ 2018
THE RELIABILITY OF THE 12-ITEM GRIT SCALE
AMONG CROSSFIT PARTICIPANTS
Michael Cazayoux1,
Alan Bishop2,
James Navalta3,
Chad Harris4,
Kent Adams5,
Mark DeBeliso1
1Department of Kinesiology and Outdoor Education,
Southern Utah University, Cedar City, UT, USA
2Athletics Department,
University of Houston, Houston, TX, USA
3Kinesiology and Nutrition Sciences,
University of Nevada Las Vegas, Las Vegas, NV, USA
4Metropolitan State University of Denver,
Denver, CO, USA
5Kinesiology Department, California State University,
Monterey Bay, Seaside, CA, USA
Abstract:
heteroscedasticity. The results of the 12-point Grit Scale and subscales ranged from moderately-high to excellent reliability among adult Crossfit participants.
Keywords: grit, Crossfit, perseverance, consistency, reliability
1. Introduction
Crossfit® was founded in 2000 and has become one of the most popular fitness regimens
across the planet (Rische, 2011). Crossfit is defined as “constantly varied functional
movements performed at high intensity” (What is Crossfit, 2018). Crossfit® has altered the
worldwide fitness industry having made general physical preparedness (GPP) and functional fitness the standard for people to achieve and maintain peak levels of fitness. Crossfit® introduced the sport of fitness in 2007 known as the “Crossfit Games”. The
initial Crossfit Games commenced with 70 athletes at a ranch in California (Finding The Fittest On Earth, 2018). Since the initial gathering of the Crossfit Games participation has grown at an exponential rate. More than 380,000 participants registered for the 2017 Crossfit Open (2017 Open Recap, 2018). Paralleling the rapid growth of participation in the sport is the cash prize payout, which grew from $25K in 2010 to $2.2 million in 2017 (CrossFit Games Prize Purse Grows, 2018).
The inclusivity of Crossfit has contributed to the growth in participation and cult-like community (Dawson, 2017). In a Crossfit class, it would be typical to see a cross-section of the general population (ex. mother of three, a firefighter, a nurse, an elite athlete) all working out alongside one another. Greg Glassman the Crossfit®
co-founder states: “The needs of Olympic athletes and our grandparents differ by degree, not
kind,” which is a foundational tenet of the Crossfit training philosophy (What is
Crossfit, 2018).
Crossfit targets development of a host of fitness domains (Figure 1) which include accuracy, agility, balance, coordination, cardiovascular-respiratory endurance, flexibility, power, speed, stamina, and strength (“What is Crossfit”, 2018). Participants who aspire to compete in the Crossfit Games must also develop competencies in weightlifting, gymnastics, and strongman.
While an athlete’s physical characteristics are of utmost importance, in order to compete in the Crossfit games, psychological traits likely play a critical role. Research by Gould et al. (2002) demonstrated that elite athletes have higher self-confidence, concentration, arousal control, motivation, and commitment. These same characteristics are likely to be important factors for achievement in the Crossfit Games. Likewise, Grit would appear to be an important construct as related to high achievement in Crossfit Games. Grit is a combination of persistence of effort (PE) and consistency of interest (Duckworth et al. 2007). If grit could be validly and reliably assessed among Crossfit participants, coaches and athletes could use that information to monitor the constructs of PE and CI in order to further develop Crossfit participation skills.
Tedesqui and Young (2017) provided evidence that PE was associated with
thoughts of quitting/switching out of sport” in a sample of adult athletes. Tedesqui and Young (2017) assessed grit with the 12-point Grit Scale that was developed by Duckworth et al. 2007. However, sufficient evidence of the test-retest reliability of the 12-point Grit Scale is lacking. Duckworth et al. 2009 reported a test-retest reliability coefficient of r=0.68 in a sample of middle/high school students using the 8-point Grit Scale. Various researchers have suggested that reporting a Pearson correlation coefficient (r) alone is not sufficient to describe the test-retest reliability of an instrument (Bland & Altman, 1986; Hopkins, 2013). Given the recent concerns regarding reproducibility of research (Open Science Collaboration, 2015) and the potential importance of grit to Crossfit participants, we felt it relevant to perform an in-depth examination of the test-retest reliability of the 12-point Grit Scale among Crossfit participants.
2. Methods
2.1 Participants
Potential novice/recreational participants were contacted at a local Crossfit training facility in Texas, USA regarding their interest in participating in the study. Advanced games level participants were contacted regarding participating in the study through personal connections with the lead investigator. Advanced games level participants lived in the US, Canada, and Australia. The participants (female and male) ranged in age from 18-65 years and experience levels of 6 months-10 years and provided informed consent to participate. The study was reviewed and approved by a University Institutional Review Board for the ethical use of humans in research.
2.2 Instrument
The 12-point Grit Scale was developed and validated by Duckworth et al. (2007) to assess grit and the associated sub constructs of PE and CI for “adolescents and adults pursuing goals in a variety of domains”. The 12-point Grit scale has 6 questions related to PE and CI. The CI and PE subscales are comprised of scores from questions (2,3,5,7,8,11) and (1,4,6,9,10,12) respectively. Subscale scores are based on a 1-5 Likert scale. Total of the points for the 12 questions are added together and divided by 12. A score of 5 is the maximum score (i.e. extremely gritty), while 1 is the lowest score (i.e. not at all gritty). However, the analysis in the current study did not divide the total scores by 12 in order to establish a more precise analysis of the reliability of the 12-point Grit Scale and associated subscales.
2.3 Procedures
second solicitation was sent regarding the second administration of the 12-point Grit Scale. Participants completed the second administration of the 12-point Grit Scale in a 1-3 week time frame. Subsequent to the completion of the second administration of the 12-point Grit Scale the data was arranged in an MS Excel spreadsheet for statistical analysis.
2.4 Statistical Analysis
Multiple statistical approaches were conducted to assess the test-retest reliability of the 12-point Grit Scale. The following procedures were carried out to compare the two sets of 12-point Grit Scale, PE and CI scores. A scatter plot was examined for the appearance of linearity; a Bland-Altman plot was constructed in order to examine error uniformity and limits of agreement (LOA). The interclass (r) and intraclass reliability coefficients (ICC), the mean difference between trials, and the standard error of measurement (SEm) were calculated as well as 90% upper and lower limits (UL, LL). Finally, the coefficient of variation percent (CV%, UL, LL) was also calculated to inspect the typical error from the log-transformed trial data. Statistical analysis was carried out in Microsoft Excel, with a spreadsheet prepared by Hopkins [2007].
3. Results
A total of 26 Crossfit participants responded to two electronic solicitations to complete the 12-point Grit Scale (two trials or test-retest). After reviewing the data we felt that one survey result was erroneously scored and as such the associated 12-point Grit Scale scores were discarded. Hence, the analysis of data was based on response from 25 Crossfit participants (female:11, male:14 ).
The mean and standard deviation for the 12-point Grit Scores and subscale scores are presented in Table 1. Neither the mean of 12-point Grit Scores nor subscale scores deviated by more than 0.5 of a point between trials.
Figure 2 is a scatter plot of the 12-point Grit Scale scores that suggests a strong linear relationship between the test-retest scores. Figure 3 is a Bland-Altman plot, comparing the average trial scores versus the difference in the scores as well as LOA. None of the data pairs exceeded the 95% LOA suggesting the 12-point Grit scale is reliable in the absence of bias or non-uniform error [Bland & Altman, 1986]. Further, no evidence of bias or non-uniform error was suggested by the scatter or the Bland-Altman plot.
4.Discussion
The purpose of this study was to examine the test-retest reliability of the 12-point Grit Scale and subscales of PE and CI among adult Crossfit participants. The various indices of reliability employed in this study suggest the 12-point Grit Scale and subscales of PE and CI ranged from moderate-high to excellent reliability.
Table 2, 3, and 4 shows the reliability statistics with 90% confidence limits (UL, LL) for the 12-point Grit Scale score, PE and CI. The ICC’s ranged from 0.76-0.91, which is considered as “good reliability” to “excellent reliability” *Koo & Li, 2016+. The interclass coefficients (r) ranged from 0.74-0.87 which is viewed as “moderate high” to “high” *Safrit & Wood, 1995+. The SEm ranged from 1.1-2.0 on the Grit scale (or 2.67-6.66 %). Data was Log-transformed as recommended by Hopkins [2013] in order to quantify typical error, noting that the 12-point Grit Scale, PE and CI scores did not suggest non-uniform error. The typical error (CV%) ranged from 3.4-11.6 percent.
Within the parameters of this study it is concluded that: the 12-point Grit Scale as well as the PE and CI subscales exhibit sufficient test-retest reliability such that Crossfit coaches and adult participants can monitor the constructs of PE and CI which may allow for the further development of Crossfit participation skills.
Conflict of Interest
No funding was received for this research. The authors have no conflict of interest related to this research.
References
1. 2017 Open Recap. (n.d.). Retrieved May 18, 2018, from
https://games.crossfit.com/video/2017-open-recap.
2. Bland, J.M., & Altman, D.G. (1986). Statistical methods for assessing agreement between two methods of clinical measurement. Lancet, 8, 307-310.
3. CrossFit Games Prize Purse Grows. (n.d.). Retrieved May 18, 2018, from
https://games.crossfit.com/article/crossfit-games-prize-purse-grows
4. Dawson, M.C. (2017). CrossFit: Fitness cult or re-inventive institution?
International review for the sociology of sport, 52(3), 361-379.
5. Duckworth, A.L., & Quinn, P. D. (2009). Development and validation of the Short Grit Scale (GRIT–S). Journal of Personality Assessment, 91(2), 166-174.
6. Duckworth, A.L., Peterson, C., Matthews, M.D., & Kelly, D.R. (2007). Grit: perseverance and passion for long-term goals. Journal of Personality and Social Psychology, 92(6), 1087.
7. Finding the Fittest on Earth. (n.d.). Retrieved May 18, 2018, from
8. Gould, D., Dieffenbach, K., & Moffett, A. (2002). Psychological characteristics and their development in Olympic champions. Journal of Applied Sport Psychology, 14(3), 172-204.
9. Hopkins, W.G. (2007). Understanding statistics by using spreadsheets to generate and analyze samples. Sportscience, 11, 23-36.
10.Hopkins, W.G. (2013). A new view of statistics. Internet Society for Sport Science,
http://www.sportsci.org/resource/stats/.
11.Koo, T.K., & Li, M.Y. (2016). A guideline of selecting and reporting intraclass correlation coefficients for reliability research. Journal of Chiropractic Medicine, 15(2), 155-163.
12.Open Science Collaboration, (2015). Estimating the reproducibility of psychological science. Science, 349(6251), aac4716.
13.Rische P. CrossFit's relationship with Reebok enhances its financial and commercial credibility; Forbes; 2011. Retrieved from
http://www.forbes.com/sites/sportsmoney/2011/07/22/CrossFits-relationship-with-reebok-enhances-its-financial-and-commercial-credibility/
14.Safrit, M.J., & Wood, T.M. (1995). Introduction to measurement in physical education and exercise (3rd Ed.). St. Louis, MO: Mosby.
15.Tedesqui, R. A., & Young, B. W. (2017). Associations between self-control, practice, and skill level in sport expertise development. Research Quarterly for Exercise and Sport, 88(1), 108-113.
16.What is CrossFit? (n.d.). Retrieved May 18, 2018, from
Appendix
Table 1: Grit Trial Scores
N Total Score 12-Item Grit Scale Grit Sub-scale Perseverance Effort Score Grit Sub-scale Consistency Interest Score
Trial 1 25 49.8±5.3 26.7±2.7 23.2±3.6
Trial 2 25 50.2±5.4 27.2±2.5 23.0±4.5
Note: 12-Item Grit and subscale scores (mean±SD). No significant difference between trials (p>0.05).
Table 2: 12-Item Grit Scale Reliability Statistics
Statistic Upper Limit Lower Limit
∆ Means (trials) -0.3±2.3 0.6 -1.2
r 0.87 0.94 0.73
ICC 0.91 0.96 0.83
Typical Error (CV%)* 3.4 4.8 2.7
SEm 1.6 2.2 1.3
Note: 90% Confidence limits for selected reliability statistics. *Typical error expressed as a CV% based on Log-transformed data. SEm- standard error of the measure. r- Pearson correlation coefficient. ICC- Intraclass correlation coefficient.
Table 3: Grit Sub-scale Perseverance Effort Reliability Statistics
Statistic Upper Limit Lower Limit
∆ Means (trials) 0.5±1.6 1.2 -0.1
r 0.78 0.90 0.56
ICC 0.83 0.91 0.66
Typical Error (CV%)* 4.3 6.0 3.4
SEm 1.1 1.5 0.9
Note: 90% Confidence limits for selected reliability statistics. *Typical error expressed as a CV% based on Log-transformed data. SEm- standard error of the measure. r- Pearson correlation coefficient. ICC- Intraclass correlation coefficient.
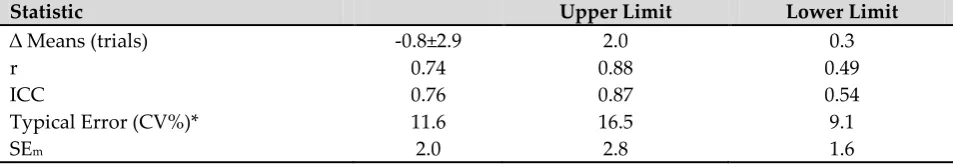
Table 4: Grit Sub-scale Consistency Interest Reliability Statistics
Statistic Upper Limit Lower Limit
∆ Means (trials) -0.8±2.9 2.0 0.3
r 0.74 0.88 0.49
ICC 0.76 0.87 0.54
Typical Error (CV%)* 11.6 16.5 9.1
SEm 2.0 2.8 1.6
Figure 1: Crossfit participants in action
Creative Commons licensing terms