Australian Journal of Basic and Applied Sciences
2020 February; 14(2): pages 13-18 DOI: 10.22587/ajbas.2020.14.2.2 Original paper AENSI Publications
Australian Journal of Basic and Applied Sciences ISSN: 1991-8178, EISSN: 2309-8414
Journal home page: www.ajbasweb.com
Productivity per area and world production of rice: An analysis of
its determinants using a simultaneous equation model
Everton Anger Cavalheiro1, Roberta Hoffmann Machado2, Regis Augusto Ely3
1Professor at Federal University of Pelotas, Engineering Center, Pelotas, Brazil 2Federal University of Pelotas, Engineering Center, Pelotas, Brazil
3Professor at Federal University of Pelotas, Department of Economics, Pelotas, Brazil
Correspondence Author: Everton Anger Cavalheiro, Federal University of Pelotas, Engineering Center. Street Benjamin Constant, number 989, City: Pelotas, Brazil.
E-mail:- [email protected]
Received date: 15 December 2019, Accepted date: 22 January 2020, Online date: 28 February 2020
Copyright: © 2019 Everton Anger Cavalheiro et al., This is an open-access article distributed under the terms of the Creative Commons Attribution License, which permits unrestricted use, distribution, and reproduction in any medium, provided the original author and source are credited.
Keywords: Rice; productivity; economic growth; simultaneous equation model
INTRODUCTION
Rice is one of the most important cereal crops and one of the major food in the world (Wang et al., 2010; Chou, Yen & Li, 2014). More than 50% of the world’s population depends on rice as their primary caloric source (Wu et al., 2010). Rice products are stapled foods, especially in Asian countries, where most of them are made from rice flour. Bishwajit et al. (2013) remind that rice provides around 60 to 70% of calories and 50 to 55% of protein intake for the South Asian population. Though this dependence on rice as a primary nutrition source is undesirable, it is also true that rice is still the most affordable way for these people to maintain sustainable calorie intake.
According to Bishwajit et al. (2013), food security is a multifaceted issue influenced by national and international policymaking, as well as social, economic, environmental and demographic variables. Rice is not only the staple crop of the world, but it is also a political crop. Large rice stocks are maintained by countries and remain untraded until market prices rise abnormally high, and consequently, food scarcity remains a common scenario across many poor areas.
On the other hand, agriculture is the mainstay of many economies, especially in South Asia, where the ratio of rice land to arable land is high in the subcontinent, there remains an opportunity to expand domestic rice production by creating employment and income-generating opportunities in the face of ever-increasing demand for rice. Moreover, Virmani, Mao & Hardy (2003) quotes that hybrid rice technology was successfully developed in China from 1964 to 75. Since then, it has been used on 50% of
Abstract
the rice area in China. This technology is being developed in around 20 countries worldwide, and about 800,000ha are now covered with hybrid rice in Vietnam, India, the Philippines, Bangladesh, Indonesia, Myanmar, and the United States.
The implementation of such technologies enables farmers to produce more rice per area in less time and contributes significantly to improving food security. Furthermore, when self-sufficiency is achieved, it creates scope for surplus production, allowing rural people to profit and overcome the poverty line. As an example, Vietnam reemerged in 1989 as a rice exporter after two decades of being a net importer of rice. This change to an exporter status can be attributed in part to the decollectivization policies that were pursued since 1981. The switch to the contract system of production had a significant effect on rice productivity (Pingali & Xuan, 1992). On the other hand, much of the rapidly-growing demand for rice in West Africa will be met from production in inland valley swamps, which are abundant and relatively robust concerning cropping intensification, mainly with low-cost interventions such as the building of field bunds, e.g. (Becker & Johnson, 2001).
The importance of rice production in the world raises questions such as i) How the increase in productivity per area may affect the world production of rice? ii) What are the main determinants of an increase in productivity per area? iii) What is the relative importance of technology, human capital and physical capital on productivity? In this paper, we seek to answer these questions through a simultaneous equation model with data from 1961 to 2013, obtained from the Food and Agriculture Organization of the United Nations (FAOSTAT).
We find that productivity per area can significantly increase the world production of rice, which is highly dependent on physical capital, human capital, and technology, supporting traditional theories of economic growth. Specifically, variables such as school life expectancy in rural zones and capital accumulation for the acquisition of new equipment and production technologies seem to be the main determinants of productivity. But what evidence corroborates this? This way, in order to access its determinants and validate this theory, this study is presented.
EMPIRICAL METHOD
In order to evaluate the impact of the productivity per area in the world production of rice and to access its determinants, we need a proper identification strategy, which involves some statistical methods as estimating a regression model with endogeno us variables. The endogeneity comes from the classical problem of simultaneity, addressed in Imbens (2014). To solve the endogeneity problem and interpret our coefficients as causal effects, we use a simultaneous equation model. In these types of models, there is a two-way, or simultaneous, relationship between our outcome variable and some of the explanatory variables, which makes some of the endogenous. In such models, there is more than one equation - one for each of the mutually, or jointly, dependent or endogenous variables, as well as a number of predetermined exogenous variables.
The predetermined variables are divided into two categories: exogenous, current as well as lagged, and lagged endogenously, such that the model in the current time does not determine their values.
To analysis the influence of productivity per area into the world production of rice, we first used the Hausman Specification Test, which can be used for testing the simultaneity problem. When there is simultaneity, OLS estimators are not consistent , and the methods of two-stage least squares (2SLS) and instrumental variables (IV) will give estimators that are consistent and efficient. We use the following equations in order to estimate the relationships between productivity per area and the world production of rice:
(1)
(2)
(3)
, (4)
where is the world production of rice in time t; is the world productivity per area in t; is the international price of
rice per ton in t-1 is the gross capital stock per area in the world in t-1; is the total primary energy consumption per area
in the world; is the years of school life expectancy in rural zone in t; is the fertilizers used by area in the world,
measured in tons; is the US cost of production per ton in t-1; and is the consumption of rice per capita in t-1. The coefficients are , , , and , while , , and are stochastic disturbances in t.
Equation 1 measures the influence of productivity per area in the world production of rice through the coefficient , while equation 2 measures the importance of some of the determinants of productivity, which is the quantity of goods and services produced from each unit of labour input. In this paper, we used the quantity of rice produced in each planted area in the world. Classical growth models usually state that productivity is determined by physical capital, human capital, natural resources, and technology (Solow, 1956; Cass, 1965; Koopmans, 1965).
supply reacts to price with a lag of one time period because supply decisions take the time to implement (the gestation period). Thus, at the beginning of this year’s planting of crops, farmers are influenced by the price prevailing last year. Equation 4 includes the lagged international price of rice per ton in order to access the phenomenon.
RESULTS AND DISCUSSION
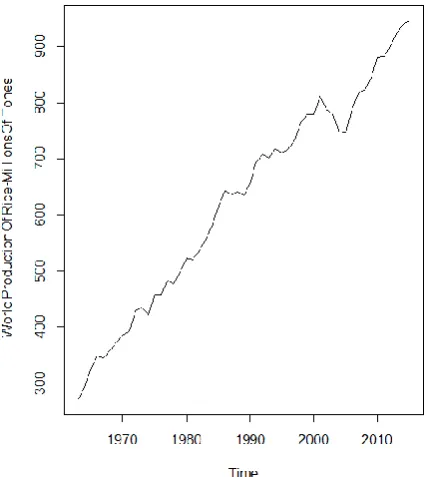
We used data from the Food and Agriculture Organization of the United Nations, FAOSTAT (2016). Figure 1 shows the world production of rice in a million tons between 1961-2013. The world production of rice increased 248.38% between 1961 to 2013 (from 271.57 to 946.11 million tons).
Fig.1 World Production of Rice in a million tons between 1961-2013. Source: FAOSTAT (2016)
Figure 2 shows the world productivity per area and the total planted area between 1961 and 2013. Production of rice was increased 42.78% between 1961 and 2013 (49.36 millions of tons). On the other hand, the productivity per area increased 143.99% (from 2.35 tons per area in 1961 to 5.74 tons per area in 2013).
To verify the causes of the growth of rice production, we split the variation of production by the variation on productivity per area and the variation on the quantity of area, using the following relations:
(5)
(6)
, (7)
Where ∆P is the variation of the total production in a year,
PPA
is the variation of productivity per area and QA is the variation of the quantity of area. Table 1 shows the variation of rice production in the world shared by productivity per area and number of the planted area, by decade, in 1961-2013.Table 1: Variation of rice production in World shared by productivity per area and number planted area, by decade, in 1961-2013
Decade Production per area Planted area ∆ productivity ∆ per quantity
per area of area
(T ha-1 y-2) (ha) (,000-T) % (,000-T) %
1960 2.78 124,806,383 77,390.03 64% 43,518.29 36%
1970 3.40 138,775,447 94,252.98 74% 33,074.63 26%
1980 4.32 144,363,935 141,299.38 81% 33,507.86 19%
1990 4.97 149,578,897 76,051.01 65% 40,682.73 35%
2000 5.28 153,848,974 63,441.12 88% 8,816.78 12%
2010 5.70 162,777,025 25,268.55 40% 37,231.26 60%
Total 477,703.07 71% 196,831.55 29%
Source: own data organization
The results show that the planted area increased by 30% (162,777,025 ha) between 1961 and 2013. This growth resulted in an increase of 196.83 million tons of rice for this period (sum of variation per area for this period). The production per area also increased by 105% between 1961 and 2013. This growth was responsible for 477.70 million tons of rice and represented 71% of the total variation in this period. According to FAOSTAT (2016), few countries produce a large percentage of total production rice in the world. In this sense, in 2013, China produces 21.69% of the rice in the world, India produces 16.83%, Indonesia 7.53%, Bangladesh 5.44%, and Viet Nam 4.65%. In 2013, these five countries produced 531.23 million tons and represented 56.15% of the total production of rice in the world.
Table 2 shows the production of rice from the five most essential countries between 1961 and 2013: China, India, Indonesia, Bangladesh and Viet Nam. The planted area of these five countries increased by 31% (25,670,723 ha) between 1961 and 2013. This growth leads to an increase of 69.49 million tons of rice in this period. The table also shows that the production per area increased by 57% during this period. This growth was responsible for 316.52 million tons of rice.
Table 2: Variation of rice production in China, India, Indonesia, Bangladesh and Viet Nam shared by productivity per area and number planted area, by decade, in 1961-2013
Decade Production per area Planted area ∆ PA ∆ INA
(T ha-1 y-2) (million of ha) (millions of tons)
CN IN ID BD VN All CN IN ID BD VN All
1960 2.90 1.51 1.89 1.69 1.91 2.69 30.10 36.12 7.44 9.35 4.80 87.82 36.14 22.12
1970 3.40 1.75 2.67 1.79 2.11 3.18 35.62 38.75 8.45 9.92 5.11 97.85 46.26 17.33
1980 4.32 2.23 3.89 2.19 2.70 3.19 33.31 40.78 9.73 10.34 5.70 99.86 106.37 9.86
1990 4.97 2.78 4.34 2.76 3.66 4.13 31.86 43.27 11.17 10.21 6.86 103.37 54.87 13.41
2000 5.28 3.09 4.63 3.79 4.80 4.26 29.10 43.49 11.95 10.78 7.42 102.74 44.10 11.84
2010 5.70 3.59 5.07 4.38 5.52 4.22 30.33 43.19 13.44 11.56 7.71 106.23 28.77 18.61
Total 316.52 69.49
∆PA= variation per productivity per area; ∆INA= variation per increased of new area; 1=China; 2=India; 3= Indonesia; 4= Bangladesh; 5= Viet Nam; All= all these countries. Source: own data organization
Although China increased only 0.23 million ha in the area during this period, productivity increased by 97%, which was responsible for 148.76 million tons of rice production. This was almost the contribution of production per quantity of area from all other countries in the same period (196.8 millions of tons of rice, as showed in Table 1).
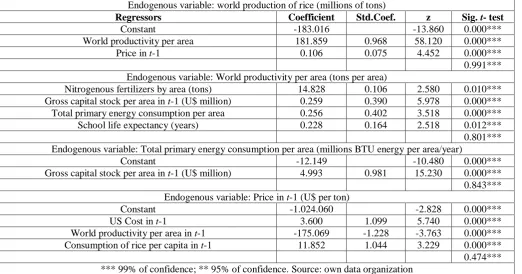
Table 3 shows the results of our simultaneous-equation model using Two-Stage Least Squares (2SLS) for the sub-sample from 1970 to 2013. We have not used data prior to 1970 since we only had information on school life expectancy from 1970 through 2013. The Doornik-Hansen test (8.567 and sig 0.380) for the residuals do not reject the null hypothesis of normality and the Breusch-Pagan test (11.748 and sig 0.068) do not reject the null hypothesis of homoscedasticity.
Table 3: Results of simultaneous equation model using Two-Stage Least Squares (2SLS) and the sub-sample from 1970 to 2013 Endogenous variable: world production of rice (millions of tons)
Regressors Coefficient Std.Coef. z Sig. t- test
Constant -183.016 -13.860 0.000***
World productivity per area 181.859 0.968 58.120 0.000***
Price in t-1 0.106 0.075 4.452 0.000***
0.991*** Endogenous variable: World productivity per area (tons per area)
Nitrogenous fertilizers by area (tons) 14.828 0.106 2.580 0.010***
Gross capital stock per area in t-1 (U$ million) 0.259 0.390 5.978 0.000***
Total primary energy consumption per area 0.256 0.402 3.518 0.000***
School life expectancy (years) 0.228 0.164 2.518 0.012***
0.801*** Endogenous variable: Total primary energy consumption per area (millions BTU energy per area/year)
Constant -12.149 -10.480 0.000***
Gross capital stock per area in t-1 (U$ million) 4.993 0.981 15.230 0.000***
0.843*** Endogenous variable: Price in t-1 (U$ per ton)
Constant -1.024.060 -2.828 0.000***
US Cost in t-1 3.600 1.099 5.740 0.000***
World productivity per area in t-1 -175.069 -1.228 -3.763 0.000***
Consumption of rice per capita in t-1 11.852 1.044 3.229 0.000***
0.474*** *** 99% of confidence; ** 95% of confidence. Source: own data organization
The first equation has two continuous variables (world productivity per area and price of rice in t-1). Productivity per area has a high standardized coefficient (0.961) with a positive relation regarding the world production of rice. One ton increase in productivity per area is responsible for 181.69 million tons increase in the expected world production of rice. Productivity is also highly dependent on physical capital (gross capital stock per area in t-1), human capital (school life expectancy in years) and technology (use of machinery measured by total primary energy consumption per area ), with standardized coefficients of 0.390, 0.164 and 0.402, respectively.
The third equation in Table 3 shows the contribution of the capital stock in the intensive use of technology. The results show that two variables are essentials to the increase of productivity: investment in education in the rural zone and investment in gross capital stock for acquisition of new equipment and new production technologies.
The last equation shows that when productivity increases one ton per area, the price decreases U$ 175.07 per ton. In contrast, when the consumption per capita increases 1 kg/year, the price increase U$ 11.85 per ton. The actions of buyers and sellers naturally move markets toward the equilibrium of supply and demand. When the price of one or more of these inputs rise, producers will transfer these costs to the buyers. In this equation, we use the US cost of production per ton as a proxy of international cost of production.
FINAL CONSIDERATIONS
We have measured the influence of productivity per area in world production of rice and analyzed the determinants of productivity during the period of 1961 to 2013. Since 1961, the world production of rice increased 477.70 million of tons by variation of productivity (2.78 to 5.70 tons per area), highly influenced by the variation of productivity of China (2.90 to 6.69 tons per area), responsible for 21.69% of the world production in 2013. While China increased their rice production area by only 12.72%, their productivity increased 97% in this period, which was responsible for 148.76 million of tons of rice production.
REFERENCES
Becker, M., & Johnson, D. E. (2001). Improved water control and crop management effects on lowland rice productivity in West Africa. Nutrient Cycling in Agroecosystems, 59(2), 119-127.
Bishwajit, G., Sarker, S., Kpoghomou, M. A., Gao, H., Jun, L., Yin, D., & Ghosh, S. (2013). Self-sufficiency in rice and food security: a South Asian perspective. Agriculture & Food Security, 2(1), 1.
Cass, D. (1965). Optimum growth in an aggregative model of capital accumulation. Review of Economic Studies. 32:233-240. Chou, C., Yen, T., & Li, C. (2014). Effects of different cooking methods and particle size on resistant starch content and degree of
gelatinization of a high amylose rice cultivar in Taiwan. Journal of Food, Agriculture and Environment, 12(2), 6-10.
FAOSTAT. (2016). Website: http://faostat3.fao.org/faostatgateway/go/to/search/cow-milk/E (accessed 26 may 2016)
FAOSTAT. (2016a). Website: http://faostat3.fao.org/download/O/OA/E (accessed 26 may 2016) FAOSTAT. (2016b). Website: http://faostat3.fao.org/browse/I/CS/E (accessed 26 may 2016)
Imbens, G. W. (2014). Instrumental variables: an econometrician’s perspective. Statistical Science. 29:323-358.
Koopmans, T. C. (1965). On the concept of optimal economic growth. The Economic Approach to Development Planning. Chicago: Rand McNally, 225-287.
Pashigian, B. P. (2008). Cobweb Theorem. The New Palgrave Dictionary of Economics, 2ª ed.
Pingali, P. L., & Xuan, V. T. (1992). Vietnam: Decollectivization and rice productivity growth. Economic development and cultural change, 40(4), 697-718.
Solow, R. M. (1956). A contribution to the theory of economic growth. The Quarterly Journal of Economics. 70:65-94.
Virmani, S. S., Mao, C. X., & Hardy, B. (Eds.). (2003). Hybrid rice for food security, poverty alleviation, and environmental protection. Int. Rice Res. Inst..
Wang, L., Xie, B., Shi, J., Xue, S., Deng, Q., Wei, Y. and Tian, B. 2010. Physicochemical properties and structure of starches from Chinese rice cultivars. Food Hydrocoll. 24:208-216.
Wu, Y., Chen, Z., Li, X. and Wang, Z. (2010). Retrogradation properties of high amylose rice flour and rice starch by physica l