DETERMINATION OF HEAVY METAL CONTENTS IN WATER
OF LLAPI RIVER (KOSOVO). A CASE STUDY OF
CORRELATIONS COEFFICIENTS
Fatbardh Gashi,
[a]Elida Dreshaj,
*[a]Naser Troni,
[b]Albert Maxhuni
[b]and Fisnik
Laha
[c]Keywords: Water; heavy metals; atomic absorption spectroscopy; correlation coefficients; Llapi river.
Atomic absorption spectroscopy has been used to analyses and assesses the heavy metal content in water of the Llapi river, Kosovo. In this study, the assessment of heavy metals in water was realized in the summer period. Statistical studies have been carried out by calculating basic statistical parameters, anomalies (extremes and outliers) and correlation coefficients between different pairs of variables. The concentration of Cr, Ni, Zn, Cu and Fe in all sample stations were found to be under WHO recommended norms. But the concentration of Cd and Pb in all sample stations and concentrations of Mn at several stations were found to be above WHO recommended norms originated from mineral sources (ores) in this area. The statistical regression analysis has been found a highly significant positive relationship of Cd with Ni, Mn, Fe and Pb originated mainly of sulphide ores in this area.
*Corresponding Authors
E-Mail: [email protected]
[a] The College of Medical Sciences "Rezonanca", 10000 Prishtina, Kosovo
[b] Department of Chemistry, Faculty of Mathematics and Natural Sciences, University of Prishtina "Hasan Prishtina" Kosovo
[c] UBT - Higher Education Institution, Prishtina, Kosovo
INTRODUCTION
The quality of water is an issue of significant interest for the residents of the EU.1 In peat bogs, water flows freely in the active layer of water or acrotelm. Water storage is critical to the balance of water in peat swamps and in surrounding areas. Logging activity, agriculture, peat extraction and destruction of peat swamp drainage activity also have an adverse effect and has an unfavorable implication on the hydrology.2
The sources of physico-chemical contamination are numerous and include the land disposal of sewage effluents, sludge and solid waste, septic tank effluent, urban runoff and agricultural, mining and industrial practices.3,4 Chemical contamination of drinking water is often considered a lower priority than microbial contamination by regulators because adverse health effects from chemical impurities are generally associated with long-term exposures. In contrast, the results from microbial contamination are usually immediate practices.5 The decomposition of organic matter and pollution due to anthropogenic activity are the primary sources of pollution of water.6 As reported by Brils,7 adequate water quality in Europe is one of the most critical concerns for the future.
Proper management of natural and environmental waters will give results if leading institutions continuously monitor information about the ecological situation. Therefore, seeing it as a challenge for environmental chemists, our goal is to determine the amount and nature of pollutants in the environment. One could claim that the most polluted areas
in the world are those with the densest population. It should, therefore, be the foremost goal of environmentalists to prevent such pollution, and to educate the community towards proper management of ecosystems.8 Heavy metal ions can exist in several different forms.9 The factors which determine the form of the metal ion are the extent of complexation and the oxidation state. In many samples, metal ions are present in their hydrated forms. Hydrated metal ions are usually written without the water ligands included in the chemical formula.
Determination of the concentrations of trace heavy
elements in aqua systems is difficult and the results obtained
often vary according to the chosen analytical technique. Atomic absorption spectroscopy (AAS) is a frequently used instrumental technique for the determination of trace heavy metal ions because of its low cost and short analysis time.10
Study area and sampling
The Llap is a river in the north-eastern part of Kosovo and the 82.7 km long right tributary to the Sitnica river,16 which runs through the middle of Podujevo. The source of Llapi river is considered to be the Pollata village in the Albanik Mt., where the rivers of Murgulla and Sllatina are joined. This river is wide from 9 to 12 meters and deep up to 1.2 meters. The river brings an average of 4.9 m3 s-1, however, there are considerable variations with the maximum going up to 25 m3 s-1. The Llapi river originates from Albaniku Mountain in the Prishtina region. Near the village of Stanovci i Poshtëm, the Llapi river splits and empties into the Sitnica river. The sampling process of river water was performed on August 12, 2015, to cover the river spatially, taking into account anthropogenic pressures, the different habitats, and the hydro morphological conditions of the river.
Figure 1. Study area with sampling stations.
At each sampling location, water samples were collected in polyethylene bottles. Before taking water samples, the bottles were rinsed three times with the river's water to be collected. Water samples were collected for analysis according to the recommended procedures, near the river bank at a depth of 15 cm, put into 1dm3 bottles stored at 4° C. 17,18
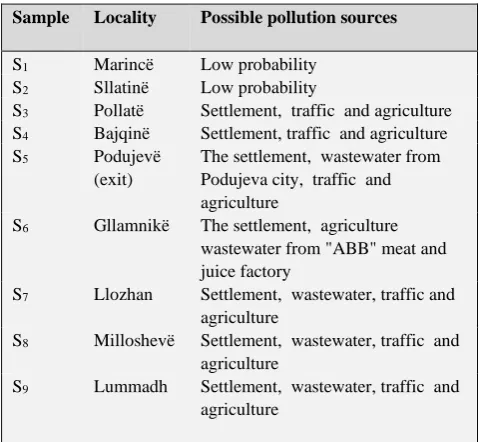
Table 1. Sampling stations (summer period) with a detailed description
Preservation and experimental procedure for the water samples are carried out according to the standard methods for the examination of water Samples are preserved in refrigerator after treatment.19-21 GPS device Extras measured geographic coordinates, "GARMIN, 12 channel," and locations were well described. The levels of heavy metals in water were compared with WHO standards for drinking water.22 The study area with the sampling locations is shown in Figure 1 and the details about all sampling sites were presented in Table 1.
MATERIALS AND METHODS
Twice distilled water was used in all experiments. All instruments are calibrated according to the manufacturer's recommendations. All tests were performed at least three times to calculate the average value. Determination of the concentrations of trace heavy metals: Cr, Cd, Ni, Zn, Mn, Cu, Fe and Pb in environmental samples is difficult and the results obtained often vary according to the chosen analytical technique. Atomic absorption spectroscopy (AAS) is an important instrumental technique for the determination of trace/heavy metal ions because of its low cost and short analysis time. Determination of Zn (213.89 nm), Fe (371.99 nm), Mn (403.08 nm), Ni (341.48 nm), Cr (425.44 nm), Cu (327.40 nm), Cd (326.11 nm) and Pb (405.78 nm) were performed using atomic absorption spectrometer model “PERKIN ELMER 400 ANALYST”.
The detection limit for analyzed heavy metals is presented in Table 2. Program statistic 6.023 was used for the statistical calculations in this work, such as descriptive statistics, Pearson’s correlation factor and two-dimensional box plot diagrams for determination of anomalies (extremes and outliers) for solution data. Relationships between the observed variables were tested using correlation analysis, and the level of significance was set at p < 0.05 for all statistical analyses.
RESULTS AND DISCUSSION
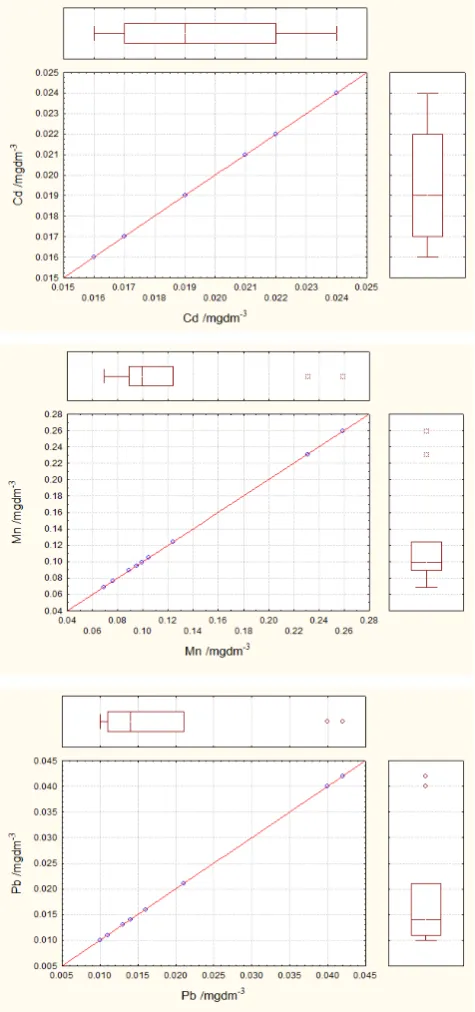
The concentration of 8 heavy metals was presented in Table 2 and basic statistical parameters for 6 variables in 9 water samples are shown in Table 3. Using experimental data and box plot approach of Tukey,24 extreme and outlier values were determined for the whole region. Two dimensional scatter box with plots diagrams are presented in Figure 2. Anomalous values (outliers and extremes) of 6 variables are shown in Table 4. The matrix of correlation coefficients (r) of the selected six variables was presented in Table 5.
The concentration of Cr, Ni, Zn, Cu and Fe in all sample stations were found to be under WHO recommended norms. Cadmium concentrations in unpolluted natural waters are usually below 1 µg dm-3.25 It is chemically similar to zinc and occurs naturally with zinc and lead in sulphide ores. The concentration of Cd in all sample stations was found to be above-recommended norms (WHO the highest desirable limit 0.005 mg dm-3), as a possible sign of natural pollutions originated from cadmium sulphide ores in this area.
Sample Locality Possible pollution sources
S1 Marincë Low probability S2 Sllatinë Low probability
S3 Pollatë Settlement, traffic and agriculture S4 Bajqinë Settlement, traffic and agriculture S5 Podujevë
(exit)
The settlement, wastewater from Podujeva city, traffic and agriculture
S6 Gllamnikë The settlement, agriculture wastewater from "ABB" meat and juice factory
S7 Llozhan Settlement, wastewater, traffic and agriculture
S8 Milloshevë Settlement, wastewater, traffic and agriculture
Figure 2. Scatter box plot diagrams of some selected heavy metals.
Table 2. The concentration of some metals in water sample stations
Heavy metal
Detection limit, mg dm-3
WHO standard, mg dm-3
S1 S2 S3 S4 S5 S6 S7 S8 S9
Cr 0.003 0.05 0.008 0.007 0.007 0.008 0.009 0.010 0.010 0.012 0.011
Cd 0.0008 0.005 0.022 0.019 0.019 0.021 0.024 0.022 0.017 0.016 0.017
Ni 0.006 0.07 0.009 0.008 0.008 0.012 0.018 0.011 0.011 0.009 0.007
Zn 0.0015 5 nd* nd nd nd nd nd nd nd nd
Mn 0.0015 0.1 0.099 0.105 0.095 0.124 0.259 0.231 0.089 0.076 0.069
Cu 0.0015 2 0.005 0.004 0.004 0.004 0.005 0.006 0.005 0.005 nd
Fe 0.005 0.3 0.205 0.178 0.178 0.188 0.227 0.230 0.088 0.085 0.086
Pb 0.010 0.01 0.011 0.010 0.010 0.021 0.040 0.042 0.016 0.014 0.013
Table 3. Descriptive statistics of 6 variables in 9 cases
Variable, mg dm-3 Descriptive statistics
Mean Geometric Median Minimum Maximum Variance Std. dev.
Cr 0.0091 0.0090 0.0090 0.0070 0.0120 0.00 0.0018
Cd 0.0197 0.0195 0.0190 0.0160 0.0240 0.00 0.0027
Ni 0.0103 0.0099 0.0090 0.0070 0.0180 0.00 0.0033
Mn 0.1274 0.1146 0.0990 0.0690 0.2590 0.00 0.0689
Fe 0.1628 0.1511 0.1780 0.0850 0.2300 0.00 0.0603
Pb 0.0197 0.0169 0.0140 0.0100 0.0420 0.00 0.0126
Table 4. Anomalous values (extremes and outliers) of 6 metals in 9 water samples
Sample Extremes of parameters (¤)
Outliers of parameters (o)
S1 No reg. No reg.
S2 No reg. No reg.
S3 No reg. No reg.
S4 No reg. No reg.
S5 Mn (0.259 mgdm-3) Ni (0.018 mgdm-3), Pb (0.04 mgdm-3) S6 Mn (0.231 mgdm-3) Pb (0.042 mgdm-3)
S7 No reg. No reg.
S8 No reg. No reg.
S9 No reg. No reg.
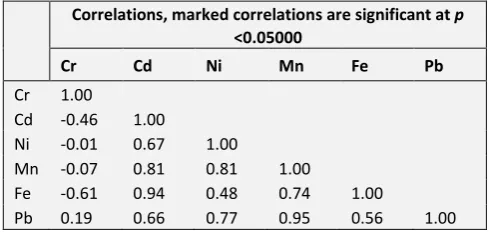
Table 5. Matrix of correlation coefficients (r) of selected six variables
Correlations, marked correlations are significant at p
<0.05000
Cr Cd Ni Mn Fe Pb
Cr 1.00
Cd -0.46 1.00
Ni -0.01 0.67 1.00
Mn -0.07 0.81 0.81 1.00
Fe -0.61 0.94 0.48 0.74 1.00
Pb 0.19 0.66 0.77 0.95 0.56 1.00
Concentrations of Mn at stations S2, S4, S5 and S6 were found to be above-recommended norms (WHO the highest desirable limit 0.1 mg dm-3) as a possible sign of natural pollutions originated from manganese ores in this area and uncontrolled use of fertilizers, varnish and fungicides in this area. Pb in all sample stations were found to be above WHO recommended norms from 0.01 mg dm-3, originated (possible) from lead sulphide ores in this area.26
Basic statistical parameters (Mean, Geometric mean, Median, Minimum, Maximum, Variance and Standard deviation) for six parameters analyzed in water samples are presented in Table 3. Based on the two-dimensional scatter box plot diagrams (Fig. 2) from 6 experimental data were constructed and anomalous values (Table 4). In the sample station, S5 and S6 extreme values of Mn (0.259 and 0.231 mgdm-3, respectively) were registered. The sample S
5 and S6, the outlier value of Pb (0.040 and 0.042 mgdm-3, respectively) was recorded.
Also, the outlier value of Ni at the sample station S5 was registered. The statistical regression analysis has been found a highly useful technique for the linear correlating between various water parameters, and the correlation coefficient (Table 5) indicates a positive and negative significant correlation of variables with each other. A positive correlation means one parameter increase with other parameters and negative correlation means one parameter increase with other parameters decreases. In this study summer period (see Table 5). Cd showed a highly significant positive relationship with Ni, Mn, Fe and Pb originated mainly of sulphide ores in this area.26 Ni showed a highly significant positive relationship with Mn and Pb. Manganese showed a highly significant positive correlation with Fe and Pb.
CONCLUSIONS
The concentration of heavy metals - Cr, Ni, Zn, Cu and Fe - in all sample stations were found to be under WHO recommended norms. The concentration of Cd in all sample stations were found to be above-recommended standards as a possible sign of natural pollutions originated from cadmium sulphide ores in this area. Concentrations of Mn at stations S2, S4, S5 and S6 were found to be above-recommended norms as a possible sign of natural pollutions originated from Manganese ores in this area and uncontrolled use of fertilizers, varnish and fungicides in this area. Pb in all sample stations was found to be above WHO recommended norms originated (possible) from Lead sulphide ores in this area.
Based on the two-dimensional scatter box plot diagrams in sample stations, S5 and S6 anomalies values of Mn and Pb were registered. Also, the outlier value of Ni at the sample station S5 was registered. The statistical regression analysis has been found a highly significant positive relationship of Cd with Ni, Mn, Fe and Pb originated mainly of sulphide ores in this area. Ni showed a highly significant positive correlation with Mn and Pb. Manganese showed a highly significant positive relationship with Fe and Pb.
REFERENCES
1Chirila, E., Bari, T., and Barbes, L., Drinking water quality assessment in Constanta town. Ovidius Univ. Ann. Chem., 2010, 21, 87-90.
2Hamilton, L. S., Food and Agriculture Organization of the United Nations, 1st Ed., Rome, 2008, 78.
3Close, M., Dann, R., Ball, A, Pirie, R., Savill, M. and Smith, Z., Microbial groundwater quality and its health implications for a border-strip irrigated dairy farm catchment, New Zealand,
J. Water Health, 2008, 6(1), 83–98.
https://doi.org/10.2166/wh.2007.020
4Keswick, B. H., Groundwater Pollution Microbiology. New York, John Wiley and Sons. 1984, 39-64.
5Thompson, T., Fawell, J., Kunikane, S., Jackson, D., Appleyard, S., Callan, P., Bartram, J. and Kingston, P., Chemical safety of drinking-water: Assessing priorities for risk management, World Health Organization. Geneva, 2007.
6Montgomery, J. M., Water Treatment, Principles and Design. John Wiley & Sons, New York, 1996, 474.
7Brils, J., Sediment monitoring and the European water framework directive. Ann. Inst. Superiore Sanita, 2008, 44, 218–223.
8Šajn, R., Bidovec, M., Andjelov, M., Piric, S. and Gosar, M., Geochemical atlas of Ljubljana and surround. Geološki Zavod Slovenije (Geological Survey of Slovenia), Ljubljana, 1998, 670.
9Kim, H. T., Soil sampling, preparation and analysis, Marcel Dekker, New York. 1995, 408.
10Mohameda, R. A., Abdel-Lateefa, A. M., Mahmouda, H. H. and Helalal, A. I., Determination of trace elements in water and sediment samples from Ismaelia Canal using ion chromatography and atomic absorption spectroscopy. Chem.
Spec. Bioavail., 2012, 24(1), 31-38.
https://doi.org/10.3184/095422912X13257005726800
11Gashi, F., Franciskovic-Bilinski S. and Bilinski, H., Analysis of sediments of the four main rivers (Drini i bardhë, Morava e Binces, Lepenc and Sitnica) in Kosovo. Fresenius Environ. Bull., 2009, 18, 1462-1471.
12Gashi, F., Stanislav Frančišković-Bilinski, S., Bilinski, H. and
Kika, L., Assessment of the effects of urban and industrial development on water and sediment quality of the Drenica River in Kosovo. Environ. Earth Sci., 2016, 75(9), article number 801. https://doi.org/10.1007/s12665-016-5612-7
13Gashi, F., Frančišković-Bilinski, S., Bilinski, H., Troni, N., Bacaj,
M. and Jusufi, F., Establishing of monitoring network on Kosovo rivers: preliminary measurements on the four main rivers (Drini i Bardhë, Morava e Binçës, Lepenc and Sitnica). Environ. Monit. and Assess., 2011, 175, 279–289. https://doi.org/10.1007/s10661-010-1511-7
14Gashi, F., Troni, N., Faiku, F., Laha, F., Haziri, A., Kastrati, I., Beshtica, E. and Behrami, M., Chemical and statistical analyses of elements in river water of Morava e Binçës. Am. J. Environ. Sci., 2013, 9(2), 142-155. https://doi.org/10.3844/ajessp.2013.142.155
15Gashi, F., Troni, N., Hoti, R., Faiku, F., Ibrahimi, R., Laha, F., Kurteshi, K., Osmani S. and Hoti, F., Chemical determination of some elements in water of Sitnica (Kosovo) by ICP-MS technique. Fresenius Environ. Bull., 2014, 23(1), 91-97.
16Wikipedia.org/wiki/Lab_river
17WHO, Guideline for drinking water quality 3rd ed. Vol.1 recommendations WHO, Geneva, 2004, 189.
18WHO, Chemical safety of drinking-water: Assessing priorities for risk management. Int. J. Environ., 2007.
19APHA, Standard methods for the examination of water and wastewater. American Public Health Association, 20th ed. DC, NY. 1998, 100-138.
20Baba, A., Kaya, A., Birsoy, Y. K., The effect of Yatagan thermal power plant (Mugla, Turkey) on the quality of surface and ground waters. Water Air Soil Pollute, 2003, 149, 93-111. https://doi.org/10.1023/A:1025660629875
21Dalmacija B., Water Quality Control in Towards of Quality Management, (in Serbian), Textbook. 2000.
22World Health Organization., Guidelines for Drinking-water Quality, 4th ed. Geneva, 2011.
23Stat Soft, Inc. STATISTICA (data analysis software system), ver. 6. 2001. http://www.statsoft.com.
24Tukey, J. W., Exploratory data analysis. Addison-Wesley. 1977.
25Friberg, L., Nordberg, G. F. and Vouk, V. B., Handbook of the toxicology of metals. Vol. II. Amsterdam, Elsevier, 1986, 130–184.
26Feraud, J., Maliqi, G. and Meha, V. Famous mineral localities: The Trepca mine. The Mineral Record, 2007, 38(4), 337-368.