STRUCTURAL AND DIFFUSIONAL STUDY OF PURE
ETHANOL AND WATER ON Pt (III) SURFACE USING
MOLECULAR DYNAMICS SIMULATION
Kholmirzo Kholmurodov,
[a]*Ermuhammad Dushanov,
[b]Kenji Yasuoka,
[c]Hagar Hassan,
[d]Ahmed Galal,
[e]and Nasser Sweilam
[f]Keywords: Molecular dynamics simulation, Ethanol, Water, Pt (111), Diffusion coefficient, Activation energy of diffusion.
Molecular dynamics simulations were performed on ethanol–water–Pt system for studying the structural and diffusion behaviour of both ethanol and water molecules on the surface of Pt (111). This work is concerned with the differences between pure liquids and solutions in their diffusional behaviour. The self-diffusion coefficients and activation energies of diffusion of pure ethanol and water on Pt (111) surface were calculated and compared with the corresponding values of their mixtures. The results showed that the values of both the diffusion coefficients and activation energies are strongly affected by the purity of chemical species under investigation. A comparison between two different metal surfaces was also investigated and the results revealed that the nature of metal surface has a strong effect on the adsorption and diffusional behaviour of liquids based on their affinity towards a specific type of surfaces in addition to the hydrophobicity and hydrophilicity of the metal surface.
* Corresponding Author
[a] Laboratory of Radiation Biology, Joint Institute for Nuclear Research & Dubna International University, Dubna, Moscow Region, Russia. E-mail: [email protected].
[b] Laboratory of Radiation Biology, Joint Institute for Nuclear Research & Institute of Nuclear Physics, Tashkent, Uzbekistan. E-mail: [email protected].
[c] Department of Mechanical Engineering, Keio University, Japan. E-mail: [email protected].
[d] Chemistry Department, Faculty of Science, Cairo University, Egypt. E-mail: [email protected].
[e] Chemistry Department, Faculty of Science, Cairo University, Egypt. E-mail: [email protected].
[f] Mathematics Department, Faculty of Science, Cairo University, Egypt. E-mail: [email protected].
1. Introduction
Methanol and ethanol are known to be among the most promising renewable resources that can replace petroche-micals.1 Among the renewable energetic resources, ethanol is a green fuel that can be used directly as a fuel or as a gasoline enhancer since it is not toxic, does not contaminate with water resources,2 and it can be produced in large quantities from the agriculture products.3
Metal surfaces such Au nanotubes were used to study the structure of water, ethanol and water–ethanol mixtures.4 Platinum is the most known surface used for oxidation of ethanol in fuel cell applications through the activation of the dissociative adsorption of ethanol.5 Platinum surfaces are used as a catalyst to activate carbon–carbon and carbon– oxygen bond breakage which are the elementary steps in oxidation of alcohols.6 The structural properties of liquids and solutions at molecular level can be investigated by
means of molecular dynamics (MD) simulation that acts as a powerful tool to simulate the behaviour of such systems alone or in the presence of solid surfaces.7,8 MD simulation can provide information about the structure and dynamics of the system and the event which can take place on the surface within a few picoseconds.9 Also, MD simulation allows the computation of some kinetics and structural properties such as diffusion coefficient, activation energy of diffusion and radial distribution functions that help in getting some information about the structure of both solid and liquid structures.10
Alcohol–water mixture often shows quite different properties than the corresponding pure components. Of particular interest, are the structure and diffusion properties, which play important roles in the theoretical study and technological applications involving mass transfer.2 In our previous work,2 we investigated the behaviour and structure of 50-50 % ethanol–water mixture in absence and presence of a platinum surface by means of the MD simulation technique. We found that the presence of metal surface such as Pt enhances the diffusion property of both ethanol and water. Moreover, ethanol provided different affinity to Pt surface than that provided by water molecules.
This work is a continuation to our study of the behaviour of a mixture of solvents at solid Pt surfaces.2 The aim of this work is to study the behaviour of both pure ethanol and pure water on the surface of Pt (III) and to compare this results with that of 50-50% (by molecules) ethanol–water mixture. Moreover, the comparison of the behaviour of these solvents will be studied at two different surfaces Pt surface (this work) and Au nanotube as indicated by Wang Yao-Chun et al.4 This will be important to reveal the effect of changing the structure of the metallic substrate with respect to different interfacial forces and interactions at the interface such as hydrophobicity/hydrophilicty and electrostatic interactions.
2. Simulation method
We have studied the molecular dynamics of pure ethanol and pure water separately on the presence of a platinum surface at various temperatures between 250 to 600 K using the DL_POLY_2.0 code, which was developed by the Molecular Simulation Group at the Daresbury Laboratory (England) with the support of the Research Council for the Engineering and Physical Sciences (project CCP5 of the simulation of condensed phases). DL_POLY is a general-purpose MD simulation package developed by W. Smith, T.P. Forester and I.T. Todorov.13,14
Ethanol and water molecules are described using the force field from the DL_POLY database,13,14 where bonding, angular, and dihedral parameters are incorporated into standard molecular mechanics potentials. All nonbonding interactions are accounted for via Lennard–Jones (LJ) potentials and Coulombic interactions based on the partial charges associated in each atom. The computer simulations have been performed for a MD cell of a volume V = (54.92, 54.92, 63.8) Å3 under the energy and temperature control. The temperature of the system was varied from 250 to 600 K using the annealing process starting with 250 K then raises the temperature by 25 K in each simulation. The number of molecules of both ethanol and water is 2304 molecules while that of Pt is 588 (Pt4) molecules, for a total of 2352 atoms. The metallic substrate used was cubic Pt, which has the formula Pt4; in this case we have four atoms for one unit cell in the face centered-cubic structure that form (111) orientation. Pt (111) surface was arranged in six layers numbering a total of 2352 atoms. The surface area was 3016.43 Å2; and the lattice constant was a = 3.923 Å. All the parameters of platinum were taken from EIM databases and datasets website supported by the Russian Foundation for Basic Research. 15 Our Pt (111) surface has the characteristics described by us z = 4 and symmetry Fm3m.
The integration of the equations of motion was performed using the Verlet integration scheme in quaternion. The integration step was 1 fs (femtosecond); a canonical (nvt) ensemble was used for the simulated system, and the Nose– Hoover algorithm was employed to keep the desired temperature. The intermolecular chemical bonds were estimated on the basis of the Shake algorithm with an accuracy of 10–8. The Ewald summation with a convergence parameter of 10–6 was used for the calculation of electrostatic forces in the periodic system.13,14 All simula-tions were periodic in three dimensions.
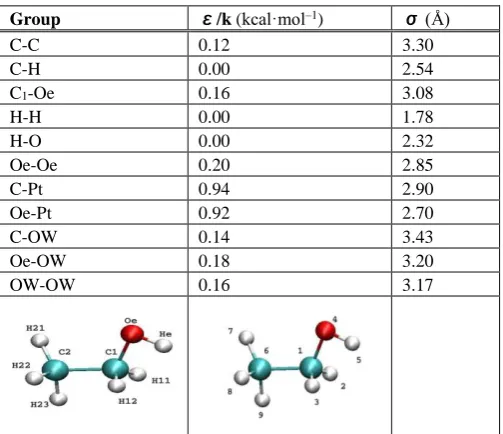
Water was represented by the constrained OW–HW bond potential; thus a SPC model was used. Tables 1 and 2 contain bond lengths and intermolecular Lennard–Jones parameters for ethanol, water molecules, and a Pt surface, respectively.
Table 1. The effective charges of atoms of ethanol, water and a Pt surface.
Atom q / e, proton charge
C1 0.05
C2 –0.27
Oe –0.66
He 0.43
H 0.09
OW –0.82
HW 0.41
Pt 0.00
Table 2. The intermolecular Lennard–Jones parameters for ethanol, water, and a Pt surface, in a cell volume V= (54.92, 54.92, 63.801) Å3.
Group ε/k (kcal·mol–1) σ(Å)
C-C 0.12 3.30 C-H 0.00 2.54 C1-Oe 0.16 3.08
H-H 0.00 1.78
H-O 0.00 2.32
Oe-Oe 0.20 2.85 C-Pt 0.94 2.90 Oe-Pt 0.92 2.70 C-OW 0.14 3.43 Oe-OW 0.18 3.20 OW-OW 0.16 3.17
Table 3. The potential parameters used for ethanol molecules.
Harmonic bond potential ( )2/2
0
r r K ij
Bond K (kcalmol–1Å) r0 (Å)
C1-C2
C-H C1-Oe
Oe-He 222 309 428 545 1.52 1.11 1.42 0.94
Angular potential ( )2/2
0
K ijk
Group K (kcalmol–1rad–2) 0 ()
H1-C1-Oe
H1-C1-C2
H1-C1-H1
Oe-C1-C2
He-Oe-C1
H2-C2-H2
H2-C2-C1
45.90 34.60 35.50 75.70 57.50 35.50 34.60 109.44 109.46 120.00 109.00 109.50 109.50 109.46
Dihedral potential ( )2/2
0
K ijkn
Group K (kcalmol–1) 0 ()
C2-C1-Oe-He
H12-C1-Oe-He
H11-C1-Oe-He
Oe-C1-C2-H21
Oe-C1-C2-H22
Oe-C1-C2-H23
H11-C1-C2-H21
H11-C1-C2-H22
H11-C1-C2-H23
H12-C1-C2-H21
H12-C1-C2-H22
H13-C1-C2-H23
1.30 0.14 0.14 0.16 0.16 0.16 0.16 0.16 0.16 0.16 0.16 0.16 180 60 –60 180 60 –60 –60 180 60 60 –60 –180
The configuration energy of the molecular model is represented as a sum of the energies of the bonding (Eval)
and non-bonding (Enb) interactions:
E = Eval + Enb. (1)
The energy of the valence (bonding) interactions Eval is
given by the following formula:
Eval = Ebond + Eang + Edih + Eteth, (2)
where Ebond is the energy of chemical bonds, Eang is the
energy of angular bonds, Edih is the energy of dihedral bonds,
and Etether is tether energy.
The energy of the non-valence (non-bonded) interactions is a sum of the energies of the van-der-Waals (vdW), electrostatics (Coulombic), and hydrogen bonds:
Enb = EVdW + Ecoul (3)
During the MD simulations, the following potential types, which represent the topology of the molecular field for an ethanol–water system, were used:13,14
Harmonic bond
potential: ( 0)2 2
1 )
(r K r r
U ij ij (4)
Harmonic bond angle: 2 0) ( 2 1 )
(ijk K ijk
U (5)
Harmonic dihedral: 2 0) ( 2 1 )
(ijkn K ijkn
U (6)
The Lennard– Jones potential: 6 12 4 ) ( ij ij ij ij ij ij ij r r r
U (7)
Coulombic interaction: ij j i ij r q q r U 0 4 1 ) (
(8)
Quartic tether potential: 4 0 2 0 ' 4 1 2 1 )
(r kri kri
U (9)
For the Lennard-Jones potential (7), σij is the size
parameter, εij the energy parameter, and Lorentz-Berthelot
mixing rules were used: σij=(σi + σj)/2 and ij ij .
For the Coulombic potential (8), qiis the charge of site i
and rij the distance between sites i and j.
The tether potential (9) suggests that the momentum has no longer been a conserved quantity of the simulation. The force on the atom “i” arising from the tether potential is obtained using the general formula:
0 0 0 0 ) ( 1 i i i i
i U r r
r r F
(10)
The atomic sites to be tethered to a fixed point in space, ri0,
are taken as their position at the beginning of the simulation. This is also known as position restraining. Tethering potential is applied for the surface atoms only. Under a tethering potential the surface atoms would allow, nevertheless, to vibrate around their equilibrium positions. We choose the values of k=0.2 and k`=0.4 to avoid the destruction of our surface during heating and annealing processes.
One of the potentials used in MD simulation using DL_POLY to describe the metal surface is the one described by Sutton and Chen (SC or st-ch):30
i i
U
U
(11)1 2
n
i i
j i ij
a U c r
(12)Here ρi is a density-like term for atom i:
m
i
j i ij
a
r
(13)In this equation the potential has three dimensionless parameters adjustable for the metal materials. They are c, n, and m, and can be chosen for various materials, especially metals. The variable ε sets the energy parameter and a is the lattice constant. In this work we used such kind of potential to describe Pt (111) surface and Table 4 contains the SC potential parameters used.
Table 4. The Sutton-Chen (st-ch) potential parameters of platinum. ε (kcal·mol–1) a (Å) N M c
3. Results and Discussion
Figure 1 shows three MD simulated snapshots of the pure ethanol (A), pure water (B) and 50-50% (by molecules) ethanol–water mixture (C).
(A) (B)
(C)
Figure 1. The snapshots of 100% ethanol (A), 100% water (B) and 50-50% (by molecules) ethanol–water mixture (C).
3.1. Diffusion coefficient and activation energy of diffusion
Mechanistic studies of ethanol chemical interactions with metal and metal oxide single crystal surfaces are of fundamental importance. However, while there are many studies of ethanol chemisorption over for example Ni,31 Pd32–34 and Cu35–37 single crystals, those over platinum are limited to the Pt (111)38–40 and Pt (331)41 surfaces.
We have estimated the self-diffusion coefficient of both pure ethanol and pure water in presence of Pt (III) surface at 298 K. From our previous work,2 the calculated diffusion coefficients of water and ethanol in the mixture were enhanced in presence of Pt surface. The values for the self-diffusion coefficients are estimated for each liquid separately, and the results of the calculations are summarized in Table 5. We observed that, the value of diffusion coefficient of pure ethanol is much lower than its value in the mixture unlike water molecules that showed higher value of diffusion coefficient for the pure liquid compared to its corresponding value in the mixture. These results can be attributed to the hydrogen bonding in the liquid phase that plays an important role on the molecular level and should affect the value of diffusion coefficient. Thus, in case of pure ethanol the only way to form hydrogen
bond is by forming intermolecular hydrogen bonds with other ethanol molecules to form dimer or trimer and also they have high chance to form 1D chain. Formation of 1D chain of ethanol molecules can lead to a decrease in the mobility of ethanol molecules in the vicinity of simulation box that renders the molecules much slower than in case of a mixture of ethanol–water. On the other hand, the ability of ethanol molecules to form hydrogen bond with other ethanol molecules decreases in ethanol–water mixture. Another contributing factor to this observation is the ability of ethanol molecules to form hydrogen bonds with water molecules. Moreover, the molecular mass of ethanol–water dimers is relatively smaller than that of an ethanol–ethanol dimer.
Table 5. The values of diffusion coefficient and activation energy of ethanol and water in pure liquids and in solution of 50-50% (by molecules) ethanol–water mixture.
Simulated system Diffusion coefficient (D) / m2·s-1 × 10⁻⁹
Activation Energy (Ea) / Kcal·mol–1
Pure Ethanol 0.26 3.411 Pure Water 3.86 3.718 50% ethanol in
ethanol–water mixture
1.07 2.470 50% water in
etha-nol–water mixture 2.10 2.980
The same explanation can be applied to explain the calculated values of diffusion coefficients in case of pure water and ethanol–water mixtures. Unlike the case of ethanol, the presence of ethanol molecules with water molecules will likely lead to the formation of hydrogen bonds between “mixed” molecules which results in slower mobility of the structures thus formed.
Figure 2. Arrhenius plot of pure liquids (solid lines) and ethanol– water mixture (dashed lines).
a graph of lnD as function of the reciprocal of temperature in Kelvin (Figure 2) we observed that both water and ethanol give a straight line which indicates that they obey Arrhenius relation. And the value of activation energy of diffusion can be calculated from the following relation:42
RT Ea
e D
D 0
where, D is the diffusion coefficient, Do is the Arrhenius
constant, R is the universal gas constant, T is the tempe-rature and Ea is the activation energy of diffusion.
We calculated the activation energy of diffusion (Ea) from the slope of Arrhenius plot and the results are in Table 5. The values of Ea’s are in agreement with the values of diffusion coefficients as activation energy of diffusion of pure ethanol is higher than that of ethanol molecules in solution of ethanol and water.
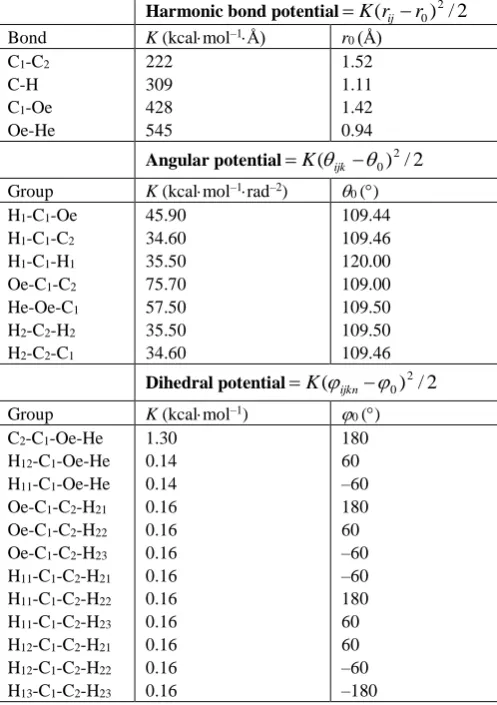
3.2. Interaction of ethanol and water with Pt (111) surface
The interfacial structure and adsorption behaviour of both ethanol and water can be investigated by calculating the normalized ethanol and water density profile as a function of the distance from Pt (111) surface. In the density profile, the higher density of liquid molecules indicates stronger interaction with the surface. Figure 3 shows the density profiles of 100% water (A), 100% ethanol (B) and 50-50% (by molecules ≈ 72-28% weight fraction) ethanol–water mixture). The density profile of pure water shows two peaks, a well-defined first adsorption layer from 5-8 Å and one more diffuse layer from 8-10 Å which indicates that water molecules can adsorb directly on the surface of Pt (111) forming a shell-like adsorption layer. The high density of the first peak indicates that water molecules interact strongly with Pt surface which is in agreement with the hydrophilic nature of Pt surface.43 While the density profile of pure ethanol shows only one adsorption peak of lower density than that of water which indicates that for pure liquids, water interacts with Pt (111) stronger than ethanol. This can attributed to the strong hydrogen bonding of ethanol molecules with each other where, they can form dimer, trimmer or/and 1D chains as previously mentioned. These 1D chains lead to decreasing the interaction of ethanol molecules with Pt surface, in addition, the steric hindrance of ethanol molecules relative to the simple structure of water molecules can affect the approaching of the molecules to the metal surface.
By comparing these results with our previous results of ethanol–water mixture we observed two differences: the first is in the height of the first adsorption peaks where, ethanol molecules show stronger interaction with Pt (111) surface than that of water in the mixture. The opposite behaviour was observed in case of pure water. We attributed this result to the fact that ethanol molecules in the mixture preferential-ly adsorb onto Pt (111) (selective–competitive adsorption).2
The second observed difference between the density profiles of pure liquids and that of mixture is in the position of adsorption peaks of both water and ethanol. The ability of ethanol molecules to approach the Pt (111) surface increases in the mixture compared to the case of pure liquids that also can be attributed to decreasing the probability of forming hydrogen bonds with the same kind of molecules which may
prevent ethanol molecules to form 1D and also water molecules to form clusters. It is worth to mention that at relatively large distances from the surface the relative density of pure liquids or even mixture approaches unity that is consistent with the bulk of solution. Also for pure water and for water and ethanol molecules in the mixture the first minimum approaches zero which means there is little or no movement of liquid molecules between the adsorption layer and the bulk of solution within the time scale of solution. While for the case of pure ethanol there is no well-defined adsorption peak for ethanol molecules and there is no distinction between the adsorption and diffusion layers which indicates that the thickness of diffusion layer is much larger than in case of pure water or in case of a mixture.
Figure 3. The density profiles of 100% ethanol (A), 100% water (B) and 50-50% (by molecules) ethanol–water mixture (C).
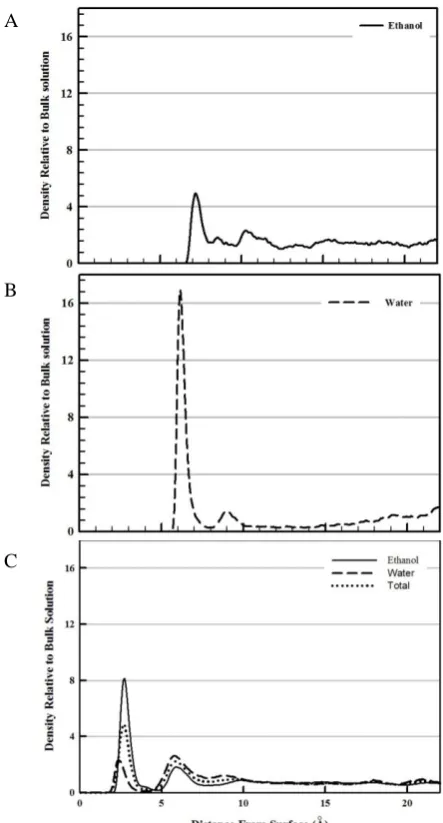
Figure 4 shows the radial distribution functions (g(r)) which can provide information about the interaction between Pt surface and liquid molecules. By comparing the structure behaviour of ethanol on Pt surface with that of the water on Pt surface we observe that the water molecules are more ordered on the surface than the ethanol molecules. It is also clear that, the interaction of ethanol with Pt surface is stronger in the mixture rather than of pure liquid; at the
same time the water molecules prefer to strongly interact in pure liquid compared with that in the mixture. These results seem to be in a good agreement with the density profiles discussed before. It is worth to mention that, by the temperature increase the amplitude of radial distribution peaks for pure water will essentially decrease; at the same time in the case of the ethanol one observes an opposite picture indicating that the ethanol desorption energy to be higher than that of water. The similar results were obtained for the ethanol–water mixture as in.2
Figure 4. The radial distribution functions showing the interaction between Pt surface and liquid molecules. Pt–Oe (A), Pt–OW (B), effect of temperature on Pt–Oe (C) and effect of temperature on Pt–OW (D).
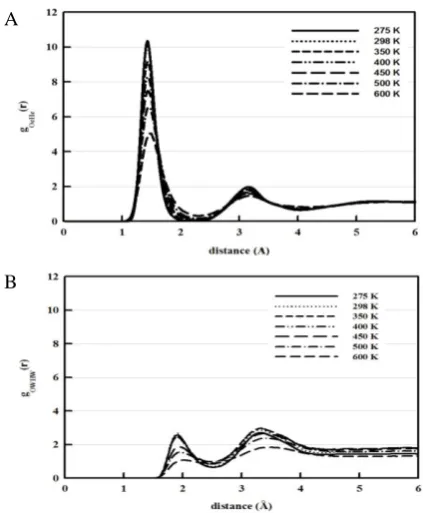
3.3. RDF correlation behaviour
Figure 5. The radial distribution functions of Oe–He (A), OW– HW (B), Oe–Oe (C) and OW–OW (D) for pure liquids (solid lines) and in case of mixture (dotted lines).
In studying of the liquid structures the gOH(r) and gOO(r)
RDFs have to be the most interesting statistical data to compare. The pure liquids, as discussed above, revealed different behaviour compared to the solution, so now one compare the g(r) behaviour for the pure liquids and the solution mixture. Figure 5 compare the gOH(r) of pure
ethanol with that of the ethanol molecules inside the solution. The first RDF peak is located at the distance less than 2Å, thereby referring a presence of the strong intermolecular hydrogen bonding between the ethanol molecules. Additionally, the height of the RDF peaks is higher for the 100% ethanol comparing with that of the ethanol-water mixture. This behaviour seems well correlated with the density profiles as shown in Figure 3. Thus the probability of finding two ethanol molecules at very short distances and formation of hydrogen bonds to be higher in the case of pure ethanol in comparison with the ethanol–water mixture one. The phenomena seem to be attributed by the hydration of the ethanol molecules to relatively separate and by the decrease of the probability in forming the intermolecular hydrogen bonds with other ethanol molecules. The similar results were obtained for the 100% water in Figure 5(B), though with a lower probability than that for the ethanol molecules. Regarding the gOO(r), it is obvious that the
second O–O peak for water molecules is very weak or fully absent as it is shown in Figure 5(D). On the other hand, the first peak amplitude of the RDF gOO(r) is higher in the case
of the ethanol–water mixture comparing with that of 100% ethanol (Figure 5(C)).
Figure 6. The effect of temperature on radial distribution functions of Oe–He (A), OW–HW (B), for pure liquids, insets: the corresponding coordination number as function of the distance.
The phenomena seem to be attributed by the stearic hindrance of the methyl group in the ethanol that increases in the pure liquids in comparison with that of the mixture solution. Another probable consequence of the point above, the O–O RDF for pure water displayed in Figure 5(D), it shows maximum reaching almost 8 which is much above what is expected for pure SPC water model (about 3, but without ethanol or surface). Thus, introducing of a Pt
B
D A
C
B
D A
C
A
surface into consideration seems to affect the water RDF, so the deviation from "expected" results for SPC (and other) water models is strong, thereby providing further interesting verification or application.
By investigating of the effect of temperature on the RDF we found that for the O–H atomic pair in pure ethanol and pure water the RDF peaks decrease with the temperature increase. This is the result of the atomic ordering decrease in the liquid system. At the same time as shown in Figure 6 the corresponding coordination number also decreases with the temperature. Comparing the coordination number versus distance in pure ethanol and pure water we found that in case of ethanol the flat plateau comparably is well-defined.
3.4. The nature of metal surface influence
In order to investigate the effect of changing the type of metallic substrates, we compared our data to those obtained by Wang Yao-Chun et al.4 who simulate the molecular dynamics of ethanol, water and their mixture inside Au nanotubes. We found noticeable resemblance for the results obtained for pure liquids especially in the shape of the density profiles. On the other hand, the height of the adsorption peaks in this study is much higher than those obtained by Wang et al. This can be attributed to the higher number of both ethanol and water molecules we used than those used by Wang Yao-Chun. But in case of a mixture the situation is completely reversed. Therefore, it could be concluded that Au surface tends to attract water molecules much stronger than ethanol molecules in the mixture. Water molecules will therefore preferentially adsorb to the Au surface prohibiting competitive adsorption of ethanol molecules. This could be noticed from the positive shift in the position of the first peak of ethanol in the mixture – compared to pure ethanol. In fact Au surface appeared to be more hydrophobic in nature than Pt surface while, Pt and Pt-like metals (Rh, Ru and Pd) are supposed to behave as hydrophilic surfaces unlike Au surface that is supposed to behave as a hydrophobic surface.43 However, some literatures proved that water molecules have a contact angle approaching zero at clean gold surface. 44 From the molecular dynamics simulation point of view Au surface is very pure so we can consider Au surface in this case hydrophilic in nature that explains the high affinity of water to Au surface. All of these results refer to the affinity of ethanol molecules to Pt surface is much higher than to Au surface that is in agreement with the experimental results that consider Pt surface is the best catalyst for dissociative adsorption of ethanol45 and it is always used as the best catalyst for oxidation of ethanol in fuel cell applications and many other applications.46 By the same way we can consider that the other Pt-like metals behave as Pt surface in its trend.
4. Conclusion
We have simulated the ethanol/Pt and water/Pt systems using DL_POLY_2.0 code and the results were correlated with our previous study concerning the molecular dynamics simulations of the 50-50% (by molecules) ethanol–water mixture. The self-diffusion coefficients of both 100% ethanol and 100% water were calculated at room temperature and the analysis showed that the diffusion coefficient of pure ethanol is much lower than that in the
mixture. The diffusion activation energies for both ethanol and water were estimated through the calculation of the self-diffusion coefficients at various temperatures (250–600 K); the energies were found to be 3.411 and 3.718 Kcal mol–1, respectively. These values were compared with that of the ethanol–water mixture and it was found that the activation energy of diffusion decreases in case of the mixture. That is due to the decrease in the probability of formation of hydrogen bonds between the similar molecules and the increase in the mobility of molecules toward the metal surface. Our MD simulation results for the Pt surface were compared with other works, where the Pt is replaced with the Au as a metal surface. The comparative analysis reveals that the nature of the metal surface has possess a great influence on the structural and dynamical behaviour of the solution. Also the correlation between RDFs and density profiles is well established. Finally, we conclude that the affinity of the ethanol molecules to the Pt surface is much higher than their affinity to the Au surface. These results seem to be in a good agreement with the experimental data demonstrating that Pt surface has to be the best surface for dissociative adsorption of the ethanol molecules.
5. Acknowledgement
This work has been performed in the framework of joint collaborative agreement Arab Republic of Egypt (ARE) – Joint Institute for Nuclear Research (JINR) (project #302). This work was supported in part by the Grant in Aid for the Global Centre of Excellence Program of the Centre for Education and Research of Symbiotic, Safe and Secure System Design from Japan’s Ministry of Education, Culture, Sport, and Technology.
6. References
1 Okkerse, C., van Bekkum, H. Green Chem., 1999, 1, 107. 2 Kholmurodov, Kh., Dushanov, E., Yasuoka, K., Khalil, H.,
Galale, A., Ahmed, S., Sweilam, N., Moharram, H. Chem. Phys.,2012, 402, 41.
3 Shen, S. Y., Zhao, T. S., J. B. Xu, J. B. Int. J. Hydrogen Energ.,
2010, 35, 12911.
4 Chun, W. Y., Chuan, C., Pon, J. S., Chin. J. Catal., 2008, 29,
1099.
5 Galal, A., Atta, N. F., Khalil, H. K. Int. J. Electrochem. Sci., 2012,
7, 768.
6 Sachtler, W. M. H., Ichikawa, M. J. Phys. Chem., 1986, 90, 4752. 7 Kusalik, P. G., Lyubartseu, A. P., Bergman, D. L., Laaksonen, A.
J. Phys. Chem. B,, 2000, 104, 9533.
8 Soper, A. K., Finney, J. L. Phys. Rev. Lett., 1993, 71, 4346. 9Kholmurodov, Kh., Puzynin, I., Smith, W., Yasuoka, K.,
Ebisuzaki, T. Comput. Phys. Commun., 2001, 141, 1.
10 David, C. Y., Computational Chemistry: A Practical Guide for
Applying Techniques to Real-World Problems, John Wiley & Sons, Inc., New York, 2001.
11 Yang, M.-M., Bao, X.-H., Li, W.-X. J. Phys. Chem. C, 2007,
111, 7403.
14 Smith, W., Forester, T. R., Todorov, I. T. The DL Poly 2 user
manual, Version 2.19, STFC Daresbury Laboratory,
Daresbury, Warrington WA4 4AD Cheshire, UK, 2008.
15 WWW-MINCRYST, Crystallographic and Crystallochemical
Database for Minerals and their Structural Analogues. http://database.iem.ac.ru/mincryst/.
16 Brooks, B. R., Brooks III, C. L., Mackerell, A. D., Nilsson, L.,
Petrella, R. J., Roux, B., Won, Y., Archontis, G., Bartels, C., Boresch, S., Caflisch, A., Caves, L., Cui, Q., Dinner, A. R., Feig, M., Fischer, S., Gao, J., Hodoscek, M., Im, W., Kuczera, K., Lazaridis, T., Ma, J., Ovchinnikov, V., Paci, E., Pastor, R. W., Post, C. B., Pu, J. Z., Schaefer, M., Tidor, B., Venable, R. M., Woodcock, H. L., Wu, X., Yang, W., York, D. M., Karplus, M., J. Comp. Chem., 2009, 30, 1545.
17CHARMM c36b1 Documentation. HTML formatting scripts
developed by Venable, R. M., NIH/NHLBI/DIR, Lab. of Comput. Bio. http://www.charmm.org/documentation/c36b1/ index.html.
18 Bjelkmar, P., Larsson, P., Cuendet, M. A., Hess, B., Lindahl, E.,
J. Chem. Theory Comput., 2010, 6, 459.
19 van der Vegt, N. F. A., van Gunsteren, W. F., J. Phys. Chem. B,
2004, 108, 1056.
20 Schravendijk, P., van der Vegt, N., J. Chem. Theory Comp.,
2005, 1, 643.
21 Patel, S., Brooks, Ch. L., J. Chem. Phys., 2005, 123, 164502. 22 Glennon, T. M., Zheng, Y.-J., Le Grand, S. M., Shutzberg, B. A.,
Merz, K. M. Jr., J. Comput. Chem., 1994, 15, 1019.
23 Cheatham, T. E. III, Crowley, M. F., Fox, T., Kollman, P. A.,
Proc. Natl. Acad. Sci., 1997, 94, 9626.
24 Xia, X., Perera, L., Essmann, U., Berkowitz, M. L., Surf. Sci.,
1995, 335, 401.
25 Anisimov, V. M., Vorobyov, I. V., Roux, B., MacKerell A. D.
Jr., J. Chem. TheoryComput., 2007, 3, 1927.
26 Siepmann, J. I., Sprik, M., J. Chem. Phys., 1995, 102, 511. 27 Sakuma, H., Tsuchiya, T., Kawamura, K., Otsuki, K., Surf. Sci.,
2003, 536, L396.
28 Michaelides, A., Ranea, V. A., de Andres, P. L., King, D. A.,
Phys. Rev. Lett., 2003, 90, 216102.
29 Morin, C., Simon, D., Sautet, P., J. Phys. Chem. B, 2004, 108,
5653.
30 Sutton, A. P., Chen, J., Philos. Mag. Lett., 1990, 61, 139. 31 Xu, J. Z., Zhang, X. P., Zenobi, R., Yoshinobu, J., Xu, Z., Yates.
J. T., Surf. Sci., 1991, 256, 288.
32 Bowker, M., Holroyd, R. P., Sharp, R. G., Corneille, J. S.,
Francis, S. M., Goodman, D. W., Surf. Sci., 1997, 370, 113.
33 Holroyd, R. P., Bennett, R. A., Jones, I. Z., Bowker, M., J. Chem.
Phys.,1999, 110, 8703.
34 Shekhar, R., Barteau, M. A., Catal. Lett.,1995, 31, 221.
35 Carlson, T. A., Agron, P. A., Thomas, T. M., Grimm, F. A., J.
Elec. Spec. Rel. Phenom.,1981, 23, 13.
36 Camplin, J. P., McCash, E. M., Surf. Sci., 1996, 360, 229. 37 Bowker, M., Madix, R. J., Surf. Sci., 1982, 116, 549.
38 Sexton, B. A., Rendulic, K. D., Hughes, A. E., Surf. Sci., 1982,
121, 181.
39 Rajumon, M. K., Roberts, M. W., Wang, F., Wells, P. B., J.
Chem. Soc., Faraday Trans., 1998, 94, 3699.
40 Panja, C., Saliba, N., Koel, B. E., Surf. Sci., 1998, 395, 148. 41 Cong, Y., van Spaendonk, V., Masel, R. I., Surf. Sci., 1997, 385,
246.
42 Zhong, L. W., Cong, C., Jian, Y., Heat Tran. Asian Res., 2008,
37, 86.
43 Meng. S., J. Chem. Phys., 2007, 127, 244710.
44 Butt, H.-J., Graf, K., Kappl, M., Physics and Chemistry of
Interfaces, Wiley-VCH Verlag & Co. KGaA, Weinheim,
2003.
45 Wang, M., Guo, D.-J., Li, H.-L., J. Solid State Chem.,2005, 178,
1996.
46 Zhao, Y., Yang, X., Tian, J., Wang, F., Zhan, L., Int. J.
Hydrogen Energ., 2010, 35, 3249.