In-situ Experiments to Capture the Evolution of Microstructure During Phase
Transformation of Titanium Under Dynamic Loading
BenjaminM.Morrow1,∗,DavidR.Jones1,PauloA.Rigg2,GeorgeT.Gray,III1,andEllenK.Cerreta1 1LosAlamosNationalLaboratory
2DynamicCompressionSector(DCS),InstituteforShockPhysics,WashingtonStateUniversity,ArgonneNationalLaboratory
Abstract.Under sufficient stresses, such as during dynamic loading, titanium experiences a phase transfor-mation from hcp alpha phase to hexagonal omega phase. Omega phase is often retained in the microstructure after unloading, and has a strong influence on subsequent mechanical properties. Simulations suggest there are multiple pathways and underlying mechanisms for this transformation. Due to the incredibly short timescales involved, experimental measurements for model validation have been difficult. However, new capabilities at the Advanced Photon Source have enabled diffraction measurements during plate impact experiments to study the evolution of titanium during transformation. These high-rate data allow us to probe the mechanism and kinetics of phase transformations in new ways. Recent results will be presented and compared to post-mortem char-acterization of soft-recovered shocked specimens. Comparisons are made with previous tests where material was shock-loaded and soft recovered for microstructural analysis. Together these techniques create a consistent picture of material behavior during the shock-inducedα–ωphase transformation in titanium.
1 Introduction
The solid-solid phase transition between hexagonal close-packed (hcp) alpha and hexagonal omega phases in tita-nium has important implications on mechanical proper-ties. Omega phase can form in hcp metals under shock loading conditions, and, as a metastable phase at ambient pressure, can be retained in the microstructure after un-loading, where it can contribute to subsequent deformation behavior [1–5]. Previous studies have examined the shock response of Ti single and multicrystals [6], and polycrys-tals [7–9]. Post-mortem microstructural investigations are an essential piece to determination of phase transformation pathways, but can only infer likely operations based on be-ginning and end states. In previous work, it was observed that when shock-loaded to∼15 GPa, titanium forms a two-phase microstructure, with characteristic omega lathes in-side alpha grains (suggesting a predominately forward,
α → ω pathway where the grains never reach 100%ω
-phase). It also suggested that the observed material behav-ior during shock can be described by the complex inter-play between traditional plasticity and phase transforma-tion mechanisms. Like twinning, it is expected that theα– ωphase transformation is a process characterized by both
nucleation and growth. However, such post-mortem anal-yses are not well-suited to measure order of operations, relative activity of mechanisms during testing, or kinetics. Hence, in-situ x-ray diffraction (XRD) is required to
ob-tain a complete picture of deformation behavior and phase transformations during shock loading. Recent advances in in-situ characterization techniques, including shock
test-∗e-mail: [email protected]
ing at advanced light sources, have unlocked the ability to directly observe microstructural processes and resulting material states during loading [10]. The current work ex-amines the α–ω phase transition in titanium using XRD during plate impact shock loading.
2 Experimental Procedures
2.1 Testing
High-purity (99.995%) polycrystalline titanium was used for this study. The material chemistry and processing was the same as a previous study [7]. Briefly, the material was supplied by American Elements (USA) as 20 mm thick plate. The plate was rolled and annealed in steps to reduce initial grain size. Samples were machined from the plate using electrical discharge machining and annealed under vacuum at 873 K for 4 hours. The oxygen impurity content is less than 80 ppm. Full chemical analysis is shown in Table 1.
A strong c-axis fiber texture aligned with the plate normal (through-thickness (TT) direction) was present in the specimens, and the microstructure consists of twin-free equiaxed grains with a 21-27µm average grain size.
Cylindrical specimens in form of 150µm thick foils were
prepared with faces parallel to the TT direction. Each thinned specimen was backed with a LiF window to hold the material at pressure for an extended period of time be-fore release.
Table 1.Chemical composition of as-received titanium plate, in ppm [7].
Element Fe V Al Si Ni Mn Cr Cu Mg O Ti
Amount (ppm) 10.7 1.1 3.6 11.6 3.2 1.2 2.6 1.5 2.5 <80 Balance
gun barrel inside a vacuum catch tank. Diagnostics be-hind the target looking through the backing window, no-tably photon Doppler velocimetry (PDV) and Velocimetry Interferometer System for Any Reflector (VISAR) probes, enabled velocity measurements of the interface between Ti and the LiF window. Shock loading was performed using the Impact Facilities at the Dynamic Compression Sector (DCS) at the Advanced Photon Source (APS) at Argonne National Laboratory. A catch tank downrange of the orig-inal sample location was fitted with steel plates to arrest debris after impact, and no recovery of samples for post-mortem examination was possible. Figure 1 shows the ex-perimental setup (with the vacuum tank open).
Fig. 1. Experimental setup of single-stage powder gun at DCS. The brass target plate containing the sample is fixed to the end of the powder gun (left). Diagnostics are attached to the back side of the sample. During testing, the projectile moves down the gun barrel (left), strikes the sample while x-rays are transmitted (center), and debris is collected in the back of the tank (right).
A LiF impactor was propelled down the barrel of a single stage powder gun towards each sample. A laser near the sample was used as a light gate to detect the in-coming projectile and trigger the x-rays and correspond-ing CCD image frames. X-rays were transmitted at a 25◦
angle through the front (impact) surface of the sample. Transmission Laue diffraction was used to create diff
rac-tion patterns, which were collected on a detector system comprised of a ∼75 mm scintillator, intensifier, splitter, and four PiMax cameras triggered to coincide with incom-ing x-rays [11]. The synchrotron x-ray beam was supplied in bunches spaced 153 ns apart. A U27 electromagnetic undulator was used to supply pink beam radiation with the third harmonic tuned to 23 keV. Four Rh mirrors and two filters (Al and Ag) were used to isolate the third har-monic. Distance between the sample and detector was set to the minimum possible length allowed by the experimen-tal setup (∼160 mm), and the x-ray beam center was offset
to one edge of the detector, to capture the largest amount of diffraction space possible.
2.2 Data Analysis Methods
X-ray diffraction patterns were collected during shock
loading as described above. Images were first corrected to account for distortions in the imaging system and to align corresponding pixels between frames (which depict the same scintillator viewed by separate cameras). The Dioptas software package [12] was used to analyze XRD images. Polycrystalline silicon was used as a standard material to calibrate images to allow quantification of the d-spacings of visible planes in diffraction patterns.
Ini-tial sample-to-detector distance for the static (pre-shock) samples was calculated from the standard, also. Because the samples move downrange after impact, true sample-to-detector distance for each independent frame was deter-mined by imposing a geometric correction that accounted for the time relative to impact and the sample velocity at that time. Bright LiF peaks originating from the impactor and backing window were masked and omitted. Intensity was integrated radially about the transmitted spot to con-vert XRD rings into peaks for line profile analysis and eas-ier comparison to tabulated d-spacings.
3 Results and Discussion
3.1 Shock Conditions & VelocimetryTable 2 shows the shot matrix used in this study. Both tests were carried out using the same shock conditions with dif-ferent timing to capture early (16-1-003) and late-stage (16-1-002) material behavior. Velocity at the Ti-LiF
inter-Table 2.Matrix of testing performed at DCS, including projectile velocity and resulting stresses in peak and steady-state
shock states (Shock State 1 and 2, respectively).
Test ID ProjectileVelocity State 1 State 2Shock Shock (km/s) (GPa) (GPa)
16-1-002 1.647 16.6 12.5 16-1-003 1.625 16.6 12.5
face was measured using VISAR. The Rankine-Hugoniot equations were used to determine stress from VISAR as outlined elsewhere [7], and is shown in Figure 2. After impact, the titanium loaded to shock state 1 (16.6 GPa), where it remained for approximately 50 ns, until partial release from the rear LiF window dropped the stress to shock state 2 (12.5 GPa). The sample remained at stress state 2 until unloading, about 700 ns after impact. X-ray bunches were spaced 153 ns apart in time at fixed inter-vals. To account for the effect of system jitter, the XRD
frames triggered coincident with the x-ray bunch nearest to impact time. Because of this, it is impossible to pre-specify the image timings relative to impact with greater
Fig. 2.Stress at the flyer-Ti and Ti-LiF surfaces as a function of time after impact, calculated using a 1-D shock-wave code [7]. Timings for the XRD camera frames are overlaid.
accuracy than∼76 ns, making it unlikely that shock state 1 will be sampled. Even so, timing relative to impact can be exactly calculated after the tests to determine the state of stress in the sample during each frame. Projectile ve-locity was chosen to ensure that the stress during shock state 2 would be greater than 10.1 GPa, theα–ω transi-tion stress for high-purity Ti [7]. This stress is also simi-lar to previous tests where material was shocked and soft recovered for microstructural analysis so that the present diffraction technique would be directly comparable to
pre-vious work [6–8].
3.2 Diffraction Analysis
Figure 3 shows the XRD patterns obtained before and dur-ing shock-loaddur-ing. Both tests displayed similar behavior, so for simplicity, the analysis is shown for test 16-1-002 only. As shown in Figure 2, with the addition on the ambi-ent frame, this single test shows the ambi-entire lifecycle of tita-nium including unloaded, shocked, and partially unloaded states.
The ambient frame exhibits many distinct spots, each corresponding to a strongly diffracting plane in a single
grain. Spots from many grains form characteristic rings with their centers on the beam center (at the left of the pat-tern), with each ring corresponding to a major plane. As each spot corresponds to a different grain orientation, this
indicates that there are on the order of tens or hundreds of grain orientations being sampled initially (before shock).
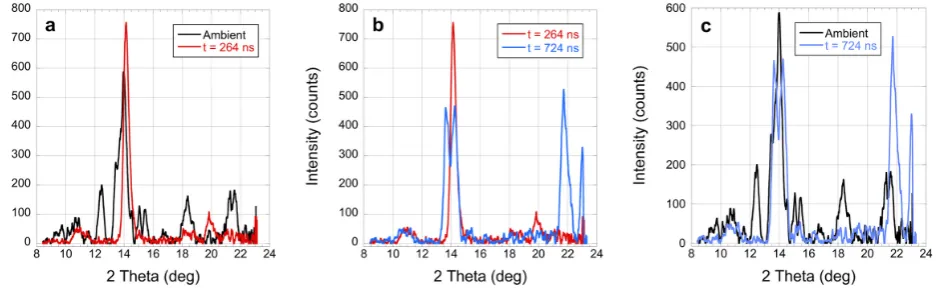
Line profiles showing integrated intensities of select frames are shown in Figure 4. For simplicity, each subfig-ure represents a comparison between two material states. The first image (Figure 4a) compares ambient and shocked states. The center image (Figure 4b) compares shocked
and partially released states. The third image (Figure 4c) compares the ambient and partially released states.
Several peaks are evident in the ambient curve, index-ing to α-Ti. Because the x-ray beam is not
monochro-matic, peaks appear with some thickness, and have a larger tail to one side. Pink beam synchrotron radiation has the benefit of offering a slightly wider range of conditions to
allow grains to diffract strongly and hence be captured by
the detector. With knowledge of the x-ray beam char-acter, the shape and location of diffraction peaks can be
simulated for comparison with experimentally measured peaks. For the present work, analysis was performed such that the peak maxima were coincident with expectations for the predominant beam energy (23 keV). The shape of the peaks was not used for further analysis. The observed d-spacings for the peak maxima are slightly shifted, indi-cating that some heating due to interaction with the x-ray beam has occurred. Rough estimates based on both in-situ annealing experiments and geometric attenuation of Ti in a similar setup as used here indicate a temperature rise on the order of 170 ◦C. This temperature is fairly low
rela-tive to the melting temperature of Ti, so it is expected to have only a small impact on the mechanical behavior. A new heat load chopper was added to subsequent tests at the beamline to reduce x-ray time-on-sample to eliminate beam heating in the future. For the present work, the effect
of temperature on d-spacing, assumed as a small, system-atic offset, was taken into account when identifying peaks.
During shock loading, an immediate refinement of the microstructure is seen. This manifests in Figure 3 as a change from distinct spots to smooth rings (denoted by arrows in Frame 1). Previous post-mortem analysis of shocked and recovered material confirms that each alpha grain becomes fragmented by the nucleation and growth of several variants of omega [7, 8]. As a result of this fragmentation, effective grain size is greatly reduced,
in-creasing the number of orientations being sampled into the thousands, leading to smoother diffraction rings. One ring,
in particular, is especially prominent in both the shocked XRD patterns and the line profile for t =264 ns. Upon
close inspection, this peak contains features beyond what is expected from diffraction from a single plane,
indicat-ing that multiple closely spaced planes, possibly from dif-ferent phases, are present in a single peak. Indexing of this ring indicates that this is consistent with both com-pressedα-Ti and newly formedω-Ti. The microstructure
required to generate this signal is also consistent with mi-crostructures from previously recovered samples. Due to the complexity of the experiments, the XRD patterns and resulting line profiles are not currently suitable for more detailed analysis, such as Rietveld refinement techniques used commonly in static diffraction studies [5]. Overall,
pattern intensity tends to decrease after impact as the beam is partially attenuated by the LiF impactor. This increases noise and suppresses weaker peaks, making it infeasible to determine phase fraction using standard line profile analy-sis. Additionally, several large, bright peaks are evident in Figure 3 during shock. These are diffraction peaks for the
omit-Fig. 3. X-ray diffraction patterns for high-purity titanium before and during shock loading. X-ray data was collected at the times indicated in Figure 2.
Fig. 4.XRD line profiles for test 16-1-002, showing comparisons between ambient, shocked, and partially unloaded states in titanium.
ted from analysis. Severalα-Ti peaks disappear after the initial shock, likely a result of the increased attenuation from the LiF impactor in conjunction with the short expo-sure time (recall that each image is formed using a single x-ray bunch). Even so, several stronger peaks are still vis-ible, and the overall pattern indexes as a two-phase,α–ω
microstructure.
It should be noted that this rapid microstructural change shown in Figure 3 is observed in the first frame af-ter loading. For the tests presented in this work, this occurs in frame 3 of test 16-1-003, which is not pictured here, but manifests as similar to the first shocked frame in Figure 3. After the initial large-scale changes in the diffraction
pat-terns, only subtle changes occur during the steady-state stress condition (shock state 2). Modest growth of omega-indexed peaks suggest that nucleation of omega phase hap-pens immediately after shock-loading, followed by small amounts of growth in the omega phase. This would re-sult in a very fragmented two-phase microstructure, lack-ing large, continuous, omega fragments that would be ex-pected from a growth-dominated process. Again, the re-sults of the present in-situ technique is consistent with pre-vious post-mortem microstructural characterization. The two techniques are complementary, and in-situ XRD is es-sential to observing the kinetics of theα–ωphase
transi-tion, which are impossible to infer from conventional test-ing and subsequent post-mortem microstructural charac-terization alone.
The final XRD pattern (t =724 ns) shows partial
re-lease (unloading) of the sample. The corresponding frame in Figure 3 (Frame 4) shows a bifurcation of the strongly
contrasting ring discussed earlier, shown by arrows. Two scenarios could contribute to this behavior. The first is that some of the omega-phase material reverts back to alpha phase on unloading. The new diffraction ring would
rep-resent a significant amount of newly formed alpha phase. No significant reversion was observed in similarly shock-loaded and recovered samples, however [6–8], so this sce-nario is unlikely to significantly contribute to the observed behavior. The second possibility is that the compressed al-pha peak is overlaid with the omega peak at that d-spacing, and shifts back to the uncompressed position while the omega peak remains the same. This scenario is supported by the previous post-mortem studies. The comparison be-tween ambient and partially unloaded states in Figure 4 shows some overlap of peaks between the initial and final states. It is challenging to fully correct for experimental factors, but analysis shows that the microstructure trans-forms from a single-phase, α-Ti material to a two-phase,
α–ωfinal microstructure as a result of shock-loading.
3.3 Selected Limitations of Technique
Fig. 3. X-ray diffraction patterns for high-purity titanium before and during shock loading. X-ray data was collected at the times indicated in Figure 2.
Fig. 4.XRD line profiles for test 16-1-002, showing comparisons between ambient, shocked, and partially unloaded states in titanium.
ted from analysis. Severalα-Ti peaks disappear after the initial shock, likely a result of the increased attenuation from the LiF impactor in conjunction with the short expo-sure time (recall that each image is formed using a single x-ray bunch). Even so, several stronger peaks are still vis-ible, and the overall pattern indexes as a two-phase,α–ω
microstructure.
It should be noted that this rapid microstructural change shown in Figure 3 is observed in the first frame af-ter loading. For the tests presented in this work, this occurs in frame 3 of test 16-1-003, which is not pictured here, but manifests as similar to the first shocked frame in Figure 3. After the initial large-scale changes in the diffraction
pat-terns, only subtle changes occur during the steady-state stress condition (shock state 2). Modest growth of omega-indexed peaks suggest that nucleation of omega phase hap-pens immediately after shock-loading, followed by small amounts of growth in the omega phase. This would re-sult in a very fragmented two-phase microstructure, lack-ing large, continuous, omega fragments that would be ex-pected from a growth-dominated process. Again, the re-sults of the present in-situ technique is consistent with pre-vious post-mortem microstructural characterization. The two techniques are complementary, and in-situ XRD is es-sential to observing the kinetics of theα–ωphase
transi-tion, which are impossible to infer from conventional test-ing and subsequent post-mortem microstructural charac-terization alone.
The final XRD pattern (t=724 ns) shows partial
re-lease (unloading) of the sample. The corresponding frame in Figure 3 (Frame 4) shows a bifurcation of the strongly
contrasting ring discussed earlier, shown by arrows. Two scenarios could contribute to this behavior. The first is that some of the omega-phase material reverts back to alpha phase on unloading. The new diffraction ring would
rep-resent a significant amount of newly formed alpha phase. No significant reversion was observed in similarly shock-loaded and recovered samples, however [6–8], so this sce-nario is unlikely to significantly contribute to the observed behavior. The second possibility is that the compressed al-pha peak is overlaid with the omega peak at that d-spacing, and shifts back to the uncompressed position while the omega peak remains the same. This scenario is supported by the previous post-mortem studies. The comparison be-tween ambient and partially unloaded states in Figure 4 shows some overlap of peaks between the initial and final states. It is challenging to fully correct for experimental factors, but analysis shows that the microstructure trans-forms from a single-phase, α-Ti material to a two-phase,
α–ωfinal microstructure as a result of shock-loading.
3.3 Selected Limitations of Technique
As an experimental technique, in-situ XRD coupled with shock loading is an important tool to measuring kinetics and material behavior during testing, but it is not without limitations. The experimental setup is necessarily com-plex and the technique requires precise coordination of powder gun and x-ray systems, each individually chal-lenging. Attenuation and absorption of x-rays by the tar-get material can sometimes restrict testing to small spec-imen thicknesses (on the order of 150 µm, much smaller
than conventional plate impact tests). The act of probing bulk behavior during a high-rate test requires one to sac-rifice some imaging quality. This adds noise to collected XRD patterns and introduces a continuously shifting ref-erence frame as the sample begins to move after impact. This technique is powerful, highly adaptable, and can po-tentially be applied to a wide array of materials science challenges, but may not be suitable for all materials and conditions. However, many of the previously stated issues can be (and have been) addressed through careful exper-imental planning, and advancement of light sources and techniques to achieve better imaging at short timescales. Furthermore, it is oftentimes helpful to include additional information via complementary conventional testing tech-niques (such as shock-recovery and microstructural char-acterization via electron microscopy or static diffraction)
to aid in the interpretation of XRD results.
4 Summary
Strongly textured polycrystalline titanium was tested using x-ray diffraction paired with plate-impact shock
loading with a powder gun. The resulting diffraction
patterns clearly show an evolution of the microstructure as a function of time. For the first time, transformation to omega phase under plate impact conditions was observed for a single sample in-situ, during testing. A two-part material response was observed that included a massive microstructural change immediately after impact, followed by a subtle small evolution attributed to growth of omega phase regions. During unloading, diffraction
peaks were observed to change positions. By comparing with previous post-mortem results, it was determined that this represents a decompression of the alpha lattice rather than a reverse transformation from omega to alpha. A small amount of heating due to the x-ray beam was noted, but this is not expected to have a large effect on material
behavior, and future studies will utilize additional controls to reduce beam heating. These in-situ data shed new light on post-mortem examinations of shocked material previously performed at LANL. The mechanical response is believed to involve a complex coupling of phase transformation and traditional plasticity mechanisms, and the kinetics of these mechanisms play a large role in the material behavior under extreme conditions. Overall, the results presented here are consistent with previous results, and add important information regarding transformation behavior and kinetics not previously available.
Work was funded by Science Campaign 2 at LANL. Los Alamos National Laboratory is operated by Los Alamos National Se-curity, LLC; for the National Nuclear Security Administration of the U.S. Department of Energy under contract
DE-AC52-06NA25396. This publication is based upon work performed at the Dynamic Compression Sector, which is operated by Wash-ington State University under the U.S. Department of Energy (DOE)/National Nuclear Security Administration award no. DE-NA0002442. This research used resources of the Advanced Pho-ton Source, a DOE Office of Science User Facility operated for the DOE Office of Science by Argonne National Laboratory un-der contract no. DE-AC02-06CH11357. LA-UR-18-21524.
References
1. S.G. Song, G.T. Gray, III, Philosophical Magazine, Part A71, 275 (1995)
2. R.G. Hennig, D.R. Trinkle, J. Bouchet, S.G. Srini-vasan, R.C. Albers, J.W. Wilkins, Nature Materials4, 129 (2005)
3. P.A. Rigg, C.W. Greeff, M.D. Knudson, G.T. Gray,
R.S. Hixson, Journal of Applied Physics106, 123532 (2009)
4. E.K. Cerreta, J.P. Escobedo, P.A. Rigg, C.P. Trujillo, D.W. Brown, T.A. Sisneros, B. Clausen, M.F. Lopez, T. Lookman, C.A. Bronkhorst et al., Acta Materialia
61, 7712 (2013)
5. D.W. Brown, J.D. Almer, L. Balogh, E.K. Cerreta, B. Clausen, J.P. Escobedo-Diaz, T.A. Sisneros, P.L. Mosbrucker, E.F. Tulk, S.C. Vogel, Acta Materialia
67, 383 (2014)
6. B.M. Morrow, P.A. Rigg, D.R. Jones, F.L. Addessio, C.P. Trujillo, R.A. Saavedra, D.T. Martinez, E.K. Cer-reta, Journal of Dynamic Behavior of Materials3, 526 (2017)
7. D.R. Jones, B.M. Morrow, C.P. Trujillo, G.T. Gray, III, E.K. Cerreta, Journal of Applied Physics 122, 045902 (2017)
8. B.M. Morrow, J.P. Escobedo, R.D. Field, R.M. Dick-erson, P.O. DickDick-erson, C.P. Trujillo, E.K. Cerreta, AIP Conference Proceedings1793, 100033 (2017) 9. E.K. Cerreta, F.L. Addessio, C.A. Bronkhorst, D.R.
Jones, T. Lookman, D.T. Martinez, B.M. Morrow, P.A. Rigg, C.P. Trujillo, Path Dependency of Phase Transformations, inAIP Conference Proceedings (in press)(2018)
10. S.N. Luo, B.J. Jensen, D.E. Hooks, K. Fezzaa, K.J. Ramos, J.D. Yeager, K. Kwiatkowski, T. Shimada, Review of Scientific Instruments83, 073903 (2012) 11. N. Sinclair, Y. Wang, S. Turneaure, K. Zimmerman,
Y. Toyoda, Y. Gupta,The Multi-Frame X-ray Diff rac-tion and Imaging Detector at the Dynamic Compres-sion Sector, inAIP Conference Proceedings (in press)
(2018)

![Table 1. Chemical composition of as-received titanium plate, in ppm [7].](https://thumb-us.123doks.com/thumbv2/123dok_us/8040363.1338651/3.595.57.287.73.291/table-chemical-composition-received-titanium-plate-ppm.webp)