BIOREMEDIATION OF CADMIUM(II) FROM AQUEOUS
SOLUTION USING AGRICULTURAL WASTE: ZEA MAIZE
LEAVES
Uzma Nadeem
Keywords: Bioremediation; Cadmium (II); Agricultural wastes; Adsorption isotherms; FT-IR; Wastewater
In the present study, agricultural waste Zea maize leaves powder (MLP) was used for the removal of cadmium (II) from the aqueous solutions. The adsorption characteristics of maize leaf as a function of pH (2-7), adsorbent dose (0.2-0.5 g), temperature (20-30oC), contact
time (0-120 min) and initial metal concentration (1-15 mg L-1) were studied. The biosorption of cadmium (II) on MLP was dependent on
pH, adsorbent dose, temperature, contact time and initial metal concentration .The experimental results were analyzed in terms of Langmuir and Freundlich isotherm models. The Fourier Transform Infrared (FTIR) measurements reveal that the presence of hydroxyl, amino and carboxylic functional groups on the surface of MLP which provide the major biosorption sites for the metal binding. The results obtained could be useful for the application of agricultural wastes for heavy metal removal from the industrial waste water.
Corresponding Authors
Tel.: (+91) (011) 9711870215 E-Mail: [email protected]
[a] Chemistry Department, University of Delhi, Delhi, 110007, India.
Introduction
Many toxic heavy metals have been discharged into the environment as industrial wastes, causing serious soil and water pollution. Heavy metals are those metallic elements which have their atomic weight more than 20 or in other words, with a density higher than 5 g /cm3. Based on their
solubility under physiological conditions, 17 heavy metals may be available for living cells and are of importance for organism and ecosystem.1
Elevated concentration of metals can result in the growth inhibition and toxicity symptoms.2 Cadmium metal is toxic
for the human health, because it accumulates in the body with a half life exceeding 10 years. Cadmium is used in batteries, electronics devices and the main health problems that have been attributed to cadmium are renal tubular dysfunction,3 pulmonary emphysema,4 possibly
osteoporosis,5 and hypertension.6
Moreover contamination of ground water is today a major concern for the management of water resources.7 A number
of treatment processes for heavy metal removal from the waste water include precipitation, ion-exchange, membrane filtration and co-precipitation. Studies on the treatment of effluent bearing heavy metal have revealed that adsorption is a highly effective technique for the removal of heavy metals from wastewater and the activated carbon has been widely used as an adsorbent for heavy metal removal.8 But
this technique apart from being economically expensive9 and have disadvantages, like incomplete metal removal, high reagent and energy requirements and generation of toxic sludge or their waste products that require safe disposal. Efficient and environment friendly methods are thus needed to be developed to reduce heavy metals. In this aspect biosorption is a versatile and is also simple process used for removal of contaminants from industrial effluents.
This process is particularly suitable for the treatment of waste water containing heavy metal uptake ability through a batch reaction process. Naturally occurring biodegradable products that have good adsorbent properties and low cost and are abundantly available in nature that’s why biosorption has distinct advantages over conventional methods. A range of products has been examined for metal removal from aqueous solutions; these include peanut skin,10
waste tea leaves,11 walnut skin, coconut fiber,12 polymerized
corn cob,13 banana pith,14 pillared clay,15 goat hair,16 rice
husk,17,18 coconut husk,19 nut shells,20 cork,21 Yohimbe bark
wastes,22 petiolar felt sheath of palm,23 leaves of the
indigenous biomaterials Tridex procumbens24, cactus, olive
stone/cake, wool, charcoal and pine needles25 and sphagnum
moss peat26 have been reported in the literature.
In the present work Zea mays leaves were used as a bioadsorbent to study the efficiency of maize leaf in removal of heavy metal cadmium (II). The influence of pH, adsorbent dose, temperature, contact time, and initial metal concentration on the biosorption of metal ions were studied. The biosorption equilibrium data were compared to the Langmuir and Fruendlich adsorption isotherm models.
Experimental
Adsorbent preparation
The Zea mays leaves used in this study was harvested
from the agricultural farm in the Kaushambi, near by 60-70 km away from Allahabad. The leaves were washed several times with deionized water and left to dry. Grounded by using a food processor (USHA, LEXUS, MG-1553, India) and powdered leaves were screened through sieve of 100 mesh to obtain a fine fiber and then stored in air tight container.
Reagents
Analytical grade of CdCl2 (Qualigens) was used for the
concentration for the adsorption experiments were prepared by serial dilution. The initial pH of the solution was adjusted by using either 0.1 N NaOH or 0.1 N H2SO4.
Activation of adsorbent
Activation of adsorbent was done by the method given in literature.27 The screened leaves powder was soaked in
excess of 0.3 M HNO3 solution for 24 h. It was then filtered
through a whatman no.41 filter paper and rinsed with deionised water. The adsorbent was later air dried for 12 h. The treatment of the adsorbent with 0.3 M HNO3 solution
aids the removal of any debris or soluble biomolecules that might interact with metal ions during sorption. This process is called chemical activation of the maize leaves.
Batch adsorption experiments
Batch experiments with maize leaves powder (MLP) were conducted to investigate using a certain amount of adsorbent and 50 mL solution of Cadmium (II) ion solution in a conical flasks. The mixture was shaken in an orbital shaker (Shivam, ISO, 900/2000) at 120 rpm at 30oC for 24 h. The
following operation conditions such as biosorbent dose, pH, contact time and metal concentration were investigated. Then the solution was centrifuged and the residual concentration of Cadmium (II) ion in supernatant was determined by atomic absorption spectrophotometer (AAS, ECIL-4141, Hyderabad).
For the determination of optimum dose of biosorbent for the metal removal, 0.5 g MLP were mixed with 50 mL Cadmium(II) ion solution at concentration of 15 mg L-1 .The
mixture was shaken in an orbital shaker at 120 rpm at 30oC.
The supernatant was analyzed for residual metal concentration after the contact period.
The effect of pH on the biosorption of Cadmium (II) by MLP was determined at pH values of 2, 3, 4, 5, 6, and 7. For the adsorption 0.5 g of MLP was added to 50 mL solution of Cadmium (II) ion (at 15 mg L-1) in seven different flasks at
pH ranging from 2-7. The mixture was shaken in an orbital shaker at 120 rpm at 30oC for 24 h. The supernatant was
analyzed for residual cadmium after the contact period.
For the determination of rate of the metal biosorption by MLP (0.5 g) were mixed with 50 mL Cadmium (II) ion solution at concentration of 15 mg L-1, The mixture was
shaken in an orbital shaker at 120 rpm at 30oC. The
supernatant was analyzed for residual metal concentration after the contact period of 0, 5, 10, 20, 25, 30, 40, 60, 80, 100, and 120 minutes.
Studies were conducted for the determination of effect of temperature (20, 25 and 30 oC ) on metal sorption 0.5 g of
MLP were mixed with 50 mL Cadmium (II) ion solution at concentration of 15 mg L-1, The mixture was shaken in an
orbital shaker at 120 rpm at different temperature for 24 h. The supernatant was analyzed for residual metal concentration after the contact period.
In order to investigate the effect of different initial metal concentration on the uptake of cadmium (II) from aqueous solution, 0.5 g MLP were mixed with 50 mL cadmium (II)
solution at concentration of 1, 3, 5, 7, 9, 11, 13 and 15 mg L-1. The mixture was shaken in an orbital shaker at 120 rpm
at 30oC for 24 h. The supernatant was analyzed for residual
metal concentration after the contact period.
Data Analysis
The percent removal (R) of selected metal ion by MLP was calculated by using the Eqn. 1
where R is the removal, Ci is the initial metal concentration
and Cf is the final metal concentration of the metal ion in mg
L-1.
The sorption capacity was calculated from Eqn. 2
where, Qe is the adsorption capacity (mg g-1), Ci is the initial
metal concentration (mg L-1), C
e is the equilibrium
concentration of metal (mg L-1), W is the adsorbent dose (g)
and V is the solution volume (mL).
Fourier Transform Infrared Spectroscopy
FT-IR spectroscopy was used to determine the vibration frequency groups in the adsorbent .The spectra was collected using a model (ABB, Canada; FTLA; 2000,) with in the wave-number range 500-4000 cm-1. Specimens of
adsorbents were first mixed with KBr and then grounded in an agate mortar (Merck,) at an approximate ratio of 1/100 for the preparation of pellets .The resulting mixture was pressed at 10 tons for 5 min. These pellets are used in the recording of spectra.
Results and Discussion
Effect of pH
It was observed that with the rise in the initial pH, cadmium uptake increased as shown in Figure 1. Roy et al., have also observed that the adsorption capacity increases with increasing pH values.28
pH is an important environmental factor that affect not only dissociation of the acidic or basic groups on the adsorbent surface, but also the speciation state of the heavy metals in the bulk solution and so strongly influence the sorption capability of the heavy metals.29 At low pH, (3)
there was an excessive protonation of active sites at adsorbent surface and this often refuses the formation of links between metal ion and active site.
( i e)
(2) e
1000 V C C Q
W
i f
i
100 (1)
C C
R C
Figure 1. Effect of pH on Cadmium (II) removal using MLP
At moderate pH (3-6) linked H+ is released from the active
sites and adsorbed amounts of metal ion is generally found to increase. At higher pH (>6) the precipitation is dominant or both ion exchange and aqueous metal hydroxide formation may become significant mechanisms in the removal of metal. Following the appearance of the negatively charged groups (e.g., hydroxyl, carboxyl etc.) at the adsorbent surface, there was an increase in cadmium biosorption capacity with the increase in pH from 3-6. The adsorption capacities of MLP for cadmium at pH 2, 3, 4, 5, 6, and 7 were 0.54, 0.93, 1.14, 1.34, 1.44 and 1.33 mg g-1 of
biomass respectively. At pH 6 the maximum equilibrium capacity was observed.
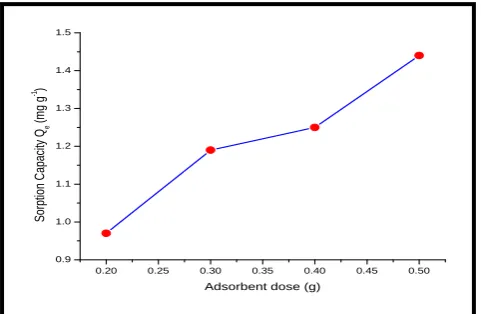
Effect of adsorbent dose
The effect of adsorbent dose on the adsorption of cadmium is shown in Figure 2 at pH 6.
Figure 2. Effect of adsorbent dose on Cadmium (II) removal using MLP
The amount of adsorbent from 0.2-0.5 g employed was found to influence the efficiency of the adsorption process. The biosorption capacity of cadmium (II) was increased on increasing the biosorbent dose in 50 mL cadmium (II) solution. The adsorbent dose of 0.5 g was able to absorb 95.9 % from 50 mL of 15 mgL-1 of cadmium (II) solution.
The adsorption capacities for different adsorbent dose of MLP were; 0.2, 0.3, 0.4 and 0.5 were 0.97, 1.19, 1.25 and 1.44 mg g-1 of biomass respectively. The optimum dose of
the MLP was 0.5 g for cadmium (II) biosorption.
The adsorption of metal ions on the agricultural by-products may involve metal interaction30 and co-ordination
to functional groups present in natural proteins, lipid and carbohydrates positioned on the cell-wall.31
Effect of temperature
The effect of temperature on the biosorption capacity of the cadmium (II) by the MLP is shown in Figure 3, which shows that adsorption capacity was slightly increased on increasing temperature from 20-30 oC. The adsorption
capacities at different temperature 20, 25 and 30 oC were
1.07, 1.41 and 1.43 mg g-1 of biomass respectively. The
adsorption of cadmium (II) ion may involves chemical bond formation and ion-exchange since the temperature is the main parameter affecting the above two process.32
Figure 3. Effect of Temperature on Cadmium (II) removal using MLP
Effect of contact time
The effect of contact time on the adsorption of cadmium(II) ion is shown in Figure 4. The results indicated that the metal uptake was increased on increase in the contact time but remained constant after an equilibrium time. The uptake of cadmium was rapid and the equilibrium was attained in 40 min. of contact between the biosorbent and metal solution.
The adsorption capacities of MLP for cadmium (II) at different contact time 0, 5, 10, 20, 25, 30 and 40 were 0.18, 0.39, 0.83, 0.96, 1.20 and 1.48 mg g-1 respectively.
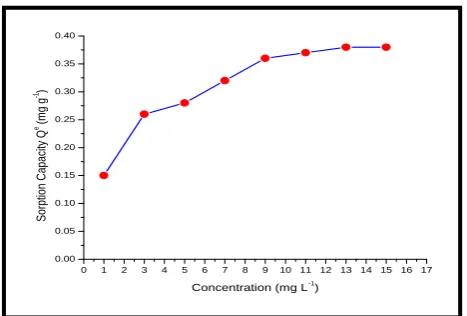
Effect of initial metal concentration
The adsorption capacities of cadmium (II) for MLP with different initial metal concentration are shown in Figure 5. The adsorption capacities increased with increase in the initial metal concentration .This is in agreement with the results obtained by Dimitrova et al,. 33
The adsorption capacities of MLP for different initial concentration of cadmium (II) -1, 3, 5, 7, 9, 11, 13 and 15mg L-1 were 0.15, 0.26, 0.28, 0.32, 0.36, 0.37, 0.38 and
0.43 mg g-1 of biomass respectively.
In general the data indicates that the sorption capacity of the biomass was increased with the increase in initial metal
2 3 4 5 6 7
0.4 0.6 0.8 1.0 1.2 1.4 1.6
So
rp
tio
n
C
ap
aci
ty
Qe
(m
g
g
-1)
pH
0.20 0.25 0.30 0.35 0.40 0.45 0.50 0.9
1.0 1.1 1.2 1.3 1.4 1.5
So
rp
tio
n
C
ap
aci
ty
Qe
(m
g
g
-1 )
Adsorbent dose (g)
20 22 24 26 28 30
1.37 1.38 1.39 1.40 1.41 1.42 1.43
So
rp
tio
n
C
ap
aci
ty
Qe
(m
g
g
-1)
Temperature (o
concentration. The sorption characteristics indicate that surface saturation is dependent on the initial metal ion concentrations. At low concentration adsorption sites took up the available metal more quickly. However, at higher concentration metal needs to diffuse to the biomass surface by the intraparticle diffusion and greatly hydrolyzed ions will diffuse at the slower rate.
Figure 4. Effect of contact time on Cadmium (II) removal using MLP
Figure 5. Effect of initial metal concentration on Cadmium (II) removal using MLP
Since, the adsorption isotherm is important to describe how adsorbents will interact with adsorbents and so is critical for design purpose, therefore, data using an equation is essential adsorption operation.34
Adsorption models
Adsorption of cadmium (II) on MLP was studied in the concentration range 1-15 mg L-1 with 0.5 g of adsorbent.
The adsorption data were applied to the Langmuir and Freundlich isotherm models. The isotherm constants of Langmuir and Fruendlich were calculated using normal linearization method.
Langmuir model
The basic assumption of Langmuir adsorption is based on monolayer coverage of the adsorbate on the surface of the adsorbent.35,36 The Langmuir adsorption model is applicable
for electrostatic sorption and chemisorptions reaction (mono-layer model). The number of surface sites available
for sorption is limited and must be specified at the outset.37
The linearised form of isotherm is given in Eqn. 3.
where, Ce is the metal concentration in the solution at
equilibrium(mg L-1), Q
max is the maximum amount of metal
adsorbed per unit weight of biomass and b is a binding stability constant which is temperature dependent and related to the heat of sorption.38
The capacity of Zea mays leaves biomass in binding with cadmium was determined by plotting Ce/Qe against Ce, using
the Langmuir equation. The plot of the specific sorption
Ce/Qe against equilibrium concentration Ce gave the linear
isotherm parameters Qmax, b and the coefficient of
determination (R2).
The R2 value suggests that the Langmuir isotherm
provides a good model of the sorption system. The sorption capacity, Qmax which is a measure of maximum adsorption
capacity corresponding to complete monolayer coverage showed that MLP had a mass capacity for cadmium (II) 0.4372 mg g-1. The adsorption coefficient bwhich is related
to the apparent energy of adsorption cadmium was 0.98 L mg-1.
Figure 6. The linearized Langmuir adsorption isotherm of Cadmium (II) using MLP
The plots of Ce/Qe against Ce for adsorption of cadmium
gave a straight line are shown in Figure 6. It has seen that the linear fit is fairly good and enables the applicability of the Langmuir model to the cadmium (II) adsorption on the maize leaf powder.
The essential characteristics of the Langmuir isotherm can be expressed in terms of a dimensionless constant separation factor or equilibrium parameter, RL, which is defined as 39:
0 20 40 60 80 100 120
0.0 0.2 0.4 0.6 0.8 1.0 1.2 1.4 1.6
Sorp
tio
n
C
ap
aci
ty
Q
e
(m
g
g
-1 )
Contact Time (min.)
0 1 2 3 4 5 6 7 8 9 10 11 12 13 14 15 16 17 0.00
0.05 0.10 0.15 0.20 0.25 0.30 0.35 0.40
Sorp
tio
n
C
ap
aci
ty
Q
e (m
g
g
-1)
Concentration (mg L-1
)
0 2 4 6 8 10 12
0 5 10 15 20 25
Ce /Qe
Ce 1
e e (3)
e max max
C C
Q Q b Q
1
(4)
L 1
0 R
bC
where, b is the Langmuir constant Co is the initial metal concentration of cadmium. The RL values indicate the shape of isotherm as shown in Table 1.
Table 1: Relationship between RL and type of isotherm
RL Type of isotherm
RL > 1
RL = 1
RL < 1
RL = 0
Unfavourable Linear Favourable Irreversible
The RL values between 0 and 1 indicate favorable
adsorption.40 In the present study the R
L were found to be
0.70, 0.23, 0.14, 0.10, 0.08, 0.06, 0.05 and 0.04 as shown in Figure 7, for the initial concentration of cadmium (II) of 1-15 mg L-1 indicating that the adsorption of cadmium (II) is
favorable.
Figure 7. Plot of RL vs initial Cadmium (II) concentration
Freundlich model
In contrast to the Langmuir monolayer model, the Freundlich isotherm is a consecutive layer model (unlimited sorption sites) and is for describing physical adsorption.41
It’s linearised form is represented by Equation 5.
where, Ce is the equilibrium concentration (mg L-1), Qe is
the amount adsorbed (mg g-1) K is adsorption capacity and n
is adsorption intensity. A plot of log Qe versus log Ce gives a
straight line of slopen and intercept Kis shown in Figure 8.
Figure 8. The linearized Freundlich adsorption isotherm of cadmium (II) using MLP
The values of both Langmuir and Freundlich adsorption parameters are given in table 2. Examination of data suggests that Langmuir and Freundlich isotherms are good model for the sorption of cadmium (II). In case of Freundlich isotherm model the values of n that vary between 1 and 10 indicate the favorable adsorption of heavy metals.42
Table 2. Langmuir and Freundlich adsorption parameters for the adsorption of Cadmium (II) ions at 30 oC.
Langmuir Parameters Freundlich Parameters
Qmax, mg g-1 0.4372 K 0.2825
b, L mg-1 0.98 n 7.5038
R2 0.9714 R2 0.7991
It was found that the adsorption equilibrium data was better fitted by the Langmuir isotherm, although it can also be modeled by the Freundlich isotherm in the concentration range studied since it presented the greater coefficient of correlation. The values of correlation coefficient generated by linear regression on isotherm data were in accordance with literature.43
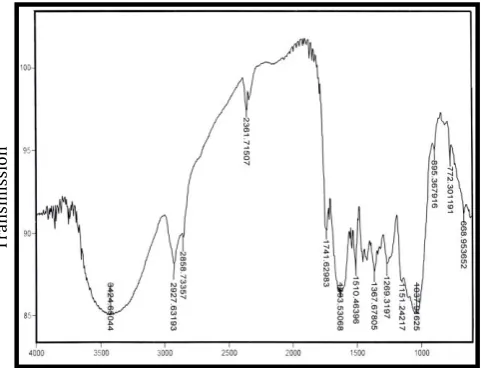
Fourier Transform Infrared Analysis
The Infrared spectra of the MLP are shown in Figure 9, reveals the functional groups that are responsible for binding the heavy metal ion.
Figure 9. FTIR Spectra of Maize Leaf Powder
Table 3 gives the wave number with the corresponding groups. The band at 3424.65 cm-1 represent pendent –OH
and -NH groups in the MLP .Carboxyl ate exhibits dual bands at 1741.62 cm-1 and 1633.53 cm-1.
Table 3. Infrared absorption bands and their corresponding groups of MLP
Wave numbers, cm-1 Functional groups
3424.65 2927.63 1510.46 1741.62 1633.53 1367.67 895.36 1037.91
-OH, -NH -CH -CH C=O C=O, -COO -CH -CH -C-O,C-N -0.6 -0.4 -0.2 0.0 0.2 0.4 0.6 0.8 1.0 1.2
-0.60 -0.55 -0.50 -0.45 -0.40 -0.35
Lo
g
Qe
Log Ce
T
ra
nsm
iss
io
n
1
lgQe lgK lgCe (5)
n
0 2 4 6 8 10 12 14 16
0.0 0.1 0.2 0.3 0.4 0.5 0.6 0.7 0.8
RL
Concentration (mg L-1
The FT-IR analysis shows the coordination of metals with functional groups present in the MLP. The amino and carboxyl functional groups provide the major biosorption sites for the metal binding (e.g., calcium and cadmium). Other functional groups, such as ether and alcoholic do not have important roles in metal uptake.
Conclusions
The study reveals that maize (Zea mays) leaves powder, an agricultural waste available in plenty at low cost is efficient in the removal of cadmium. In batch mode studies adsorption was dependent on pH, adsorbent dose, temperature, contact time and initial metal concentration. Adsorption followed both Langmuir and Freundlich models. The Zea mays biomatrix indicates the presence of several – OH and –COOH groups in the lignocelluloses moieties. Hydrogen of these groups is capable of ion-exchange with metal cation. This biosorbent is low cost; its utility will be economical and can be viewed as a part of a feasible waste management strategy.
Acknowledgements
The authors are thankful for the financial assistance received from the University Grants Commission (UGC).
References
1Dara, S. S., A Textbook of Environmental Chemistry and Pollution
Control., Sixth eds., S.Chand & Company Ltd., New Delhi. 2004.
2Akinola, M. O. and Ekiyoyo, T. A., J. Environ. Biol., 2006, 27,
597-599.
3Buchet, J. P., Lauwerys, R., Roels, H., Bernard, A., Bruaux, P.,
Claeys, F., Ducoffre, G., De Plaen, P., Staessen, J., Amery, A., Lijnen, P., Thijs, L., Rondia, D., Sater, F., Saint Remy, A., Nick, L., Lancet, 1990, 336, 699-702.
4Ryan, J. A., Pahren, H. R., Lucas, J. B., Environ. Res., 1982, 28,
251-302.
5Bhattacharya, B. D., Whelton, M. H., Stern, P. H., Peterson, D. P.,
Proc. Nat. Acad. Sci. USA, 1988, 85, 8761-8765.
6Klassen, C. D., The Pharmacological Basis of Therapeutic, 7th
ed; In A. G. Gilman, L. S., Goodman, T. W. Rall and F. Marad, Eds.,Mc Millan, New York,1985, Section XVII, 69.
7Weber, W. J., McGinley, P., Katz, L., Water Research, 1991, 25,
499-528.
8Chand, S., Agarwal, V. K., Kumar, P., Indian J. Environ. Health,
1994, 36, 151-158.
9Huang, C. P. and Wu, M. U., J. Water Pollut. Control Fed., 1975,
47, 2437-2445.
10Randell, J. M., Reuter, F. C., Waiss, A. C., J. Appl. Polym. Sci.,
1974, 19, 156-171.
11Tee, T. W., Khan, R. A. M., Environ. Technol. Lett., 1988, 9,
1123-1232.
12Espinola, A., Adiamian, R., Gomes, L. M. B.,Waste Treat. Clean
Technol. Proc., 1999, 3, 2057-2066.
13Odozi, O., Okeke, S., Carty, R. B., Agric. Wastes, 1985, 12,
13-21.
14Low, K. S., Lee, C. K., Leo, A. C., Bioresource Technol., 1995,
51, 227-231.
15Vinod, V. P. and Anirudhan, T. S., J. Chem. Technol. Biotechnol.,
2001, 77, 92-101.
16Barbarinde, N. A. A., J. Pure. Appl. Sci., 2002, 5, 81-85. 17Srinivasan, K., Balasubramanium, N., Ramakrishna, T. V., Indian
J. Environ. Health, 1998, 30, 376-387.
18Munaf, E. and Zein, R.;Environ. Technol., 1997, 18, 359-362. 19Tan, W. T., Ooi, S. T., Lee, C. K., Environ. Technol., 1993, 14,
277-282.
20Demirbas, E., Adsorpt. Sci. Technol., 2003, 21, 951-963. 21Villaescusa, I., Martinez, M., Miralles, N., J. Chem. Technol.
Biotechnol., 2000, 74, 812-816.
22Lee, M. Y., Hong, K. J., Ya, Y. S., Kajiuchi, T. N., J. Appl.
Polym. Sci., 2005, 96, 44-50.
23Iqbal, M., Saeed, A., Akhtar, N., Bioresour. Technol., 2002, 81,
153-155.
24Singanan, M., Vinodhini, S., Alemayenu, A., Indian J. Environ.
Protect., 2006, 26, 385-391.
25Dakiky, M., Khamis, M., Manassra, A., Mereb, M., Adv. Environ.
Res., 2002, 6, 533-540.
26Sharma, D. C., Froster, C. F., Water Res., 1993, 27, 1201-1208. 27Abia, A. A. and Asuquo, E. D., African J. Biotechnol., 2006, 5,
1475-1482.
28Roy, D., Greenlaw, P. N. C., Shane, B. S., J. Env. Sci. Health.,
1993, A28, 37-50.
29Sheng, P. X., Ting, Y. P., Chen, J. P., Hong, L., J. Colloid.
Interface Sci., 2004, 275, 131-141.
30Kumar, U., J. Sci. Res. Essay., 2006, 1, 033-037.
31Drake, L. R., Lin, S., Rayson, G. D., Jackson, P. K., Environ. Sci.
Technol., 1996, 30, 110-114.
32Yubin, T., Fangyan, C., Honglin, Z., Adsorp. Sci. Technol., 1998,
16, 595-606.
33Dimitrova, S. V. and Mehandgiev, D. R., Water Res.,1998, 32,
3289-3292.
34Hashem, M. A. and Abdelmonem, R. M., Farrag, T. E.,
Alexandria Eng. J., 2007, 1, 1-9.
35Singh, K. K., Singh, A. K., Hasan, S. H., Biores. Technol., 2006,
97, 994-1001.
36Nadeem, M., Mahmood, A., Shahid, S. A., Shah, K. A. M.;
McKay, G., J. Hazard. Mater., 2006, B138, 604-613.
37Langmuir, I., J. Am. Chem. Soc., 1918, 40, 1361-1403.
38Faust, S. D.; Aly, O. M.; Adsorption Process for Water
Treatment, Butterworth, London, 1987.
39Hall, K. R.; Eagleton, I. C.; Acrivos, A.; Vermeulen, T.; Ind. Eng.
Chem. Fund. , 1966, 5, 212-219.
40Ahalya, N.; Kanamadi, R. D.; Ramachandra, T.V.; Indian Jour.
Chem. Technol., 2006, 13, 122-127.
41Freundlich, H., Z. Physik. Chem., 1907, 57, 385-470.
42Kadirvelu K. and Namasivayam, C.; Environment. Technol.,
2000, 21, 1091-1097.
43Allen, J. S. and Brown, P. A.; J. Chem. Technol. Biotechnol.,
1995, 62, 17-24.