TM
Enrollment and Degrees in Professional
Science Master’s (PSM) Programs: 2013
i
Enrollment and Degrees in Professional Science Master’s (PSM) Programs: 2013
Jeffrey R. Allum
Director, Research and Policy Analysis Council of Graduate Schools
ii The 2013 Professional Science Master’s Enrollment and Degrees Survey was conducted by the Council of Graduate Schools with a grant from the Alfred P. Sloan Foundation. The survey is designed to provide information about applications to Professional Science Master’s (PSM)
programs, enrollment in these programs, and degrees awarded. A PDF version of this survey report is available online at www.cgsnet.org and www.sciencemasters.com. For more information about the survey or the survey report, please contact:
Council of Graduate Schools
One Dupont Circle NW, Suite 230 Washington, DC 20036‐1173 www.cgsnet.org
Jeffrey R. Allum (202) 223‐3791 [email protected]
Suggested citation:
Allum, J.R. (2014). Enrollment and Degrees in Professional Science Master’s (PSM) Programs: 2013. Washington, DC: Council of Graduate Schools.
Copyright © 2014 Council of Graduate Schools, Washington, DC
ALL RIGHTS RESERVED. No part of this work covered by the copyright herein may be reproduced or used in any form by any means—graphic, electronic, or mechanical, including photocopying,
recording, taping, web distribution, or information storage and retrieval systems—without the prior written permission of the Council of Graduate Schools, One Dupont Circle, NW, Suite 230,
Washington, DC 20036‐1173.
iii Table of Contents
List of Figures... iv
Acknowledgments ... vi
Executive Summary ... vii
Introduction ... 10
RESEARCH DESIGN ... 10
DATA COLLECTION ... 10
DATA ANALYSIS ... 11
LIMITATIONS ... 12
Findings ... 13
CHARACTERISTICS OF SURVEY RESPONDENTS ... 13
APPLICATIONS RECEIVED ... 14
APPLICATIONS ACCEPTED ... 15
FIRST‐TIME ENROLLMENT ... 17
Yield Rates... 18
First‐Time Enrollment by Institutional Control ... 19
First‐Time Enrollment by Carnegie Classification ... 20
First‐Time Enrollment by Field of Study ... 20
TOTAL ENROLLMENT ... 22
Total Enrollment by Institutional Control ... 23
Total Enrollment by Carnegie Classification ... 23
Total Enrollment by Field of Study ... 24
DEGREES ... 27
Degrees by Institutional Control ... 27
Degrees by Carnegie Classification ... 28
Degrees by Field of Study ... 28
Changes from 2010 to 2013 ... 30
Applications ... 30
First‐Time Enrollment ... 31
Total Enrollment ... 32
Degrees ... 34
References ... 36
Appendix: Survey Questionnaire ... 37
iv List of Figures
Figure 1. Distribution of PSM Programs by Field of Study, Fall 2013 ... 14
Figure 2. Applications Received by PSM Programs by Institutional Control and Carnegie
Classification, Fall 2013 ... 14
Figure 3. Applications Received by PSM Programs by Field of Study, Fall 2013 ... 15
Figure 4. Applications Accepted by PSM Programs by Institutional Control and Carnegie
Classification, Fall 2013 ... 16
Figure 5. Applications Accepted by PSM Programs by Field of Study, Fall 2013 ... 16
Figure 6. Acceptance Rates in PSM Programs by Field of Study, Fall 2013 ... 17
Figure 7. Characteristics of First‐Time Enrollees in PSM Programs, Fall 2013 ... 18
Figure 8. Yield Rates in PSM Programs by Field of Study, Fall 2013 ... 19
Figure 9. First‐Time Enrollment in PSM Programs by Field of Study, Fall 2013 ... 21
Figure 10. First‐Time Enrollment in PSM Programs by Field of Study and Gender, Fall 2013 ... 21
Figure 11. First‐Time Enrollment in PSM Programs by Field of Study and
Race/Ethnicity, Fall 2013 ... 22
Figure 12. Characteristics of Total Enrollees in PSM Programs, Fall 2013 ... 23
Figure 13. Total Enrollment in PSM Programs by Carnegie Classification and
Race/Ethnicity, Fall 2013 ... 24
Figure 14. Total Enrollment in PSM Programs by Field of Study, Fall 2013 ... 25
Figure 15. Total Enrollment in PSM Programs by Field of Study and Gender, Fall 2013 ... 26
Figure 16. Total Enrollment in PSM Programs by Field of Study and Race/Ethnicity, Fall 2013 ... 26
Figure 17. Characteristics of PSM Degrees Awarded, 2012/13 ... 27
Figure 18. PSM Degrees Awarded by Carnegie Classification and Race/Ethnicity, 2012/13 ... 28
Figure 19. PSM Degrees Awarded by Field of Study, 2012/13 ... 29
v
Figure 21. Change in Applications Received and Applications Accepted, Fall 2010 to Fall 2013 ... 31
Figure 22. First‐Time Enrollment by Enrollment Status and Gender, Fall 2010 to Fall 2013 ... 31
Figure 23. First‐Time Enrollment by Citizenship and Race/Ethnicity, Fall 2010 to Fall 2013 ... 32
Figure 24. Total Enrollment by Enrollment Status and Gender, Fall 2010 to Fall 2013 ... 33
Figure 25. Total Enrollment by Citizenship and Race/Ethnicity, Fall 2010 to Fall 2013 ... 33
Figure 26. Degrees Awarded by Gender, 2009/10 to 2012/13 ... 34
Figure 27. Degrees Awarded Among by Citizenship and Race/Ethnicity, 2009/10 to 2012/13 ... 35
vi Acknowledgments
The 2013 Professional Science Master’s Enrollment and Degrees Survey would not have been
possible without the efforts of a number of individuals and organizations, most notably the Alfred P. Sloan Foundation, which continue to support innovations in graduate education. Michael
Teitelbaum and Elizabeth Boylan deserve special recognition for their leadership.
We also wish to thank the graduate deans at CGS’ member institutions for encouraging Professional Science Master’s (PSM) program directors to complete the survey. The leadership of the National Professional Science Master’s Association (NPSMA) has been an ongoing source of support for the PSM initiative as well.
We want to thank the members of the CGS staff who played important roles in the composition of this report. Thank you to Jeannette Remington for her efforts in managing the data collection phase of this project, and to Bob Sowell for his leadership and careful review of this report. Nate
Thompson was also responsible for the design of this report cover, and we thank him for that contribution. We also would like to thank Jim Sterling and Lindsay Janssen of the Keck Graduate Institute for their ongoing support of this survey.
Finally, and most importantly, this report would not be possible without the PSM coordinators, program directors, and staff at the 302 programs in 134 institutions who participated in this survey. We are grateful for your efforts in providing data in a timely manner, and we hope that this report supports the growth and success of your PSM programs.
vii Executive Summary
The 2013 Professional Science Master’s Enrollment and Degrees Survey collects data on overall enrollment and degrees awarded in Professional Science Master’s (PSM) programs. This is the fourth and final such survey conducted by the Council of Graduate Schools (CGS) with a grant from the Alfred P. Sloan Foundation. Future Professional Science Master’s Enrollment and Degrees
Surveys will be conducted by the Keck Graduate Institute.
PSM program directors and graduate deans (or equivalent) representing 302 PSM programs from 134 institutions of higher education were invited to provide data regarding the number of
applications received for admission for the fall term of 2013, the number of applications accepted for the fall term of 2013, the number of first‐time enrollees for the fall term of 2013, the total number of enrollees for the fall term of 2013, and the number of degrees awarded during the 2012/13 academic year (July 1, 2012 to June 30, 2013). The survey generated 258 usable responses, an 85% response rate. Of these, 236 reported students who were either enrolled in a PSM program in the fall term of 2013 or graduated from a PSM program during the 2012/13 academic year.
Applications
Survey respondents reported a total of 7,007 applications for admission to PSM programs for the fall term of 2013, 6,877 of which were for U.S.‐based programs. Among U.S.‐based programs, 70% of applications were received by public institutions, and 30% were received by private, not‐for‐ profit institutions. PSM programs in mathematics and statistics received more applications than programs in other fields of study, constituting 39% of all applications received for the fall term of 2013, followed by biotechnology (16%) and computer/information sciences (14%).
Respondents to the survey reported that 3,225 applications were accepted for the fall term of 2013, 3,137 of which were accepted by institutions based in the United States. Among U.S.‐based PSM programs, 67% of the applications accepted were for admission to public institutions, and 33% were for admission to private, not‐for‐profit institutions; 67% were for admission to doctoral institutions, and 33% were for admission to master’s‐focused, specialized, or other institutions.
The overall acceptance rate for the PSM programs responding to the survey was 46%. Among U.S.‐ based programs, the acceptance rate was 44% at public institutions and 50% at private, not‐for‐ profit institutions. The acceptance rate was 40% at doctoral institutions and 63% at master’s‐ focused, specialized, or other institutions based in the United States.
First‐Time Enrollment
A total of 1,926 students were enrolled for the first time in a PSM program in fall 2013, 1,846 of whom were enrolled in programs based in the United States. Slightly more than one‐half (52%) of all first‐time students were men, and slightly less than one‐half (48%) were women. Two‐thirds (66%) of all first‐time students were enrolled full‐time, and one‐third (34%) were enrolled part‐ time. Slightly more than one‐quarter (28%) of first‐time enrollees in U.S.‐based PSM programs were temporary residents (i.e., international students). Among U.S. citizens and permanent residents
viii who were enrolled for the first time in a PSM program in fall 2013, 19% were underrepresented students (Hispanic/Latino, American Indian/Alaska Native, or Black/African American). Three‐ quarters (74%) were Asian/Pacific Islander or White, and 6% were either of two or more races or their race/ethnicity was unknown.
The four largest fields of study with respect to first‐time enrollments in PSM programs were mathematics and statistics (23%), biotechnology (16%), computer/information sciences (14%), and environmental sciences and natural resources (13%). These four fields of study constituted 66% of all first‐time enrollees in PSM programs in fall 2013.
The overall yield rate, which is the number of first‐time enrollees divided by the number of applications accepted, was 60% across all PSM programs and 59% among PSM programs based in the United States. Among U.S.‐based institutions, the yield rate for public institutions (68%) was higher than the yield rate for private, not‐for‐profit institutions (41%). The yield rate was also higher at master’s‐focused, specialized, or other institutions (66%) than the yield rate at doctoral
institutions (55%).
Total Enrollment
A total of 5,867 students were enrolled in PSM programs in the fall term of 2013, 5,680 of whom were enrolled at U.S.‐based institutions. More than one‐half (53%) of total enrollees in PSM programs were men and slightly less than one‐half (47%) were women. Nearly three of every five (57%) PSM students were enrolled part‐time, compared to roughly two of every five (43%) who were enrolled full‐time. At U.S.‐based institutions, 19% of all enrollees were temporary residents. Among U.S. citizens and permanent residents, 24% of enrollees in fall 2013 were underrepresented students, 68% were Asian/Pacific Islander or White, and 8% were either of two or more races or their race/ethnicity was unknown.
Total PSM enrollment in fall 2013, as reported by all survey respondents, was dominated by four fields of study. Two‐thirds (65%) of all PSM students were pursuing degrees in computer/
information sciences (21%), environmental sciences and natural resources (15%), mathematics and statistics (15%), or biotechnology (14%).
Degrees
Institutions responding to the survey awarded 2,038 PSM degrees in academic year 2012/13 (July 1, 2012 to June 30, 2013), the vast majority (1,931) of which were awarded by U.S.‐based institutions. Over one‐half (54%) of the PSM degrees were awarded to men, while 46% were awarded to
women. Roughly one‐in‐five (18%) graduates of U.S.‐based PSM programs were temporary residents. Among U.S. citizens and permanent residents, 23% of PSM graduates in 2012/13 were underrepresented students, over two‐thirds (71%) were Asian/Pacific Islander or White, and 6% were either of two or more races or their race/ethnicity was unknown.
Biotechnology, mathematics and statistics, computer/information sciences, and environmental sciences and natural resources comprised the largest number of PSM degrees awarded in 2012/13,
ix conferring 71% of all PSM degrees awarded that academic year: 20%, 19%, 18%, and 14%
respectively.
Changes from 2010 to 2013
Data generated by the 2010, 2011, 2012, and 2013 Professional Science Master’s Enrollment and
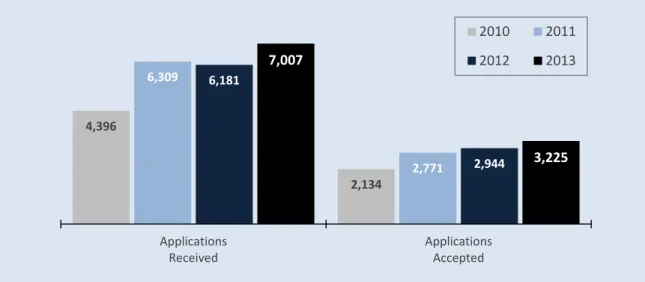
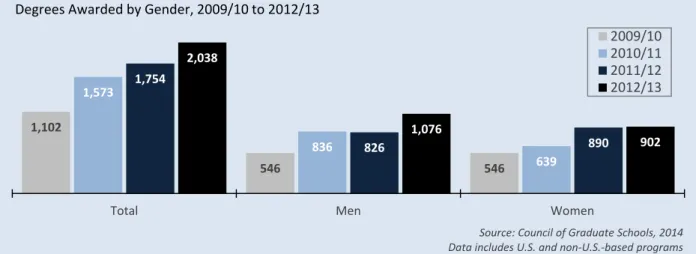
Degrees Surveys revealed a 59% increase in applications received between 2010 and 2013, from 4,396 applications received for fall 2010 to 7,007 applications received for fall 2013. The number of applications accepted increased 51%, from 2,134 in 2010 to 3,225 in 2013. The survey reported a 31% increase in first‐time enrollment, from 1,471 in 2010 to 1,926 in 2013, and 23% increase in total enrollment, from 4,753 in fall 2010 to 5,867 in fall 2013. There was an 85% increase in the number of PSM degrees awarded, from 1,102 in academic year 2009/10 to 2,038 in academic year 2011/12.
10 Introduction
The Professional Science Master’s (PSM) is designed to allow students to pursue advanced training in science, while developing workplace skills highly valued by employers. PSM programs prepare graduates for careers in business, government, and non‐profit organizations, combining rigorous study in science and/or mathematics with coursework in management, policy, law, or related fields. Along with an emphasis on writing, leadership, and communication skills, most PSM programs require a final project or team experience, as well as an internship in a business or public sector setting.
The PSM initiative began in 1997 with funding from the Alfred P. Sloan Foundation to support the establishment of programs in the natural sciences and mathematics at research institutions (Council of Graduate Schools, 2011). In 2001, a Sloan Foundation grant to the Council of Graduate Schools (CGS) extended the PSM initiative to master's‐focused institutions. In 2006, CGS assumed primary responsibility for supporting and expanding the PSM degree, with the goal of making it a regular feature of U.S. graduate education. As of September 2013, 302 programs from 134 institutions were recognized as PSMs. More information about the PSM initiative, and a complete list of PSM
programs can be found at www.sciencemasters.com.
The Professional Science Master’s Enrollment and Degrees Survey is an annual survey of enrollment and degrees in PSM programs. Previous PSM enrollment and degrees surveys were conducted for academic years 2007/08 and 2008/09 by the National Professional Science Master’s Association (2009a, 2009b), and for 2009/10, 2010/11, and 2011/12 by the Council of Graduate Schools (Bell & Allum, 2011; Bell & Allum, 2012; Allum, Gonzales, & Remington, 2013). The 2013 survey collects data regarding applications, first‐time enrollment, total enrollment, and degrees awarded.
Research Design
The 2013 Professional Science Master’s Enrollment and Degrees Survey was designed using more than 20 enrollment and degrees surveys as models. The questionnaire was constructed to collect the necessary data while remaining user‐friendly for respondents. The survey questionnaire, which appears in the Appendix, includes 43 question items.
Data Collection
The survey launched on October 9, 2013 via an e‐mail to PSM program directors and graduate deans (or equivalent) representing the 302 PSM programs from 134 institutions of higher education that were recognized as PSM programs as of September 2013. E‐mail reminders and telephone calls were used to collect data from non‐respondents. The survey closed on December 13, 2013, after collecting 258 usable responses, an 85% response rate.
Invitees were asked to provide data regarding the number of applications received for admission for the fall term of 2013, the number of applications accepted for the fall term of 2013, the number of
11 first‐time enrollees for the fall term of 2013, the total number of enrollees for the fall term of 2013, and the number of degrees awarded during the 2012/13 academic year (July 1, 2012 to June 30, 2013). Invitees were asked to provide enrollment data by gender, citizenship, race/ethnicity, and enrollment status, and degree data by gender, citizenship, and race/ethnicity. Data by
race/ethnicity were only collected for U.S.‐based PSM programs. Invitees were not asked to provide applications data by student demographics since some institutions do not collect these data from applicants. Detailed explanations and descriptions of these data elements appear with the questionnaire in the Appendix.
Data Analysis
Data were reviewed, cleaned, and edited using a process outlined by Van den Broeck, Argeseanu Cunningham, Eeckels, and Herbst (2005). The dataset was screened for instances where data were lacking, in excess, inconsistent, revealed strange patterns, or were otherwise suspect. Anomalies were recorded and diagnosed as being missing, erroneous, or seemingly extreme. Irregularities were addressed.
Certain definitions were adopted to facilitate the analysis and reporting of the survey data. The term “underrepresented students” refers to U.S. citizens and permanent residents identified as being Hispanic/Latino, American Indian/Alaska Native, or Black/African American. The term “institutional control” refers to the classification of institutions as public; private, not‐for‐profit; or private, for‐profit institutions of higher education. The term “Carnegie classification” refers to the basic classification of the 2010 Carnegie Classification of Institutions of Higher Education.
Institutions classified as research universities with very high research activity (RU/VH), research universities with high research activity (RU/H), and doctoral/research universities (DRU) are
grouped as “doctoral institutions.” Master’s colleges and universities and specialized institutions are grouped in this report as “master’s‐focused, specialized, or other institutions.” The term
“enrollment status” refers to whether a student was enrolled primarily full‐time or part‐time. Institutions were instructed to apply their own definition of full‐time and part‐time enrollment status. Fields of study, as defined on www.sciencemasters.com as of December 2012, were used to cluster programs within this report. Finally enrollment and degrees in the fields of energy/power, forensic sciences, nanoscience, and national defense were combined into the “other
interdisciplinary sciences” category due to the small numbers of enrollments and degrees in these fields.
The analytical process and subsequent report required the suppression of some data. Data from PSM programs based outside of the United States were suppressed when examining enrollments and degrees by citizenship and race/ethnicity since these definitions differ outside the U.S. Data from non‐U.S.‐based programs were also suppressed when examining data by institutional control and Carnegie classification for the same reason.
12 Limitations
This study has some limitations. First, some data were necessarily suppressed for certain analyses. Second, one responding institution was particularly large and is likely to have skewed certain findings. Finally, this report likely understates the total number of applications to, applications accepted by, enrollments in, and degrees awarded by PSM programs, since the sample was restricted to PSM programs as of September 2012 and since a small percentage of PSM programs did not respond to the survey. Changes in PSM applications, enrollments, and degrees between 2010 and 2013 should also be interpreted with caution. Readers should note that comparisons between 2010 and 2013 included programs that responded to at least one, but not necessarily all four surveys. Since the number of PSM programs has increased each year, some of the overall growth in PSM applications, enrollments, and degrees is simply a reflection of the growth in the number of PSM programs.
13 Findings
This report includes descriptive statistics regarding applications to, applications accepted for, enrollment in, and degrees awarded by PSM programs responding to the 2013 Professional Science
Master’s Enrollment and Degrees Survey. This report also describes some of the changes in enrollments and degrees between 2010 and 2013.
Characteristics of Survey Respondents
The 2013 Professional Science Master’s Enrollment and Degrees Survey generated 258 responses from 118 institutions of higher education. Of those, 236 programs from 111 institutions of higher education reported having students who were either enrolled in a PSM program in fall 2013 or graduated from a PSM program during the 2012/13 academic year (July 1, 2012 to June 30, 2013). Responses from these 236 programs serve as the basis for this report.
The vast majority (233) of the 236 PSM programs with students were from institutions located in the United States. Among these U.S.‐based programs, four‐in‐five (79%) were in public institutions, and under one‐in‐five (21%) were in private, not‐for‐profit institutions. By basic Carnegie
classification, 72% were located in doctoral institutions, and 28% were located in master’s‐focused, specialized, or other institutions.
PSM programs responding to the survey were grouped into ten fields of study. The biological sciences (including biotechnology, bioinformatics/computational biology, other biological sciences, and medical‐related sciences) comprised 37% of all PSM programs among U.S. and non‐U.S.‐based programs. The six remaining fields comprised 63% of all PSM programs. Figure 1 depicts the distribution of PSM programs by field of study.
14
Applications Received
Institutions responding to the 2013 Professional Science Master’s Enrollment and Degrees Survey received 7,007 applications for admission to PSM programs for the fall term of 2013, 6,877 of which were for PSM programs based in the United States. Among U.S.‐based PSM programs, 70% of all applications were received by public institutions, and 30% were received by private, not‐for‐profit institutions (see Figure 2). Three‐quarters of (76%) applications were received by U.S.‐based doctoral institutions, and 24% were received by U.S.‐based master’s‐focused, specialized, or other institutions.
Environmental
Sciences and
Natural
Resources 19%
Biotechnology 12%
Other Biological
Sciences 11% Mathematics and
Statistics 10% Medical‐Related
Sciences 10% Other
Interdisciplinary
Sciences 10% Computer /
Information
Sciences 9% Chemistry and
Physics 7%
Bioinformatics /
Computational
Biology 4%
Geosciences and
GIS 8% Figure 1.
Distribution of PSM Programs by Field of Study, Fall 2013
Source: Council of Graduate Schools, 2014 Represents U.S. and non‐U.S.‐based programs Other Interdisciplinary Sciences includes energy/power, forensic sciences, nanoscience, and national defense
76% 24%
70% 30%
Doctoral Master's‐focused , Specialized or Other Public Private, not‐for‐profit Figure 2.
Applications Received by PSM Programs by Institutional Control and Carnegie Classification, Fall 2013
Source: Council of Graduate Schools, 2014 Represents only U.S.‐based programs
15 As shown in Figure 3, PSM programs in mathematics and statistics received more applications than programs in other fields of study, constituting 39% of all applications received for fall 2013. PSM programs in biotechnology generated 16% of all applications for fall 2013 and computer/
information sciences generated 14% of all applications for fall 2013. Environmental sciences and natural resources, medical‐related sciences, other interdisciplinary sciences, and other biological sciences comprised 8%, 6%, 5%, and 5% of all applications received for fall 2013 respectively.
Applications Accepted
Respondents to the 2013 Professional Science Master’s Enrollment and Degrees Survey reported that 3,225 applications were accepted for the fall term of 2013. The majority of applications accepted (3,137) were for U.S.‐based PSM programs, and among those, two‐thirds (67%) were for admission to public institutions and one‐third (33%) were for admission to private, not‐for‐profit institutions. Two‐thirds (67%) of applications accepted for U.S.‐based PSM programs were for admission to doctoral institutions, and one‐third (33%) were for admission to master’s‐focused, specialized, or other institutions (see Figure 4).
Mathematics and
Statistics 39%
Biotechnology 16% Computer /
Information
Sciences 14%
Environmental
Sciences and
Natural
Resources 8% Medical‐related
Sciences 6% Other
Interdisciplinary
Sciences 5%
Other Biological
Sciences 5%
Bioinformatics /
Computational
Biology 3%
Geosciences and
GIS 3%
Chemistry and
Physics 1%
Figure 3.
Applications Received by PSM Programs by Field of Study, Fall 2013
Source: Council of Graduate Schools, 2014 Represents U.S. and non‐U.S.‐based programs Other Interdisciplinary Sciences includes energy/power, forensic sciences, nanoscience, and national defense
16
As depicted in Figure 5, mathematics and statistics programs accounted for the largest percentage of accepted applications among the ten fields of study (27%), followed by computer/information sciences (17%) and biotechnology (17%). Environmental science and natural resources, other interdisciplinary sciences, medical‐related sciences, and other biological sciences accounted for 11%, 7%, 6%, and 6% of all accepted applications respectively.
The overall acceptance rate for the PSM programs responding to the 2013 Professional Science
Master’s Enrollment and Degrees Survey was 46%, meaning that nearly one‐half of all applications received were accepted for admission to PSM programs. Among U.S.‐based programs, the
acceptance rate was 44% at public institutions and 50% at private, not‐for‐profit institutions. The 67%
33%
67% 33%
Doctoral Master's‐focused , Specialized or Other
Public Private, not‐for‐profit Figure 4.
Applications Accepted by PSM Programs by Institutional Control and Carnegie Classification, Fall 2013
Source: Council of Graduate Schools, 2014 Represents only U.S.‐based programs
Mathematics and
Statistics 27%
Computer /
Information
Sciences 17% Biotechnology
17%
Environmental
Sciences and
Natural
Resources 11% Other
Interdisciplinary
Sciences 7% Medical‐related
Sciences 6%
Other Biological
Sciences 6%
Geosciences and
GIS 4%
Bioinformatics /
Computational
Biology
4% Chemistry and
Physics 1%
Figure 5.
Applications Accepted by PSM Programs by Field of Study, Fall 2013
Source: Council of Graduate Schools, 2014 Represents U.S. and non‐U.S.‐based programs Other Interdisciplinary Sciences includes energy/power, forensic sciences, nanoscience, and national defense
17 acceptance rate was 40% at doctoral institutions and 63% at master’s‐focused, specialized, or other institutions.
As illustrated in Figure 6, eight fields of study reported application acceptance rates that were higher than the overall average of 46%. Bioinformatics/computational biology programs had a particularly high acceptance rate (76%), while medical‐related sciences and mathematics and statistics programs had particularly low acceptance rates (45% and 31% respectively).
First‐Time Enrollment
Respondents to the 2013 Professional Science Master’s Enrollment and Degrees Survey reported that 1,926 students enrolled for the first time in a PSM program in fall 2013, the majority of whom (1,846) were enrolled in programs based in the United States. Among U.S. and non‐U.S.‐based PSM programs, slightly more than one‐half (52%) of all first‐time students were men, and slightly less than one‐half (48%) were women. Among this same population, two‐thirds (66%) of all first‐time students were enrolled full‐time, and one‐third (34%) were enrolled part‐time. Slightly more than one‐quarter (28%) of first‐time enrollees in U.S.‐based PSM programs were temporary residents (i.e., international students). Among U.S. citizens and permanent residents who were enrolled for the first time in a PSM program in fall 2013, 19% were underrepresented students (Hispanic/Latino, American Indian/Alaska Native, or Black/African American). Three‐quarters (74%) were
Asian/Pacific Islander or White, and 6% were either of two or more races or their race/ethnicity was unknown. These characteristics are summarized in Figure 7.
31%
45% 46%
50% 56%
57% 57%
59% 62%
63%
76%
Mathematics and Statistics Medical‐related Sciences Total Biotechnology Other Biological Sciences Chemistry and Physics Computer / Information Sciences Other Interdisciplinary Sciences Environmental Sciences and Natural Resources Geosciences and GIS Bioinformatics / Computational Biology Figure 6.
Acceptance Rates in PSM Programs by Field of Study, Fall 2013
Source: Council of Graduate Schools, 2014 Represents U.S. and non‐U.S.‐based programs Other Interdisciplinary Sciences includes energy/power, forensic sciences, nanoscience, and national defense
18
Yield Rates
The overall yield rate, which is the number of first‐time enrollees divided by the number of applications accepted, was 60% across all PSM programs and 59% at U.S.‐based institutions. The yield rate for U.S.‐based public institutions (68%) was higher than the yield rate for private, not‐for‐ profit institutions (41%). The yield rate was higher at master’s‐focused, specialized, or other institutions (66%) than at doctoral institutions (55%).
Yield rates varied by field of study. PSM programs reporting particularly high yield rates include medical‐related sciences (88%), chemistry and physics (77%), other interdisciplinary sciences (69%), environmental sciences and natural resources (69%), and bioinformatics/computational biology (68%). Computer/information sciences and mathematics and statistics PSM programs reported the lowest yield rates at 50% and 51% respectively (see Figure 8).
6%
74% 19%
28%
70% 34%
66% 48%
52%
Two or more races or unknown Asian/Pacific Islander or White Underrepresented students International Domestic Part‐time Full‐time Women Men Figure 7.
Characteristics of First‐Time Enrollees in PSM Programs, Fall 2013
Source: Council of Graduate Schools, 2014 Gender and enrollment status calculations based upon U.S. and non‐U.S.‐based programs Citizenship calculations based upon only U.S.‐based programs and do not equal 100% due to students whose citizenship was not reported Race/ethnicity calculations based upon only U.S. citizens and permanent residents enrolled in U.S.‐based programs
19
First‐Time Enrollment by Institutional Control
More than three‐quarters (77%) of first‐time students in U.S.‐based PSM programs were enrolled in a public institution in fall 2013 and roughly one‐quarter (23%) were enrolled in a private, not‐for‐ profit institutions. More than one‐half (53%) of first‐time students enrolled in public institutions were men and less than one‐half (47%) were women. Among first‐time enrollees in private, not‐for‐ profit institutions, 49% were men and 51% were women. Four‐fifths (83%) of first‐time enrollees at private, not‐for‐profit institutions were enrolled full‐time compared to three‐fifths (61%) of first‐ time enrollees at public institutions. Roughly two‐fifths (42%) of first‐time enrollees in U.S.‐based private, not‐for‐profit institutions were temporary residents (i.e., international students).
Among U.S. citizens and permanent residents enrolled in the first‐time in a U.S.‐based PSM program at public institutions, 19% were underrepresented students, 74% were Asian/Pacific Islander or White, and 7% were either of two or more races or their race/ethnicity was unknown. Similarly, 20% of first‐time enrollees in U.S.‐based private, not‐for‐profit institutions were underrepresented students, 76% were Asian/Pacific Islander or White, and 4% were either of two or more races or their race/ethnicity was unknown.
50% 51%
58% 60%
60% 66%
68% 69% 69%
77% 88%
Computer / Information Sciences Mathematics and Statistics Biotechnology Total Geosciences and GIS Other Biological Sciences Bioinformatics / Computational Biology Environmental Sciences and Natural Resources Other Interdisciplinary Sciences Chemistry and Physics Medical‐related Sciences Figure 8.
Yield Rates in PSM Programs by Field of Study, Fall 2013
Source: Council of Graduate Schools, 2014 Other Interdisciplinary Sciences includes energy/power, forensic sciences, nanoscience, and national defense
20 First‐Time Enrollment by Carnegie Classification
By basic Carnegie classification, 63% of first‐time enrollees in U.S.‐based PSM programs were
enrolled in doctoral institutions in fall 2013, and 37% were enrolled in master’s‐focused, specialized, or other institutions. First‐time enrollment in PSM programs at U.S.‐based doctoral institutions were split among men and women in fall 2013, with 50% each. The gender distribution of first‐time enrollment in PSM programs at U.S.‐based master’s‐focused, specialized, or other institutions was similar; 55% were men, and 45% were women.
First‐time enrollees in U.S.‐based doctoral institutions were more likely than first‐time enrollees in master’s‐focused, specialized, or other institutions to be enrolled full‐time. Three‐quarters (76%) of first‐time students at doctoral institutions were enrolled full‐time, compared to one‐half (50%) of first‐time students at master’s‐focused, specialized, or other institutions. U.S.‐based doctoral institutions responding to the survey reported that 31% of their first‐time enrollees were temporary residents compared with 23% of first‐time enrollees at master’s‐focused, specialized, or other institutions.
Master’s‐focused, specialized, or other institutions enrolled more first‐time students who were underrepresented students than did doctoral institutions. One‐quarter (26%) of U.S. citizens and permanent residents at U.S.‐based master’s‐focused, specialized, or other institutions were
underrepresented students compared to 15% at doctoral institutions. Four‐fifths (80%) of first‐time enrollees at doctoral institutions and two‐thirds (66%) of first‐time enrollees at master’s‐focused, specialized, or other institutions were Asian/Pacific Islander or White. Five percent of first‐time students enrolled in PSM programs at doctoral institutions were either of two or more races or their race/ethnicity was unknown compared to 9% of first‐time enrollees in master’s‐focused,
specialized, or other institutions.
First‐Time Enrollment by Field of Study
The four largest fields of study with respect to first‐time enrollments were mathematics and statistics (23%), biotechnology (16%), computer/information sciences (14%), and environmental sciences and natural resources (13%). These four fields of study constituted 66% of all first‐time enrollees in PSM programs in fall 2013. As shown in Figure 9, first‐time enrollment was smallest in chemistry and physics (2%) and in geosciences and GIS fields (4%).
Men constituted the majority of first‐time students enrolled in the fields of computer/information sciences (67%), chemistry and physics (62%), other interdisciplinary sciences (58%), mathematics and statistics (53%), geosciences and GIS (53%), and medical‐related sciences (52%). As shown in Figure 10, PSM programs in environmental sciences and natural resources, biotechnology, and other biological sciences enrolled more first‐time students who were women than men, with 53%, 57%, 62% respectively.
21
PSM programs responding to the survey reported variances in first‐time enrollment by
race/ethnicity and field of study. As shown in Figure 11, PSM programs in computer/information sciences (30%), medical‐related sciences (25%), other interdisciplinary sciences (24%), geosciences and GIS (21%), environmental sciences and natural resources (21%), and bioinformatics/
Mathematics and
Statistics 23%
Biotechnology 16%
Computer /
Information
Sciences 14%
Environmental
Sciences and
Natural
Resources 13% Medical‐related
Sciences 9% Other Interdisciplinary Sciences 8%
Other Biological
Sciences 6%
Bioinformatics /
Computational
Biology 5%
Geosciences and
GIS 4%
Chemistry and
Physics 2%
Figure 9.
First‐Time Enrollment in PSM Programs by Field of Study, Fall 2013
Source: Council of Graduate Schools, 2014 Represents U.S. and non‐U.S.‐based programs
38% 43% 47% 50% 52% 52% 53% 53% 58% 62% 67% 62% 57% 53% 50% 48% 48% 47% 47% 42% 38% 33%
Other Biological Sciences Biotechnology Environmental Sciences and Natural Resources Bioinformatics / Computational Biology Total Medical‐related Sciences Geosciences and GIS Mathematics and Statistics Other Interdisciplinary Sciences Chemistry and Physics Computer / Information Sciences Figure 10.
First‐Time Enrollment in PSM Programs by Field of Study and Gender, Fall 2013
Men
Women Source: Council of Graduate Schools, 2014 Represents U.S. and non‐U.S.‐based programs
22 computational biology (19%) had higher percentages of first‐time enrollees who were
underrepresented students than the overall average (19%) for all U.S.‐based PSM programs responding to the survey.
Total Enrollment
Institutions responding to the 2013 Professional Science Master’s Enrollment and Degrees Survey reported a total of 5,867 students enrolled in PSM programs in fall 2013, 5,680 of whom were enrolled in U.S.‐based institutions (see Figure 12). More than one‐half (53%) of total enrollees in PSM programs were men, and slightly less than one‐half (47%) were women. Nearly three of every five (57%) PSM students were enrolled part‐time, compared to two of every five (43%) who were enrolled full‐time. At U.S.‐based institutions, 19% of all enrollees in U.S.‐based PSM programs were temporary residents. Among U.S. citizens and permanent residents, 24% of enrollees in fall 2013 were underrepresented students, 68% were Asian/Pacific Islander or White, and 8% were either of two or more races or their race/ethnicity was unknown.
7% 13% 11%
17% 19% 19% 21% 21% 24%
25% 30%
71% 83% 86% 73% 74% 71%
73% 78% 68%
69% 63%
21% 4% 3% 6% 10% 6% 1% 9% 6% 6%
Chemistry and Physics Other Biological Sciences Mathematics and Statistics Biotechnology Total Bioinformatics / Computational Biology Environmental Sciences and Natural Resources Geosciences and GIS Other Interdisciplinary Sciences Medical‐related Sciences Computer / Information Sciences Figure 11.
First‐Time Enrollment in PSM Programs by Field of Study and Race/Ethnicity, Fall 2013
Underrepresented students Asian/Pacific Islander or White
Two or more races or unknown Source: CouncilRepresents only U.S. of Graduate‐based programs Schools, 2014
23
Total Enrollment by Institutional Control
The majority (82%) of students enrolled in U.S.‐based PSM programs were enrolled in public institutions, and 18% were enrolled in private, not‐for‐profit institutions, according to the survey respondents. Women represented 47% of total enrollments in public institutions (compared to 53% men) and 48% of total enrollments in private, not‐for‐profit institutions (compared to 52% men).
As a percentage of total enrollment, temporary residents comprised a larger share of students at private, not‐for‐profit institutions than at public institutions in fall 2013. More than one‐quarter (28%) of enrollees at private, not‐for‐profit institutions were international students compared to 17% at public institutions. Among U.S. citizens and permanent residents, 26% of enrollees in public institutions were underrepresented students, while 66% were Asian/Pacific Islander or White, and 8% were either of two or more races or their race/ethnicity was unknown. By contrast, 14% of enrollees in private, not‐for‐profit institutions were underrepresented students, 78% were
Asian/Pacific Islander or White, and 8% were either of two or more races or their race/ethnicity was unknown.
Total Enrollment by Carnegie Classification
By Carnegie classification, 48% of PSM students in U.S.‐based institutions were enrolled in master’s‐ focused, specialized, or other institutions, and 52% were enrolled in doctoral institutions. Men constituted 52% of enrollees at doctoral institutions, and women constituted 49%. Men constituted 54% of enrollees at master’s‐focused, specialized, or other institutions, and women 46%. Three‐ quarters (76%) of PSM enrollees in U.S.‐based master’s‐focused, specialized, or other institutions were enrolled part‐time in fall 2013, and one‐quarter (24%) were enrolled full‐time. By contrast, two‐fifths (40%) of PSM students enrolled in U.S.‐based doctoral institutions attended part‐time, compared to three‐fifths (60%) who were enrolled full‐time.
8%
68% 24%
19%
77% 57%
43% 47%
53%
Two or more races or unknown Asian/Pacific Islander or White Underrepresented students International Domestic Part‐time Full‐time Women Men Figure 12.
Characteristics of Total Enrollees in PSM Programs, Fall 2013
Source: Council of Graduate Schools, 2014 Gender and enrollment status calculations based upon U.S. and non‐U.S.‐based programs Citizenship calculations based upon only U.S.‐based programs and do not equal 100% due to students whose citizenship was not reported Race/ethnicity calculations based upon only U.S. citizens and permanent residents enrolled in U.S.‐based programs
24 As a percentage of total enrollment, temporary residents comprised a larger share of students at doctoral institutions than at master’s‐focused, specialized, or other institutions. Nearly one‐third (30%) of the enrollees at doctoral institutions were international students compared to 7% at master’s‐focused, specialized, or other institutions. Master’s‐focused, specialized, or other institutions enrolled a larger percentage of underrepresented students than doctoral institutions. As shown in Figure 13, one‐third (31%) of U.S. citizens and permanent residents at U.S.‐based master’s‐focused, specialized, or other institutions were underrepresented students compared to 15% at U.S.‐based doctoral institutions. Asian/Pacific Islander and White students constituted 59% of total enrollment at master’s‐focused, specialized, or other institutions, and 78% of total
enrollments at doctoral institutions.
Total Enrollment by Field of Study
Total PSM enrollment in fall 2013, as reported by all survey respondents, was dominated by four fields of study. Two‐thirds (65%) of all PSM students were pursuing degrees in computer/
information sciences (21%), environmental sciences and natural resources (15%), mathematics and statistics (15%), and biotechnology (14%). Total enrollment in the six remaining fields of comprised two‐thirds (35%) of total PSM enrollment in fall 2013 (see Figure 14).
15% 31% 24%
78% 59% 68%
6% 10% 8%
Doctoral Master's‐focused , Specialized or Other Total Figure 13.
Total Enrollment in PSM Programs by Carnegie Classification and Race/Ethnicity, Fall 2013
Underrepresented students Asian/Pacific Islander or White
Two or more races or unknown Source: Council of Graduate Schools, 2014 Represents only U.S. citizens and permanent residents enrolled in U.S.‐based programs
25
Total enrollment in computer/information sciences, other interdisciplinary sciences, chemistry and physics, geoscience and GIS, mathematics and statistics, and bioinformatics/computational biology contained more men than women (see Figure 15), with 63%, 60%, 59%, 56%, 55%, and 53%
respectively. By comparison, enrollments in environmental sciences and natural resources, medical‐ related sciences, other biological sciences, and biotechnology were more heavily composed of women, with 52%, 54%, 56%, and 57% respectively.
PSM programs in computer/information sciences, environmental sciences and natural resources, other interdisciplinary sciences, chemistry and physics, and medical‐related sciences had large percentages of part‐time students: 76%, 68%, 66%, 64%, and 64%, respectively. PSM programs in mathematics and statistics and biotechnology had larger percentages of students who were enrolled full‐time: 73% and 61% respectively. Temporary residents were most likely to be enrolled in three PSM programs. Over one‐half (55%) of mathematics and statistics PSM students, one‐ quarter (25%) of biotechnology students, and one‐in‐five (22%) of bioinformatics/computational biology students were temporary residents.
Computer /
Information
Sciences 21%
Environmental
Sciences and
Natural
Resources 15%
Mathematics and
Statistics 15% Biotechnology
14% Other
Interdisciplinary
Sciences 8% Medical‐related
Sciences 9% Other Biological
Sciences 6%
Bioinformatics /
Computational
Biology 6%
Chemistry and
Physics
2% Geosciences and
GIS 4%
Figure 14.
Total Enrollment in PSM Programs by Field of Study, Fall 2013
Source: Council of Graduate Schools, 2014 Represents U.S. and non‐U.S.‐based programs
26
As shown in Figure 16, PSM programs in computer/information sciences, and other interdisciplinary sciences had higher percentages of underrepresented students who were U.S. citizens or
permanent residents than the overall average (24%), with 38%, and 33% respectively.
Biotechnology, bioinformatics/computational biology, medical‐related sciences, environmental and natural resources PSM programs enroll a slightly lower percentage of underrepresented students than the overall average, at 22%, 21%, 21%, and 21% respectively.
43% 44% 46% 48% 53% 53% 55% 56% 59% 60% 63% 57% 56% 54% 52% 47% 47% 45% 44% 41% 40% 37% Biotechnology Other Biological Sciences Medical‐related Sciences Environmental Sciences and Natural Resources Bioinformatics / Computational Biology Total Mathematics and Statistics Geosciences and GIS Chemistry and Physics Other Interdisciplinary Sciences Computer / Information Sciences Figure 15.
Total Enrollment in PSM Programs by Field of Study and Gender, Fall 2013
Men
Women Source: Council of Graduate Schools, 2014 Represents U.S. and non‐U.S.‐based programs
5% 13% 14% 14% 21% 21% 21% 22% 24% 33% 38% 72% 80% 82% 85% 73% 71% 68% 68% 68% 61% 51% 24% 7% 4% 1% 6% 8% 10% 10% 8% 7% 11%
Chemistry and Physics Other Biological Sciences Mathematics and Statistics Geosciences and GIS Environmental Sciences and Natural Resources Medical‐related Sciences Bioinformatics / Computational Biology Biotechnology Total Other Interdisciplinary Sciences Computer / Information Sciences Figure 16.
Total Enrollment in PSM Programs by Field of Study and Race/Ethnicity, Fall 2013
Underrepresented students Asian/Pacific Islander or White
27 Degrees
Institutions responding to the 2013 Professional Science Master’s Enrollment and Degrees Survey awarded 2,038 degrees in academic year 2012/13 (July 1, 2012 to June 30, 2013), the vast majority (1,931) of which were granted by U.S.‐based institutions. Just over one‐half (54%) of PSM degrees were awarded to men, while 46% were awarded to women. Roughly one‐in‐five (18%) graduates of U.S.‐based PSM programs were temporary residents. Among U.S. citizens and permanent residents, 23% of PSM graduates in 2012/13 were underrepresented students, nearly three‐quarters (71%) were Asian/Pacific Islander or White, and a small percentage (6%) were either of two or more races or their race/ethnicity was unknown. A summary of these characteristics appears in Figure 17.
Degrees by Institutional Control
Among U.S.‐based PSM programs responding to the survey, four‐in‐five (82%) degrees were earned from a public institution, and one‐in‐five (18%) were earned from a private, not‐for‐profit
institution. Over one‐half (56%) of degrees awarded by U.S.‐based public institutions were awarded to men, and 44% to women. Less than one‐half (47%) of degrees awarded by U.S.‐based private, not‐for‐profit institutions were awarded to men, compared to 53% awarded to women. Over one‐ quarter(26%) of all graduates who earned their PSM degree from a U.S.‐based private, not‐for‐ profit institution were temporary residents, and 16% of all graduates who earned their degree from a public institution were temporary residents.
Among U.S. citizens and permanent residents who earned a degree from a public institution in the 2012/13 academic year, 24% were underrepresented students, 72% were Asian/Pacific Islander or White, and 4% were either of two or more races or their race/ethnicity was unknown.
Underrepresented students constituted a smaller percentage (15%) of graduates of private, not‐for‐ profit institutions. Nearly three‐quarters (70%) of private, not‐for‐profit graduates were
6%
71% 23%
18%
76% 46%
54%
Two or more races or unknown Asian/Pacific Islander or White Underrepresented students International Domestic Women Men Figure 17.
Characteristics of PSM Degrees Awarded, 2012/13
Source: Council of Graduate Schools, 2014 Gender calculations based upon U.S. and non‐U.S.‐based programs Citizenship calculations based upon only U.S.‐based programs and do not equal 100% due to students whose citizenship was not reported Race/ethnicity calculations based upon only degrees awarded to U.S. citizens and permanent residents by U.S.‐based programs
28 Asian/Pacific Islander or White, and 15% were either of two or more races or their race/ethnicity was unknown.
Degrees by Carnegie Classification
By Carnegie classification, and among U.S.‐based institutions, nearly one‐half (44%) of PSM degrees were awarded by master’s‐focused, specialized, or other institutions in 2012/13, and more than one‐half (56%) were awarded by doctoral institutions. Over one‐half (53%) of PSM degrees awarded by U.S.‐based doctoral institutions were awarded to men, whereas 47% were awarded to women. Similarly, 56% of all PSM degrees awarded by master’s‐focused, specialized, or other institutions were awarded to men in 2012/13, compared to 44% awarded to women.
Master’s‐focused, specialized, or other institutions awarded a larger percentage of degrees to underrepresented students than doctoral institutions (see Figure 18). Nearly one‐third (31%) of PSM degrees awarded by master’s‐focused, specialized, or other institutions to U.S. citizens and permanent residents in the 2012/13 academic year were awarded to underrepresented students, two‐thirds (63%) of PSM degrees were awarded to Asian/Pacific Islander or White students, and 6% were awarded to individuals who were either of two or more races or whose race/ethnicity was unknown. By contrast, 15% of PSM degrees awarded by U.S.‐based doctoral institutions to U.S. citizens and permanent residents in the 2012/13 academic year were awarded to underrepresented students, 80% to Asian/Pacific Islander or White graduates, and 5% to individuals who were either of two or more races or whose race/ethnicity was unknown.
Degrees by Field of Study
By field of study, biotechnology, mathematics and statistics, computer/information sciences, and environmental sciences and natural resources comprised the largest numbers of PSM degrees awarded in 2012/13, at 20%, 19%, 18%, and 14% respectively. As shown in Figure 19, these four fields combined awarded 71% of all PSM degrees awarded that academic year. Chemistry and physics and geosciences and GIS constituted 1% and 3% of degrees awarded in 2012/13.
23% 15%
31%
71% 80%
63%
6% 5% 6%
Total Doctoral Master's‐focused , Specialized or Other
Figure 18.
PSM Degrees Awarded by Carnegie Classification and Race/Ethnicity, 2012/13
Underrepresented students Asian/Pacific Islander or White
29
Men earned the majority of the PSM degrees awarded in geosciences and GIS, other
interdisciplinary sciences, and computer/information sciences at 75%, 66%, and 66% respectively. Women earned a higher percentage of degrees than men in other biological sciences,
environmental sciences and natural resources, and medical‐related sciences at 57%, 53%, and 52% respectively.
Temporary residents were more likely than U.S. citizens and permanent residents to earn PSM degrees in the fields of bioinformatics/computational biology, mathematics and statistics, and biotechnology. These three categories accounted for more than two‐thirds (69%) of all PSM degrees earned by temporary residents in U.S.‐based institutions in 2012/13. As shown in Figure 20, the field of study in which the largest percentage of underrepresented students earned a degree in 2012/13 was computer/information sciences (42%), followed by other interdisciplinary sciences and bioinformatics/computational biology (30% and 26% respectively).
Biotechnology 20%
Mathematics and
Statistics 19%
Computer /
Information
Sciences 18%
Environmental
Sciences and
Natural
Resources 14% Other
Interdisciplinary
Sciences 8%
Medical‐related
Sciences 7% Other Biological
Sciences 6%
Bioinformatics /
Computational
Biology 4%
Chemistry and
Physics 1%
Geosciences and
GIS 3%
Figure 19.
PSM Degrees Awarded by Field of Study, 2012/13
Source: Council of Graduate Schools, 2014 Represents U.S. and non‐U.S.‐based programs
30
Changes from 2010 to 2012
Data from the 2010, 2011, 2012, and 2013 Professional Science Master’s Enrollment and Degrees
Surveys represent a comprehensive picture of trends in PSM applications, enrollments, and degrees since response rates were 89%, 95%, 93%, and 85% respectively. Comparisons were made using all respondents to these surveys to show changes in the overall PSM initiative between 2010 and 2013.
Applications
Overall, respondents to the 2010, 2011, 2012, and 2013 Professional Science Master’s Enrollment
and Degrees Surveys reported a 59% increase in applications received between 2010 and 2013, from 4,396 applications received for fall 2010 to 7,007 applications received for fall 2013 (see Figure 21). Respondents to the four surveys reported a 51% increase in applications accepted, from 2,134 in 2010 to 3,225 in 2013. The largest portion of the increase in applications accepted was between 2010 and 2011 when the number of applications accepted for admission in PSM programs
increased from 2,134 to 2,771.
6% 12%
13% 15% 16% 16% 20%
23% 26%
30% 42%
80% 76%
81% 83%
82% 76%
71% 71% 64%
65% 52%
14% 12%
6% 2% 2% 7% 9% 6% 11% 5% 5%
Geosciences and GIS Chemistry and Physics Other Biological Sciences Mathematics and Statistics Environmental Sciences and Natural Resources Medical‐related Sciences Biotechnology Total Bioinformatics / Computational Biology Other Interdisciplinary Sciences Computer / Information Sciences Figure 20.
PSM Degrees Awarded by Field of Study and Race/Ethnicity, 2012/13
Underrepresented students Asian/Pacific Islander or White
31
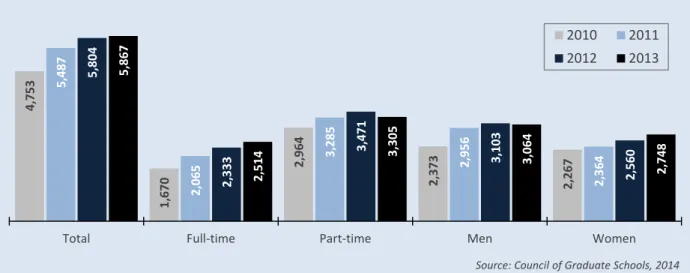
First‐Time Enrollment
As depicted in Figure 22, respondents to the 2010, 2011, 2012, and 2013 Professional Science
Master’s Enrollment and Degrees Surveys reported an increase in first‐time enrollment of 31%, from 1,471 in 2010 to 1,926 in 2013. First‐time enrollment among full‐time students grew by 49%
between fall 2010 and fall 2013 (from 855 to 1,273), while first‐time enrollment among part‐time students increased 9% (from 597 to 651). The number of men enrolled for the first time in PSM programs increased by 24% between 2010 and 2013 (from 802 to 995), while the number of women increased by 43% (from 643 to 921) during the same time period.
4,396
2,134 6,309
2,771 6,181
2,944 7,007
3,225
Applications Received
Applications Accepted Figure 21.
Change in Applications Received and Applcations Accepted, Fall 2010 to Fall 2013
2010 2011
2012 2013
Source: Council of Graduate Schools, 2014 Data includes U.S. and non‐U.S.‐based programs
1,471
855
597
802
643
1,687
1,072
560
880
751
1,884
1,195
689
918
875
1,926
1,273
651
995 921
Total Full‐time Part‐time Men Women
Figure 22.
First‐Time Enrollment by Enrollment Status and Gender, Fall 2010 to Fall 2013
2010 2011
2012 2013
Source: Council of Graduate Schools, 2014 Data includes U.S. and non‐U.S.‐based programs