Comparing Alignment of a State Test and District Formative Assessments with State Content Standards using Three Methods
Elizabeth L. Greive
A thesis submitted to the faculty of the University of North Carolina at Chapel Hill in partial fulfillment of the requirements for the degree of Master of Arts in the School of Education (Educational Psychology, Measurement, and Evaluation).
Chapel Hill 2012
Abstract
ELIZABETH L. GREIVE: Comparing Alignment of a State Test and District Formative Assessments with State Content Standards using Three Methods
(Under the direction of Gregory J. Cizek)
Table of Contents
List of Tables ... vi
List of Figures ... vii
Comparing Alignment of a State Test and District Formative Assessments with State Content Standards using Three Methods ... 1
Webb Alignment Method ... 7
Applications of the Webb Alignment Method ... 12
Achieve Alignment Method ... 16
Application of the Achieve Method ... 20
Surveys of an Enacted Curriculum (SEC) ... 22
Application of the SEC Model ... 27
Issues and Future Directions ... 30
Method ... 32
Results ... 37
Webb Results for the Formative Assessment and Summative Test ... 37
Achieve Results ... 45
SEC Results ... 51
Results Comparison ... 58
Conclusions, Recommendations, and Limitations ... 63
Conclusions and Recommendations ... 63
Summary and Future Studies ... 71
Appendix A: Webb Alignment Method DOK Level Definitions ... 72
Appendix B: The Webb Alignment Method ... 73
Appendix C: Achieve Alignment Method Definations ... 79
Appendix D: Achieve Alignment Method ... 80
Appendix E: SEC Alignment Method Cognitive Demand and Strand Definitions ... 86
Appendix F: Surveys of an Enacted Curriculum ... 88
List of Tables
Table 1: DOK Consistency for Formative and Summative Assessments... 39
Table 2: Categorical Concurrence of Formative Assessment and Summative Test ... 40
Table 3: Range of Knowledge for Formative Assessment and Summative Test ... 42
Table 4: Balance of Representation for Formative Assessment and Summative Test ... 44
Table 5: Content Centrality for Formative Assessment ... 47
Table 6: Performance Centrality for Formative Assessment ... 48
Table 7: Source of Challenge for Formative Assessment ... 48
Table 8: Range Levels for Item Sets on the Formative Assessment ... 49
Table 9: Challenge and Balance for Item Sets for the Formative Assessment ... 50
Table 10: Formative Assessment Indices for SEC Alignment Method ... 57
Table 11: Comparisons across Alignment Methods in Percentages ... 58
Table 12: Comparisons across Alignment Methods Cutoffs ... 58
Table 13: Comparison of Breadth Criteria across Methods on Formative Assessment ... 60
List of Figures
Figure 1: Content Maps for the Curriculum and Test in NYS ... 25
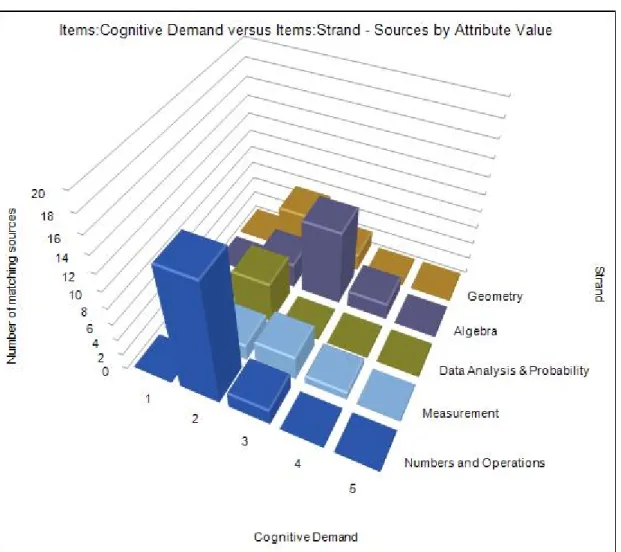
Figure 2: Content Map for the Formative Assessment ... 53
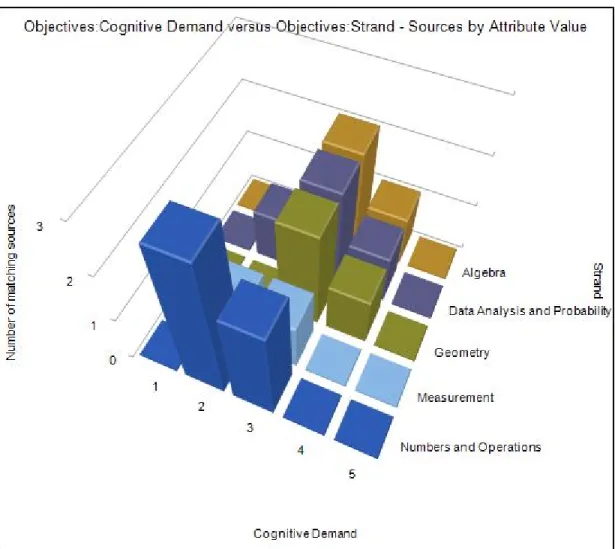
Figure 3: Content Map for Full NCSCoS (Full Standards) ... 54
Comparing Alignment of a State Test and District Formative Assessments with State Content Standards using Three Methods
The 2001 passage of No Child Left Behind (NCLB; Public Law 107-110) heightened the focus on accountability by mandating that states develop rigorous content standards and standardized tests to measure students’ academic progress. This emphasis on student achievement and teacher quality continues today with the initiatives of the Race to the Top Fund, the adoption of the Common Core State Standards, and the development of the Common Core Assessments in many states (Common Core, 2011; Common State
Assessments, 2011; U.S. Department of Education, 2011). Objective criteria for assessing the alignment of these standards and assessments are not widely agreed upon. Because content standards and performance standards vary across states, cognitive demands and stringency of passing requirements have remained idiosyncratic across the nation. With the current
movement toward national standards and assessments, the identification of agreed upon alignment criteria is critical for the successful implementation of the Common Core.
were meant to meet state-defined criteria for proficiency by the 2013-2014 school year. Under NCLB, schools, districts, and states are required to demonstrate that the number of students achieving the defined levels of proficiency increases each year (known as Adequate Yearly Progress or AYP) until all students have reached proficiency. If schools, districts, and states are not able to meet the set AYP goals, a system of consequences exists, such as loss of funding or restriction of local decision making and control. If these high-stakes decisions are made based on tests that are not aligned to the instruction and standards, there could be serious consequences for schools, including mislabeling of student performance and teacher job loss (Roach, Niebling, & Kurz, 2008).
Although NCLB mentions alignment dozens of times and states are mandated by NCLB to conduct alignment studies, the literature on the extent to which standards-based reform has resulted in coherence of standards, instruction, and assessments is thin (Polikoff et al., 2011). Webb (1997) defined alignment as “the degree to which expectations and assessments are in agreement and serve in conjunction with one another to guide the system toward students’ learning what they are expected to know and do” (p. 4). Several alignment models exist at varying levels of complexity (Bhola et al., 2003). These models will be examined and explained in depth in the next section of this thesis, but it is important to note that high complexity models, like the Webb and Achieve models, include several interrelated dimensions, such as content match, depth match, emphasis, and performance match.
Moderately complex models, like the SEC model, look at the relationship between cognitive demand and topic. Low complexity models, which were widely accepted before NCLB passed but are no longer commonly used, focus only on objective and item matching without accounting for cognitive demand and other criteria (Bhola et al., 2003). The Webb, Achieve, and SEC models are the three models examined in this study.
public officials who head departments of elementary and secondary education in states and other equivalent agencies. The organization provides leadership, advocacy, and technical assistance on major education issues (Lui et al., 2008). The goal of this research is to identify the strengths and weaknesses of the three models suggested for use by the CCSSO. Because the cohesiveness of standards, instruction, and assessments is essential for student learning to take place, this study will address three questions:
• Do district formative assessments align with the state content standards as measured by the Webb method, the Achieve method, and the SEC method? • In what ways do the three methods of aligning the formative assessments to
the state content standards produce different results?
• What is the alignment of a state test with the state's content standards as measured by the Webb method?
linking test items to academic standards. Evidence of strong alignment heavily influences the rationale and justifies the use of a particular test for a specific purpose.
This research will investigate the alignment of the formative and summative
assessments to a state's content standards. In order for student learning to occur, educational standards, instruction, and assessments must work in accordance with one another. Using formative assessments to track student achievement throughout the year, teachers are better able to understand students’ needs and design effective and differentiated instruction in preparation for the comprehensive summative state test, which is mandated for accountability purposes through Title I and the NCLB (Webb, Herman, & Webb, 2007). The formative assessments used throughout the year must be focused and information-rich in order to accurately formulate a picture of an individual student’s academic achievement and readiness for the annual summative test. Therefore, questions regarding the quality of formative and summative assessments are frequently asked by educators, policy makers, administrators, and parents.
should be able to know and do in order to be successful at any particular point in their PreK-12 experience.
In today’s standards-based and achievement-driven context, alignment must clearly communicate the degree to which assessments yield results that provide accurate and detailed information about students’ achievement in regards to academic content standards (Martone & Sireci, 2009). The assessment must adequately cover the content standards with the
appropriate depth, reflect the emphasis of the content standards, provide scores that cover the range of performance standards, allow all students an opportunity to demonstrate their
proficiency, and be reported in a manner that clearly conveys student proficiency as it relates to the content standards (Martone & Sireci, 2009). Another important consideration to
standards-based reform is high quality standards. Current state standards have been suggested to cover a wide variety of topics and content, but not place much emphasis or instructional intensity on content (Lui et al., 2008). In other words, the U.S. state standards are each extensive in breadth, but limited in depth (Roach et al., 2008).
In a review of the three commonly-used alignment methods, the Webb method provided the strongest quantitative information for evaluating alignment on multiple criteria, which is why the Webb method was chosen to examine the alignment of the summative test and formative assessments (Polikoff et al., 2011). The Achieve method provided the most useful narrative summary of alignment. The SEC method provided applicability to
of alignment research and applications. Whereas the summary included in this section is designed to be sufficient, the reader’s understanding of the methods is essential for the benefit of interpreting the future results. Summaries of all of the methods can be found at http://programs.ccsso.org/projects/Alignment_Analysis/.
Webb Alignment Method
The Webb alignment procedure is conducted in two phases, standards review and items review. During training, five to eight content-area experts are trained on the method including the operational definitions of a general standard, which is composed of a specific number of goals, which are comprised in turn of specific objectives (Webb, 2007). The reviewers are trained on depth of knowledge (DOK) levels and are encouraged to write notes about the quality of the standards or the items if there is an extraneous source of challenge in the item (Webb, 2007). Extraneous source of challenge includes student knowledge that is necessary to answer the item but is not relevant to the tested standards. For example, if the language in a mathematics word problem is not written at an appropriate grade level or a graph necessary to answer an item is not clearly labeled, the rater would note this as an extraneous challenge. Mean and standard deviations are reported for all reviewers’ ratings and discussed (Webb, 2007).
item, and link the items to corresponding curriculum objectives. The assessment is then judged along four dimensions: depth of knowledge consistency, categorical concurrence, range of knowledge consistency, and balance of representation. The training materials for this study were retrieved from the free web-based version of the Webb method, called the Web Alignment Tool (WAT), which is available at http://wat.wceruw.org/index.aspx. The current study uses a paper and pencil version of the WAT which, perhaps more time consuming on the part of the researcher, avoids potential loss of data and technological malfunction.
Depth of knowledge consistency. In Webb’s model, depth of knowledge consistency
requires that at least 50% of the test items corresponding to a given standard should be at or above the DOK level of the items’ corresponding objective (Webb, 2007). If the standard has between 40% and 50% of the items at or above the DOK levels of the objectives, then it is reported that the criterion is weakly met (Webb, 2007). The rationale for this cutoff is that if three of the six, or 50% of the items, are at or above the DOK level of the standard, then in order for a student to achieve a proficient score on the overall standard, he or she would be required to answer correctly at least one of the items at or above the DOK level of the standard (Webb, 2007). According to Webb (2007), DOK level 1 (recall) includes recalling information such as a fact, definition, term, or a simple procedure. DOK level 2
thinking) requires complex reasoning, planning, developing, and thinking, which most likely occurs over an extended period of time, and typically requires developing and proving conjectures, designing, and conducting experiments, or critiquing experimental designs (Webb, 2007).
Categorical concurrence. Categorical concurrence examines the extent to which at
least some element of each standard appears on the assessment. Webb (1997) specified that at least six items on the assessment should address each standard in order to indicate
acceptable categorical concurrence. A hit is used to designate that a reviewer has mapped an assessment item to an objective (Webb, 1997). Each item can have up to three hits, each to a different objective. The average number of hits assigned to each standard is meant to
describe the weight of information from the assessment in making judgments about a
student’s performance. The rational for the six-item cutoff per standard was developed using a procedure by Subkoviak in 1988 (Webb, 2007). Assuming the reliability for each item is 1.0, the estimated six items would provide an agreement coefficient of 0.63, which is somewhat acceptable according to Webb (2007). Webb does not encourage reporting scores on subscales of the test or by objective, because this agreement coefficient would be
mediocre (Webb, 2007). The reliability of 1.0 for each item assumes that the items are well designed, written clearly, and function similarly across the population (Webb, 2007)
Range of knowledge. Range of knowledge (ROK) suggests that at least 50% of the
comparable span of knowledge expected of students by a standard is the same as the span of knowledge that students need to correctly answer the assessment items. Having at least one item for each objective for at least half of the objectives under a standard provides a decision rule that ensures that the assessment is measuring some breadth in content knowledge and is at least sampling half of the most important partitions of content identified by the objectives (Webb, 2007). This assumes that a student’s knowledge should be tested on at least half of the domain of knowledge for a standard. This increases the likelihood that students will need to demonstrate knowledge on more than one objective per standard to achieve a minimal passing score (Webb, 2007). If 50% of the objectives have a matching item for a given standard, the ROK is met, but if only 40% to 49% have a match, ROK is weakly met (Webb, 2007).
Balance of representation. Balance of representation takes into account how the hits
are distributed among the objectives under a standard. A hit is defined as a match between an objective and an item. Balance of representation is calculated by summing the differences between the total number of objectives hit under a standard and the proportion of the hits assigned to each objective to the total number of hits for a standard. This calculation is subtracted from one. This formula results in the balance of representation index, which was formulated by Webb (1997). The index calculates the degree to which the distribution of hits for objectives within each standard is balanced across objectives under each standard, taking into account only objectives that have hits. The formula for the balance of representation index is
1 1
where O is the total number of objectives hit for the standard, is the number of items hit corresponding to objective k, and H is the total number of items hit for the content standard.
The index ranges from 0 to 1. A balance representation index of one, or near one, indicates that the assessment is well balanced across the objectives within a particular standard. A balance of representation index of zero, or near zero, indicates that the assessment is unbalanced in the distribution of hits (Webb, 2007). Assessments that are unbalanced lead to biased inferences about students’ ability. The index only considers objectives that have at least one hit. Therefore, objectives that do not have a matching item are not taken into the equation of balance. If all of the items assigned to a standard are evenly distributed among the objectives, then the index will be one. For example if a particular standard has 10 objectives, but only 7 objectives have hits and there are 12 hits distributed across the 7 objectives such that one objective has four hits, five objectives have one hit, and one objective has three hits; the formula for the standard would be calculated as such: 1 – (|1/7-4/12| + |1/7-1/12| +|1/7-1/12| +|1/7-1/12| +|1/7-1/12| +|1/7-1/12| +|1/7-3/12|)/2 such that 1 - 0.595/2 = 1 - 0.2975 = 0.7025. Index values greater than 0.7 are deemed acceptable and 0.6 to 0.7 indicate that balance is weakly met (Webb, 2007). According to Webb (2007), seven tenths was chosen as a cutoff because it indicates that the items are distributed among all of the hit objectives to at least some degree (e.g., every objective with a hit has at least two items).
not account. The Webb method was built on five different dimensions to understand the degree of alignment including content focus, articulation across grades and ages, equity and fairness, pedagogical implications, and system applicability (Webb, 1997). While the area of focus for the Webb tool is content, the Webb method is comprehensive in its item and objective level analysis, its view of alignment through four quantitative dimensions, and the proposed guidelines for acceptable minimum levels. Webb’s method does not take into account objectives that do not have hits; therefore, its alignment measures of range and balance may overestimate alignment (Martone & Sireci, 2009).
Applications of the Webb Alignment Method
Recent applications of the Webb alignment model have examined the importance of inter-rater agreement, differences across raters based on job title, the alignment of alternate assessments for students with special needs, and the alignment of assessments and standards across transitional years, such as high school to college or preschool to kindergarten. This section will provide a brief review of this literature relating to the current applications of the Webb method.
of all reviewers’ ratings was used. The results were considerably different when a minimum level of reviewer agreement was required. The authors suggested that requiring agreement on the objective and item level was too strict for categorical concurrence. Requiring a minimum level of reviewer agreement for an objective matching an item resulted in mixed results across the different tests and standards, varying from none of the standards meeting the ROK criterion to all of the standards meeting the ROK criterion. Whereas results for different tests and standards were mixed, the authors suggested that taking into account the reviewer agreement reduced the number of items and objectives taken into account and generally provided weaker alignment evidence than a case where all reviewers’ ratings were considered. Categorical concurrence and ROK were most influenced when taking into account reviewer agreement. When compared to each other, the selection of bare or clear majority made little difference in the results. Standards need to be clear, detailed, and
complete in order to match test items and the average of all reviewers’ ratings should be used in determining item and objective matches and DOK levels.
faculty. The 2001 Golden State Examination in High School Mathematics and the 1997 University of California Statement on Competencies in Mathematics Expected of Entering College Students (which is intended to give a clear picture of what students need to know and be able to do in order to be successful in college) were compared. To examine consistency among raters, kappa coefficients were calculated to determine inter-rater reliability, and generalizability analyses with items crossed with raters were conducted. Looking at categorical concurrence, kappa coefficients were .55 and .58 for faculty and teachers respectively. Teachers rated more items as multidimensional, which is defined as an item matching to more than one objective, than faculty. On average, teachers rated 45% of the test as multidimensional, and faculty rated only 26% of the test as multidimensional. Teachers tended to rate DOK higher than faculty. DOK is a difficult feature to rate because students’ developmental levels and teachers’ instructional experiences may play a role. Tremendous variation can result across 6-rater subsets of 20 raters. With modest training, 20 raters can achieve acceptable levels of agreement (Bhola et al., 2003).
applied the Webb method to three state alternate assessments for students with special needs in mathematics and ELAR and found that none of the alternate assessments met the
recommended levels of alignment criteria. Two of the three assessments were portfolio-based and one was performance-based. Because the performance-based assessment demonstrated the best alignment to the state standards, the Webb method may not work well for alignment information regarding portfolio-based assessments and works slightly more than not at all for constructed-response, performance-based assessments (Flowers et al., 2006).
Studies have been conducted comparing the alignment of assessments and standards vertically across transitional years for high school to college and preschool to kindergarten. Brown and Niemi (2009) found that the California Standards Tests in ELAR demonstrated sufficient alignment with the California Community College placement objectives as measured by two placement exams used in community colleges; however, the mathematics test showed adequate alignment values only with respect to DOK consistency and balance of representation, falling short in categorical concurrence and ROK. These findings for
mathematics indicated that high school standards and assessments are not consistent with college expectations for success (Brown & Niemi, 2009).
Using a modified Webb alignment method to examine the Indiana Kindergarten content standards and the items on the Indiana Standards Tool for Alternate Reporting (ISTAR) which is available in five versions to monitor development throughout ages birth to five, Roach et al. (2010) found that the ROK was adequate across assessments, but the
kindergarten standards across the assessments. DOK consistency was weakly met across assessments.
These studies show the breadth and depth of the application of the Webb method and some of its shortcomings. The Webb model provides in-depth quantitative descriptive information that can be used to provide evidence of test validity. Despite limitations, the Webb method continues to provide important information about alignment to assessment developers, educators, policy makers, and researchers. Because the quality and quantity of standards, objectives, and test items influences alignment results, well written items and objectives are essential to make accurate judgments about test alignment from Webb’s method.
Achieve Alignment Method
The Achieve model was developed in 1998 at the Learning Research and
Development Center at the University of Pittsburgh. Achieve, Inc. is an independent and bipartisan organization created by governors and chief executive officers. The Achieve model has been used in 14 states to assess the overall quality of the tests and alignment to state standards (Roach et al., 2008). The Achieve method uses both quantitative and qualitative alignment comparisons of the assessment and the standards based in a specific subject area including ELAR, mathematics and science. The Achieve method was developed to provide a story of alignment designed around three questions (Resnick, Rothman, Slattery, & Vranek, 2004):
• Does the assessment measure only content and skills reflected in the standards? • Does the assessment fairly and effectively sample the important knowledge and skills
• Is the assessment sufficiently challenging?
The Achieve method starts with accessing or creating a test blueprint to map the items to the objectives (Resnick et al., 2004). The test blueprint is developed by a senior reviewer. The senior review is someone who was involved the test development or has extensive experience with the test and standards. When the senior reviewer maps the items back to the objectives, potential for human error by raters called subject-matter experts (SMEs) is minimized and the purpose of the test is validated (Roach et al., 2008). The test blueprint allows for a comparison of the intentions of the assessment and what the
assessment actually accomplishes (Resnick et al., 2004).
The alignment of each individual item is assessed in relation to the standards, and then the extent to which the test as a whole adequately measures the set of standards is examined (Resnick et al., 2004). First, individual items are judged by SMEs for their content centrality, performance centrality, and source of challenge. Next sets of items for each standard are examined for content centrality, performance centrality, challenge, balance, and range. The Achieve method does not have clear cut offs for each dimension, but rather focuses on the holistic picture of alignment (Resnick et al., 2004).
Content centrality. The degree of the match between an item and an objective is
measured with content centrality. SMEs evaluate the quality of the item and objective matches, which are done prior to the alignment study in the test blue print. SMEs rate a 2 for
clearly consistent, 1A for not specific enough meaning the standard or objective is too broad
information about the intended purpose of the items. SMEs scores are averaged. Like the Webb method, an item can be mapped to two objectives on the blue print, or SMEs can indicate that they believe the item measures other objectives. With the use of the Likert scale previously described, the Achieve method allows SMEs to rate an item as only measuring part of the objective. The way in which items are coded in the Achieve method provides analysts with more information regarding the quality of the items and objective matches compared with the Webb method, which only asks raters to make a match, not judge the quality of the match.
Performance centrality. Performance centrality indicates the extent to which the
item’s cognitive demand level matches the level specified in the objective (Roach et al., 2008). According to Roach et al. (2008), cognitive demand refers to the type of thinking required to successfully complete the item. The SMEs have to decide whether the test item demands the same type of performance task as the related objective. Levels of cognitive demand include Level 1 (recall), Level 2 (application/skill), Level 3 (strategic thinking), or Level 4 (extended analysis). Performance centrality focuses on the match between the performance called for in the objective and the performance that the item is intended to measure. Performance centrality is also measured with a Likert scale with a rating of a 2 for
clearly consistent, 1A for not specific enough meaning that the objective is too broad to be
sure of the item’s alignment, 1B for somewhat consistent meaning that the objective uses more than one verb, but the item matches only one verb, or 0 for inconsistent (Roach et al., 2008).
Challenge. Challenge, which is the extent to which the item has a range of difficulty
students. Looking at item sets (all of the items linked to a particular standard), the source of challenge is measured to confirm that the items are constructed fairly and measure the intended construct. For both items and items sets, reviewers assess source of challenge, with the assignment of 1 for appropriately difficult or 0 for inappropriate for grade level. If an item scores a 0 for both content and performance centrality, then it is automatically rated a 0 for source of challenge (Roach et al., 2008).
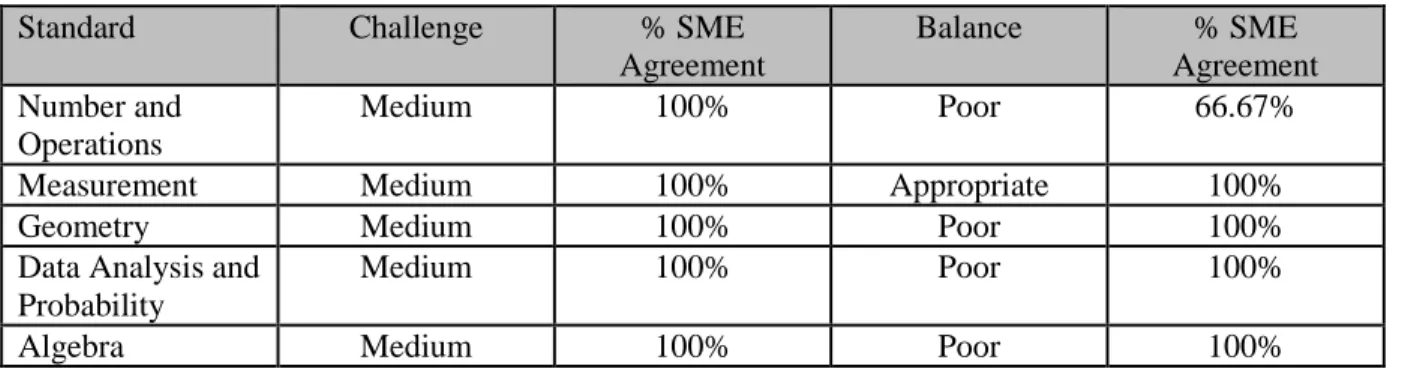
Range and Balance. After assessing the item level, SMEs continue to evaluate the
test as a whole, looking at the extent to which item sets cover the range of content from the standards and the extent to which emphasis is balanced across topics. Item sets are created with all items relating to a particular standard. Range is expressed as the proportion of objectives assessed by at least one test item and thus represents a basic indicator of overall coverage (Roach et al., 2008). The range of the items should present simple to complex items. Range is a quantitative measure of the proportion of the objectives within a standard that are measured by at least one item. Range is expressed as the fraction of the total
objectives under a standard that are assessed by at least one item. According to Resnick et al. (2004), ranges from 0.50 to 0.66 are acceptable and above 0.67 are considered good.
Looking at the item sets, balance is a measure of how well particular content and skills in the items reflect the emphasis that the standard and its related objectives require. Looking at item sets, SMEs are asked to make qualitative judgments as to whether a set reflects the corresponding standard’s emphasis on content and skills along two questions (Roach et al., 2008):
• What objectives in a standard seem to be over-assessed?
Reviewers evaluate each question from two perspectives: (a) their reading of the
standards; and (b) their personal judgments of what is most relevant for the particular grade level. Balance judgments fall into four categories: good, appropriate, fair, or poor (Roach et al., 2008). Sets of items are further evaluated on their level of challenge, a global judgment on the test’s overall difficulty according to assessed concepts and cognitive demands placed on students. Reviewers make qualitative judgments regarding the cognitive demands of an entire set in relation to the demands specified in the matching standards, as well as if items skew toward more or less challenging concepts, types, or parts of objectives. The level of challenge for sets of items is rated as easy, medium or hard. A short written evaluation by each SME on each item set’s level of challenge concludes the alignment process (Roach et al., 2008).
Application of the Achieve Method
Perhaps because of the extensive qualitative nature of the Achieve method and because versions to collect data regarding the criteria are not available online, the Achieve method is not widely used in research. Achieve method literature has found that assessments and standards are not well balanced (Resnick et al., 2004). Whereas individual items tend to align well to the standards, the tests, when looked at holistically, are not well aligned
mathematics exam and the state’s academic standards, reviewers were assigned to either matching as specified in Webb method or rating as specified in the Achieve method
(D’Agostino, Walsh, Cimetta, Falco, Smith, VanWinkle, & Powers, 2008). SMEs practiced rating the alignment between items and objectives as consistent, somewhat consistent, or not
consistent in three separate areas: content, intellectual skill, and overall match. Raters in the
Webb method focused on both the content and intellectual challenge while matching items and objectives. According to D’Agostino et al. (2008), when comparing the two methods, a moderate correlation was found between Webb’s overall match and Achieve’s overall rating scores (r = .59). The item alignment decision agreement between the two methods converged moderately (kappa = .39). Eighty percent of the items, 32 out of 40 items, received similar alignment scores across the two methods. Matching error occurred for 2 of 40 items or 5% of the time in Webb’s method. Matching is more flexible in Webb’s model because the rater can link objectives to an item based on their judgment. Rating in the Achieve model is less susceptible to error because the items are already linked, and the raters evaluate the quality of that link, which saves them time in searching through the standards.
D’Agostino et al. (2008) concluded that rating seems most suitable for confirming the quality of the test specifications; whereas, matching can be used to confirm specifications or explore other possible item-objective connections that were not included in test
Surveys of an Enacted Curriculum (SEC)
The Surveys of an Enacted Curriculum (SEC) method, also known as the Porter method (Fulmer, 2011), provides information for teachers and other stakeholders about the intended, the enacted, and the assessed curriculum (Kurz et al., 2010). The SEC method is the only method designed to take into account factors of alignment beyond assessments and standards. The intended curriculum is specified in the content standards for a particular subject or grade level. The content of instruction delivered by classroom teachers designates the enacted curriculum. Because the SEC reviewers map the alignment elements to a
common framework, the SEC method can be used to analyze a variety of elements depending on purpose of alignment. Elements of alignment analysis can include comparisons across assessment, standards, curriculum, instruction, and student input (Kurz et al., 2010; Polikoff et al., 2011). The SEC results in a single statistic and a graphical output of alignment called a content map. The framework on which the content is graphed is represented with more general, big picture topics related to the elements of alignment. The content maps provide information on the depth of cognitive ability and coverage of topics. For the purposes of this study, the following review of the literature will focus on using the SEC method to compare topic coverage and cognitive demand for only assessments and standards. The uses and applicability of the SEC outreach the scope of this review.
represented as a matrix of proportions, where the proportion in each cell (topic and cognitive demand) indicates the proportion of the total content in the document that emphasizes that particular combination of topic and cognitive demand (Lui et al., 2008). The matrices for standards and assessments are compared, cell by cell, and an alignment index is calculated, indicating the proportion of content in common (Lui et al., 2008).
The SEC method assesses alignment by calculating the Porter index (Lui et al, 2008). For the purposes of this study, the SEC method will result in two content maps, one
representing the alignment between the topics and cognitive demands required for the formative assessments and one content map for the content standards. To make the content maps comparable, all cell values are standardized, that is converted into ratios totaling to 1. The rows and columns in the content maps visually represent relative emphasis of different topics and cognitive demands.
Survey. The SEC is typically comprised of three main alignment dimensions: (a)
content match, which can be difficult to manage so the analysts should keep topics broad; (b) expectations for student performance or cognitive demand; and (c) instructional content, which asks teachers to self-report how much time is spent on each topic (Martone & Sireci, 2009). According to Martone and Sireci (2009), three or more SMEs are needed to complete the alignment ratings. Cognitive demand is a common dimension by which elements are scored; teachers are asked to identify items and standards as (a) memorize; (b) perform procedures; (c) communicate understanding; (d) solve non-routine problems; or (e)
least five teachers and conduct a generalizability study to see if the raters are reliable (Martone & Sireci, 2009).
Output. On a graphical matrix with two axes, each cell-by-cell unit analyzed is a
proportion of the whole. The alignment index is the sum of all the cell-by-cell intersection points and expresses alignment as a matter of degree, rather than an absolute. Content data from each survey is reduced to cell by cell proportions with the sums across all rows and columns equaling 1.00. The sum of all ratings for a particular content map for K-12 mathematics consists of cells in columns by topics with the sum of all ratings across cells equaling 1.00. The SEC method provides categorical concurrence (which looks at matching topics), balance of representation (which is a measure of relative emphasis of topic
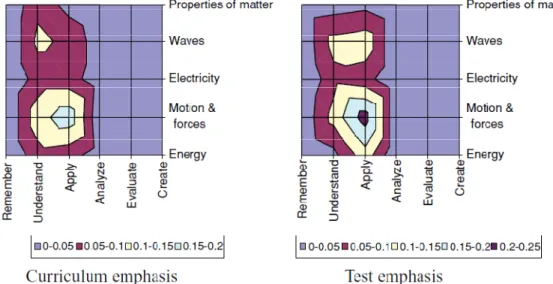
Figure 1: Content Maps for the Curriculum and Test in NYS
Figure 1. Adapted from “Alignment between the physics content standard and the
standardized test: A comparison among the United States-New York State, Singapore, and China-Jiangsu,” by X. Liu, B. Zhang, L. Liang, G. Fulmer, B. Kim and Y. Haiquan, 2008,
Science Education, 93, p. 787.
The content maps in Figure 1 depict the relationship between the topics on the y axis and the cognitive demand on the x axis for the curriculum and test in physics. The pictorial analysis demonstrates that both the test and standards do not address cognitive levels above the level of analysis and focus primarily on understanding and application. Given the
information in Figure 1, comparisons can be made between congruent intersection points on the content maps. For example, the dark purple area on the test emphasis content map indicates that between .20 to .25 percent of the items assess motion and forces at the
standards do not place emphasis on application of concepts related to waves and place a less concentrated focus on application of concepts related to motion and forces. This information could help state curriculum and test developers create more rigorous curriculum and more aligned tests. The test and the curriculum in this analysis could focus on higher order
thinking skills such as analyze, evaluate and create, of which none are currently addressed in the curriculum and the test (Lui et al., 2008).
Index. Because Porter’s index is determined independent of standards and
assessments and each document is coded with the same rubric, policy makers are able to make decisions about the degree of alignment across multiple jurisdictions, not limited to tests and standards. Virtually any two categorical variables can be included in Porter’s method, such as language complexity or gender neutrality (Kurz et al., 2010). The Porter method has relative simplicity in calculation and broad application compared with other methods. Looking at the two frequencies across content maps and producing a single alignment index, ranging from 0 to 1, which indicates how closely the distribution of points in the first table, for example relating to standards, aligns with the second table, perhaps relating to the assessment. The index (P) is determined by creating a table of frequencies for the two documents being compared, which are labeled A and B. For each cell in tables A and
B, a ratio of points in the cell with the total number of points in the respective tables is
tables, a and b. The total number of cells in the table is called N = (J ∗ K). The alignment
index is then computed used the following equation (Fulmer, 2011):
1 ∑∑ 2
A greater number of cells in the table will yield a range of likely values that is lower than for tables with fewer cells. As the number of cells increases, there is much more room for discrepancy between the ratios, and the values for the index are likely to be lower (Fulmer, 2011). It is difficult to know whether a higher or lower alignment is meaningful or is a consequence of the table size, which highlights the need for established criteria for assessing the strength of alignment indices (Fulmer, 2011). Analyzing the results of 5,000 random alignment calculations, the mean alignment index was higher for tables of greater size, and the mean index was lower in cases with fewer points in the standards. Fulmer (2011) identified the mean and critical values for alignment indices and reexamined observed alignment values from previous research using these criteria. The results provided
researchers and policymakers the first opportunity to draw conclusions as to whether or not observed alignment indices differ significantly from what could occur by chance. The average alignment index that might occur by chance is dependent on the size of the
frequency tables being compared and the number of test items or standards involved in the comparison. Any effort to gauge the strength of alignment is affected by the scoring rubric that is used to code the test items or other document (Fulmer, 2011).
Application of the SEC Model
statistically significant alignment between the test and standards in New York, but not for China and Singapore. Both physics tests from China and Singapore shifted toward higher cognitive skills by de-emphasizing lower level cognitive skills and emphasizing higher level skills. It is not simply coverage of topics that is predictive of student achievement on
standardized tests, but coverage and a focus on cognitive emphasis together that predict students’ performance (Lui et al., 2008). The differences found may be a result of the various test formats across the nations. The researchers suggested that the curriculum in the United States as a whole is unfocused and does not promote depth of coverage and requires too many understandings (Lui et al., 2008).
In another study, Kurz et al. (2010) applied the SEC alignment methodology to examine differences in alignment between instructional content and state standards for eighth-grade general and special education mathematics teachers. Teachers reported on their instructional content coverage via an online or paper and pencil survey, done retrospectively at the end of the year. The SEC survey was completed at three points—at the beginning of the year to assess the planned curriculum, mid-year to measure the enacted for first half of year, and at the end of the year to measure the entire school year enacted. Using formative assessments throughout the year, which were aligned the curriculum according to an outside publisher, gain scores were calculated for each group of students. The findings did not suggest significant differences in the general and special education teachers planned and enacted curriculum. Low alignment indices were found across the board for general and special education teachers looking at a sample of 18 teachers.
subjects were compared (Polikoff et al., 2011). Content maps were generated using
Microsoft Excel, which resembled topographical maps where specific topics were displayed as lines of latitude and cognitive demands as lines of longitude. This provided a visual record of the content contained in the particular standards document or assessment that can be used to compare the content of standards or assessments within or between the states. Across the 19 states the average test-standards alignment index was .19, indicating that 19% of the content was shared between tests and standards (Polikoff et al., 2011). The average alignment index was slightly higher for mathematics at 0.27 and science at 0.26. The alignment of state standards with assessments of student achievement was typically in the range of 0.20 to 0.30. These results may be under-estimating alignment, because the number of items on the test and the number of cells influences alignment results in the SEC method (Polikoff et al., 2011).
Polikoff et al. (2011) suggested that there was no apparent pattern in misalignment across grades. About 24% of test content in grade 3 through 8 was at the wrong level of cognitive demand, and across grades 3 through 12, the right topic and wrong cognitive demand levels were closer to 51% in mathematics (Polikoff et al., 2011). When cognitive demand was ignored, agreement increased on average to 0.80. In mathematics 34% of standards were typically not tested at all, 52% for ELAR and 23% for science. About half of the content in mathematics and science standards and two-thirds in ELAR were misaligned with test content. In mathematics the standards tended to place a greater emphasis on the two highest levels of cognitive demand, and the average alignment indices for state standards and assessments were below .30 in mathematics and science and below .20 in ELAR. No
was some consistency across states in what was over and under-tested across the included subjects. This review demonstrates the broad uses and applications of the SEC method, which results in less complex alignment results but can be applied to a broader range of contexts compared to the Webb and Achieve methods.
Issues and Future Directions
According to Bhola et al. (2003), some generalizable issues arise when using
alignment models. Many objectives are multidimensional, and the items that are identified as corresponding only focus on one dimension within an objective. For example an objective may specify the use of whole numbers, fractions, and ratios, and an item corresponding to that objective may only represent the use of whole numbers. This makes rating and matching items to objectives difficult. A second issue relates to students of various levels needing an opportunity to demonstrate a range of levels of proficiency. The items for a particular standard must span a wide range of difficulty to permit students throughout the proficiency continuum to demonstrate their ability. Having enough items to accurately classify students into performance criterion and adequately cover all standards is very difficult. A third issue is that alignment may be influenced by content area. A review of Nebraska’s content standards and assessments found that in science, no objective had more than three aligned items, but almost every objective was covered. On the other hand, most social studies objectives had no items corresponding but had some objectives which were heavily hit. A fourth issue relates to training, which is difficult because many teachers tend to be expansive in their decisions of what constitutes a content match. All of these limitations apply to this study.
alignment studies in order to make suggestions for the new Common Core State Standards (CCSS) and assessments, which are currently being developed. Using the SEC method, Porter, McMaken, Hwang, and Yang (2011) found a lack of alignment between the Common Core State Standards (CCSS) and state standards and assessments. Beach (2011) wrote a response to Porter et al.’s findings stating that the CCSS focused on argumentative writing and expository text to a greater extent than current state standards. Substantive curriculum and instructional changes will need to take place over the next few years in order for
Method
In a suburban North Carolina district, teachers in grades three through five are provided with formative assessments to assess student achievement according to the North Carolina's content standards, called the North Carolina Standard Course of Study (NCSCoS). The NCSCoS provides specific goals, standards, and objectives for each area of study. The formative assessment results are used to guide instruction in preparation for the North Carolina End-of-Grade Tests (EOGs) and are common across the district, meaning each school uses the same assessment. The EOGs measure student achievement in the areas of math and reading for students in grades three through five. Therefore, in order for the system to work coherently, the NCSCoS, the formative assessments, and the EOGs must align to one another. In this study, alignment methods including the Webb method, Achieve method, and the SEC method were used to measure the level of connection between the NCSCoS with the formative assessments. In order to understand how the alignment of the formative
assessments compared to the alignment of the EOG, an additional alignment study was conducted between the NCSCoS and the EOG using the Webb method.
were implemented in 2003. The third quarter 2010-2011, district, grade four, mathematics formative assessments were compared to the NCSCoS using the three alignment methods. Use of the formative assessment system was required by the district for all third through fifth grade teachers in the district during the 2010-2011 school year. This study examines the alignment between the formative assessment and the full NCSCoS, as well as the district-specified third quarter mathematics standards, which were obtained from the district pacing guide. The formative assessment is meant to only measure student knowledge associated with a subset of the content standards for the entire year. Thus, for this study, only the third quarter, specified standards were included in the formative assessment. The district-specified standards are a subset of the full NCSCoS, excluding a total of four objectives from the full standards. The excluded four objectives are meant to be taught during other quarters throughout the school year.
Participants were recruited from a North Carolina school and from the researcher’s university. Upon receiving permission from the district and school principal and upon IRB approval, the researcher sent recruitment information via email to the staff at a local school and requested participation from individuals with experience teaching fourth grade
students in education participated in the study. Current teaching assignments included three fifth grade teachers, two fourth grade teachers, one third grade teacher, and one high school science teacher. Four of the six teachers had experience teaching fourth grade mathematics. The teachers included one first year teacher, one fourth year teacher, one sixth year teacher, one ninth year teacher, and two teachers with over ten years of experience. All teachers taught in the district where this study’s formative assessments were used and were familiar with the assessments. Graduate students included two master’s students in educational psychology, one master’s student in the early childhood, special education, and literacy, one doctoral student in social foundations of education, one doctoral student in educational psychology, and one doctoral student in the early childhood, special education, and literacy. Among the graduate students, three had no experience teaching at the K-12 level; one taught third grade for two years; one taught middle school mathematics for six years; and one taught high school English as a Second Language for one year.
The researcher met with participants in their alignment groups and conducted a 30-minute training, which included calibration on the appropriate alignment method. Following the training, teachers rated 49 items if assigned to the Achieve or SEC method and 99 items if assigned to the Webb method. The researcher remained at the alignment session to clarify directions if questions arose. The data were collected in pencil-and-paper form from the participants and entered into an Excel document by the researcher. The forms and definitions that were used for data collection can be found in the Appendices A through F.
reviewed the objectives and reached consensus on the DOK levels. The panel then
independently rated the DOK levels and matched objectives to each assessment item on the summative EOG and formative assessments, using a common data collection instrument developed by the researcher (see Appendix B). Categorical concurrence, ROK, balance of representation, and DOK consistency were calculated by the researcher based on the participants’ responses. The participants in the Webb session included one teacher and five graduate students. The session occurred over a three hour period at a university restaurant. Participants were given snacks, drinks, and a ten dollar restaurant gift card. Participants were permitted to discuss items with each other if they had concerns or questions.
encouraged to discuss rating throughout the session, but were not required to reach
consensus, which would typically be required in an Achieve session, due to time constraints. The Achieve session lasted for two and a half hours at a local elementary school after the instructional day ended. Participants were given pizza, drinks, snacks, and the researcher volunteered to help in the teachers’ classrooms for a day following the session. The forms used to collect the Achieve data can be viewed in Appendices C and D. The full form including the test blueprint is not included due to formatting considerations, but is available upon request from the researcher.
Results
In this section, the results for the Webb, Achieve, and SEC method will be reported and compared. The first research question focuses on the alignment of the formative assessment with the state content standards as measured by the Webb method, Achieve method, and SEC method. These findings will be reported after describing the results for the three methods. The second research question investigates how the alignment results compare across methods, which will also be assessed after reporting the results for the three methods. The third research question focuses on the alignment of the summative test to the state content standards using one method, the Webb method. To answer the third research
question, the results from the Webb method for summative test will be reported as part of the results for the Webb method. After reporting the Webb, Achieve, and SEC results, the first and second research questions will be answered by examining and comparing the results across methods.
Webb Results for the Formative Assessment and Summative Test
The results for each test item in the Webb method consist of the majority responses across the six raters trained in the Webb method. The primary match was decided based on the clear majority response of the raters. In all cases, a clear majority for the primary match was attainable. The secondary match was decided based on the majority secondary response of the raters. If no clear majority response was indicated, a secondary match was not
item’s assignment of DOK indicated a standard deviation above 1 (item 26); therefore, the small standard deviations indicate that assignment of the DOK levels was somewhat consistent among raters. On the summative assessment, four items’ assignments of DOK indicated standard deviations above 1 (items 15, 16, 29, and 48), suggesting that there was not as much agreement on DOK level assignments on the summative test as there was on the formative assessment.
DOK Consistency. DOK Consistency examines the extent to which the DOK levels
of the items match or are above the DOK levels of the corresponding objectives. DOK consistency is met acceptably if at least 50% of the items corresponding to an objective are written at or above the DOK level of the objective. DOK is weakly met if between 40-49% of the items corresponding to an objective are written at or above the level of the objective. Finally, if less than 39% of the items are written at or above the DOK level of the
corresponding objective, the DOK consistency is considered unacceptable. After comparing individual item and objective matches and indicating whether the item was written below, at, or above the DOK level of the objective, the DOK consistency for the formative assessment was examined by standard, which is shown in Table 1. The results in Table 1 demonstrate that when compared to the full NCSCoS and the district-specified standards for third quarter, the formative assessment exhibits acceptable levels of DOK consistency on all standards with the exception of the geometry standards. The summative test demonstrated acceptable
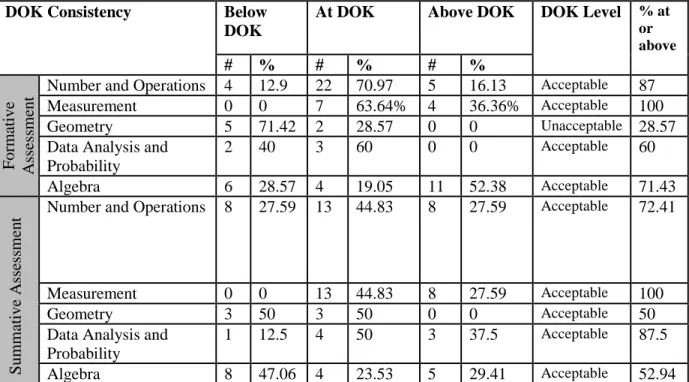
Table 1: DOK Consistency for Formative and Summative Assessments
DOK Consistency Below DOK
At DOK Above DOK DOK Level % at or above # % # % # % F or m at ive A ss es sm ent
Number and Operations 4 12.9 22 70.97 5 16.13 Acceptable 87
Measurement 0 0 7 63.64% 4 36.36% Acceptable 100 Geometry 5 71.42 2 28.57 0 0 Unacceptable 28.57 Data Analysis and
Probability
2 40 3 60 0 0 Acceptable 60
Algebra 6 28.57 4 19.05 11 52.38 Acceptable 71.43
S um m at ive A ss es sm en
t Number and Operations 8 27.59 13 44.83 8 27.59 Acceptable 72.41
Measurement 0 0 13 44.83 8 27.59 Acceptable 100
Geometry 3 50 3 50 0 0 Acceptable 50
Data Analysis and Probability
1 12.5 4 50 3 37.5 Acceptable 87.5
Algebra 8 47.06 4 23.53 5 29.41 Acceptable 52.94
In short, these results suggest that the summative assessment is slightly more aligned to the standards with regard to DOK consistency than the formative assessment. With only 28.57% of the geometry items measuring at the DOK levels of the objectives, the DOK for the geometry items needs to be improved before teachers can make conclusions about what students know about geometry in preparation for the summative test, which has 50% of the items written at the DOK level of the objectives.
Categorical Concurrence. Categorical concurrence measures the extent to which at
achieving acceptable categorical concurrence for the standard. On the other hand, if the item was linked to two objectives across two different standards, the item counted as one item for each corresponding standard. In other words, items corresponding to two objectives under the same standard counted as one item in this analysis. Items corresponding to two objectives under different standards counted as two items in this analysis or one item for each standard. This decision was made so as to not overestimate categorical concurrence. Overestimation of categorical concurrence may have resulted if one item with two objectives within one
standard qualified as two items for one standard. Looking at the formative assessment results presented in Table 2, the categorical concurrence results for both tests were overall
acceptable. The results listed in Table 2 for the formative assessment are compared to the district-specified NCSCoS, but the results were very similar when comparing to the full NCSCoS and the district-specified third quarter standards.
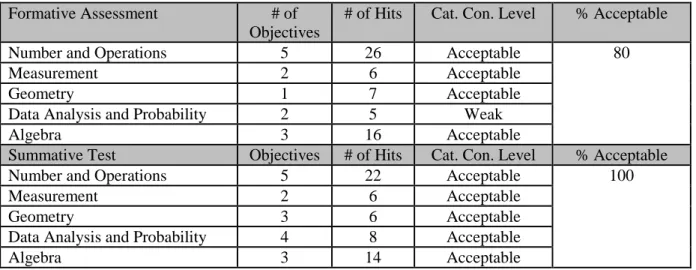
Table 2: Categorical Concurrence of Formative Assessment and Summative Test Formative Assessment # of
Objectives
# of Hits Cat. Con. Level % Acceptable
Number and Operations 5 26 Acceptable 80
Measurement 2 6 Acceptable
Geometry 1 7 Acceptable
Data Analysis and Probability 2 5 Weak
Algebra 3 16 Acceptable
Summative Test Objectives # of Hits Cat. Con. Level % Acceptable
Number and Operations 5 22 Acceptable 100
Measurement 2 6 Acceptable
Geometry 3 6 Acceptable
Data Analysis and Probability 4 8 Acceptable
Algebra 3 14 Acceptable
To summarize, the results for categorical concurrence shown in Table 2 indicate that all of the standards were met at the acceptable level on the summative test, but 80% of the standards were met at the acceptable level on the formative assessment. If the criteria
probability standard in order to achieve acceptable categorical concurrence with the expectation of a minimum of six items. However, the expectation of six items for each standard is somewhat arbitrary because some of the standards have more objectives, which may necessitate more items. While the formative assessment is close to make the six item cutoff for all standards, the need for a minimum of six items may contribute to the
overestimation of the alignment with the Webb method. Whereas, it makes sense that at least six items are necessary to make a conclusion about a student’s knowledge relating to a standard, some standards may require more than six items because of the structure or the number of the objectives.
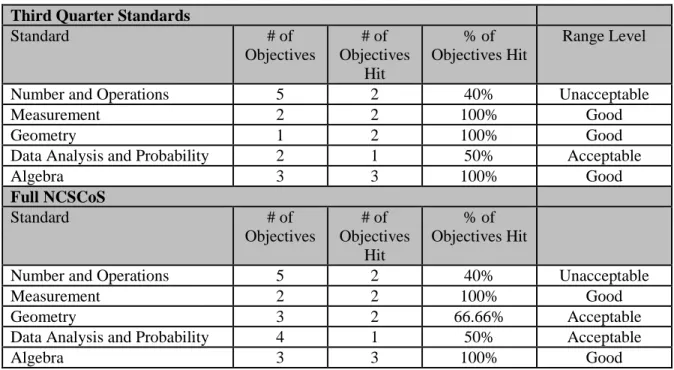
Range of Knowledge. Range of knowledge examines the relationship between the
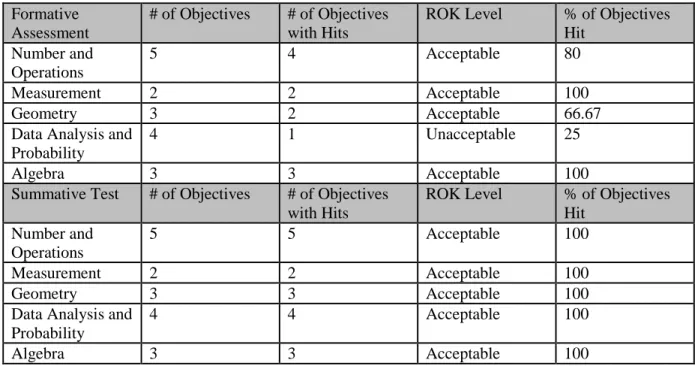
Table 3: Range of Knowledge for Formative Assessment and Summative Test Formative
Assessment
# of Objectives # of Objectives with Hits
ROK Level % of Objectives Hit
Number and Operations
5 4 Acceptable 80
Measurement 2 2 Acceptable 100
Geometry 3 2 Acceptable 66.67
Data Analysis and Probability
4 1 Unacceptable 25
Algebra 3 3 Acceptable 100
Summative Test # of Objectives # of Objectives with Hits
ROK Level % of Objectives Hit
Number and Operations
5 5 Acceptable 100
Measurement 2 2 Acceptable 100
Geometry 3 3 Acceptable 100
Data Analysis and Probability
4 4 Acceptable 100
Algebra 3 3 Acceptable 100
To sum up, the results for range of knowledge shown in Table 3 indicate that the summative test covers the objectives under each standard better than the formative assessment. Requiring 50% as general cutoff for acceptable seems like a generous expectation for range, which could also contribute to overestimating alignment with the Webb method. In the researcher’s opinion, all objectives included on the standards should be measured by at least one item on the formative and summative test. The summative test accomplishes this with 100 % of the objectives acquiring hits; however, the formative assessment does not accomplish full coverage of all of the objectives for the third quarter standards or the full standards. The formative assessment clearly does not measure enough breadth across the objectives with only two standards meeting 100% coverage.
use fractions to solve many items. The NCSCoS specifies using fractions as a component of objective 1.03. In order for the formative assessment and summative test to work coherently, the tests must focus on similar cognitive demand and skills, or the formative assessment must include at least as challenging or preferably more challenging items compared to the
summative test, which would secure student success on the summative test by engaging students to more challenging material and instruction than they would see on the summative test. At the most basic level, the formative assessment needs to emphasize fractions to same extent that the summative test emphasizes fractions, and the Webb method does not measure this emphasis, which could drastically affect how students perform on the summative test. If students are prepared for the summative test using the items on the formative assessment and instruction is tailored for students around their performance on the formative test, then the students will be missing the important basic instruction relating to fractional concepts and the system will not be working coherently to ensure student success.
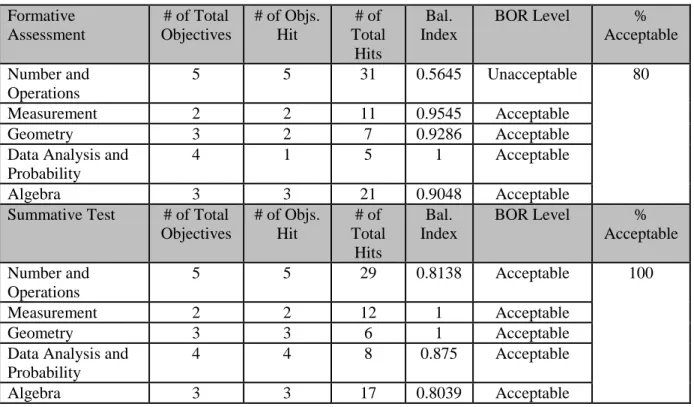
Balance of Representation. The results for balance of representation take into
standard has a balance of representation index over .70, the standard is considered to be met at an acceptable level.
Table 4: Balance of Representation for Formative Assessment and Summative Test Formative
Assessment
# of Total Objectives
# of Objs. Hit # of Total Hits Bal. Index
BOR Level % Acceptable
Number and Operations
5 5 31 0.5645 Unacceptable 80
Measurement 2 2 11 0.9545 Acceptable
Geometry 3 2 7 0.9286 Acceptable
Data Analysis and Probability
4 1 5 1 Acceptable
Algebra 3 3 21 0.9048 Acceptable
Summative Test # of Total Objectives
# of Objs. Hit # of Total Hits Bal. Index
BOR Level % Acceptable
Number and Operations
5 5 29 0.8138 Acceptable 100
Measurement 2 2 12 1 Acceptable
Geometry 3 3 6 1 Acceptable
Data Analysis and Probability
4 4 8 0.875 Acceptable
Algebra 3 3 17 0.8039 Acceptable
As shown in Table 4, for the balance of representation the standards are met at the acceptable level in the summative test, but 80% of the standards meet the acceptable cutoff for the formative assessment. This suggests that the items corresponding to number and operations are weighted more heavily toward some objectives and are not fairly distributed across hit objectives. The serious limitation of this index is that it only includes hit objectives in its calculation. This works acceptably for the summative test because 100% of the
assessment indicate the items for the hit objectives are not distributed evenly across the objectives under a standard.
In order to answer my third research question about the comparison of the alignment of the formative assessment and summative test to the state standards, the Webb method suggests that the summative test is well aligned to the NCSCoS and that the alignment of the formative assessment and NCSCoS is acceptable. The Webb method misses a few very important characteristics of alignment. For example, while the NCSCoS specifies that students must be able to use fractions, the formative assessment does not include any items related to the use of fractions. Yet, the majority of the items on the summative test require the use of fractions. Students who do not understand fractions will likely not be equipped for success on the summative assessment. If instruction is tailored using the formative assessment, concepts relating to fractions might not be taught sufficiently. Lastly, for the standard of algebra on the formative assessment, more than 50% of the items are written above the DOK level of the objective. This suggests that some of the algebra items are written at a level that is not appropriate for measuring the algebra objectives specified in the standards. Webb does not account for this distinction in his method.
Achieve Results
averaged and rounded to the nearest whole number to find content centrality, performance centrality and source of challenge scores. The standard deviations across the SMEs for each criterion were calculated. Standard deviations were all below 0.577, indicating that at least 2/3 of SMEs agreed on most items across the criteria. The raters assigned item sets, which included all items pertaining to a standard, an overall judgment score for balance (poor, fair, appropriate, good) and level of challenge (easy, medium, hard). The range was calculated for item sets by dividing the number of objectives under a standard hit with at least one item by the total number of objectives listed under a standard in the NCSCoS. Range in the Achieve method is an expression of the portion of the standards represented by at least one item on the test.
Content Centrality. The item ratings for content centrality were assigned by SMEs
Table 5: Content Centrality for Formative Assessment Rating # of Items % of Assessment
2 6 12.24%
1A 7 14.29%
1B 35 71.43%
0 1 2.04%
The results shown in Table 5 show that approximately 71% of the test measure the less essential part of compound objectives. This is evidence that the quality and the clarity of the objectives influence the results of the Achieve method. Many of the objectives were written with long lists of content; for example, objective 5.02 requires that students translate among symbolic, numeric, verbal, and pictorial representations of number relationships, and objective 1.03 requires students to solve problems using models, diagrams, and reasoning about fractions and relationships among fractions involving halves, fourths, eighths, thirds, sixths, twelfths, fifths, tenths, hundredths, and mixed numbers. The lists of content associated with one objective make aligning items difficult. At times, SMEs questioned the most
essential pieces of the objectives because of the lists of content within the objectives.
Performance Centrality. The ratings for performance centrality were assigned based
on the level of congruence between the performance specified in the item and the objectives assigned to the item on the test blueprint. SMEs examined the item and the assigned
objective, the SMEs assigned the item’s performance centrality with a score of 1B. Hence, if the assigned objectives and the item did not match, the SMEs assigned the item with a score of 0. SMEs were in total agreement on these ratings 65.31% of the time (32 out of 49 items), and 2/3 agreement on 30.61% of the time (15 out of 49 items). The SMEs did not agree on a majority rating for performance centrality 4.08% of the time (2 out of 49 items).
Table 6: Performance Centrality for Formative Assessment Rating # of Items % of Assessment
2 23 46.94%
1A 10 20.41%
1B 14 28.57%
0 2 4.08%
The results for Performance Centrality shown in Table 6 suggest that almost half of the assessment was written at a performance level consistent with the objectives, but the lists of verbs in some of the objectives made approximately 28.57% of the items difficult to rate as consistent with the objectives because the items only measured part of the objective. Finally, about twenty percent of the items were matched to objectives with a vague or unclear verb in the objective.
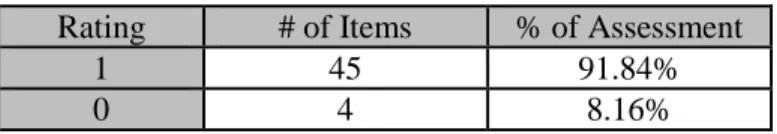
Source of Challenge. Source of challenge is rated as 1 if the challenge is appropriate
for the grade level, in this case fourth grade, and is written clearly, without misleading language or information that does not relate to the objective. If the item contains an extraneous challenge, the source of challenge for the item is rated a score of 0. The SMEs rated the source of challenge for the items consistently 81.63% of the time (40 out of 49 items) and with 2/3 agreement 18.37% of the time (9 out of 49 items).
Table 7: Source of Challenge for Formative Assessment Rating # of Items % of Assessment
1 45 91.84%