Combined Close Interval Potential Surveys and Direct Current Voltage
Surveys for Increased Pipeline Integrity
John Peter Nicholson
NACE Accredited Senior Corrosion Technologist Managing Director
Cathodic Technology Limited 15-1 Marconi Court
Bolton, Ontario, Canada, L7E 1E2
Summary
With today’s electronic instrumentation, it is possible to combine close interval poten-tial surveys (CIPS) with direct current voltage gradient surveys (DCVG) of buried and underwater pipelines for improved accuracy in assessing the level of cathodic protec-tion combined with locating coating defects without spatial errors. Modern electronic survey instruments are capable of stamping each reading with the time, date and sub-metre GPS coordinates. This provides information for accurate mapping of the pipe-line location, current state of the cathodic protection system, and further allows per-sonnel to accurately locate areas requiring excavation for coating repair. This paper will show by example how combined CIPS and DCVG surveys undertaken to NACE standards are of benefit to pipeline operators in ensuring cost- and time-effective inte-grity management of their pipeline systems.
1 Introduction
Traditionally direct assessment of external corrosion of pipelines has been undertaken as a two step process with a close interval potential survey (CIPS) undertaken to
de-termine the level of cathodic polarization and an analogue (See Figure 1) direct current voltage gra-dient (DCVG) survey to determine the location of coating defects or holidays. Undertaking the CIPS and DCVG surveys separately leads to spatial er-rors.
Further, if the surveys are not done
concurrently, errors can result due to differences in soil moisture content, the skill of the operators undertaking the survey, changes in the level of cathodic protection and the inability to accurately mark or record the location of coating defects, they must be manual staked out. (See Figure 2).
Figure 1 Analogue DCVG Meter
Figure 2 DCVG Surveyor
2
Direct Current Voltage Gradient Surveys
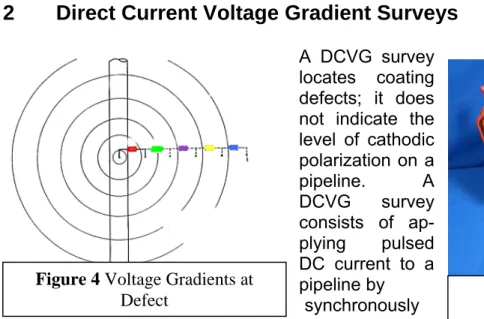
A DCVG survey locates coating defects; it does not indicate the level of cathodic polarization on a pipeline. A DCVG survey consists of ap-plying pulsed DC current to a pipeline by synchronously interrupting the rectifiers (See Figure 3) and then measuring the voltage shift in the soil along a pipeline (See Figure 4). When a defect is present, a voltage gradient will be present in the soil. This can be meas-ured as a voltage between two electrodes in contact with the soil (As shown in Figure 5). When undertak-ing a DCVG survey with a sundertak-ingle surveyor, it is essen-tial to take the readings moving out from the center of the defect, summing the values in order to arrive at the total voltage gradient associated with the defect. The voltage gradient measured follows Ohms Law in that the Voltage Gradient is equal to the current flow multiplied by the resistance of the electrolyte path (VG = I * R) thus the Voltage Gradient measured is influ-enced by the resistance of the electrolyte path, the spacing between the electrodes and the current being delivered to the coating defect. The effective distance that a defect can be measured at can be expressed mathematically as shown in Earth Resistances by G.F. Tagg. In order to make the calculation, the coat-ing defect or holiday must be resolved as a hemis-pherical electrode.2.1 Equivalent Hemisphere Associated With A Defect
The equivalent hemisphere associated with a defect as expressed in Earth Resis-tances written by G.F. Tagg published by George Newnes Ltd. London England in 1964 is presented here.
The total resistance of a hemispherical electrode is where r is the radius of
the sphere. This assumes that the defect in question is of similar surface to a sphere where the length of the defect is equivalent to 2r.
Figure 3 Current Interrupter Figure 4 Voltage Gradients at
Defect
The resistance at distance
r
1 is found with This gives a fraction of thetotal resistance of Solving to x percent then
The calculations provide the following results.
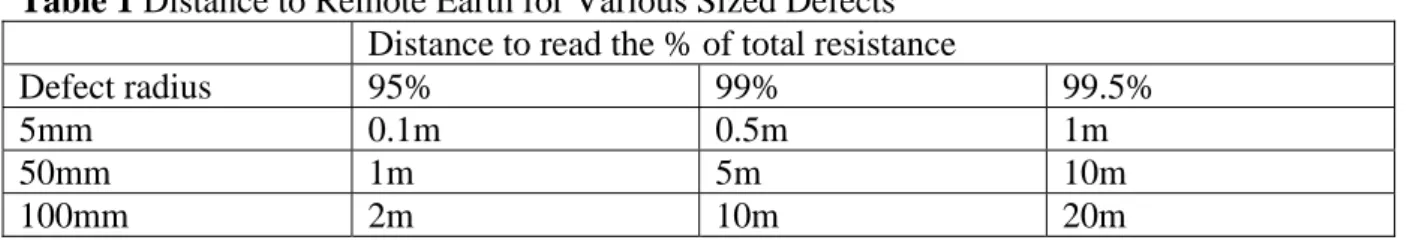
Table 1 Distance to Remote Earth for Various Sized Defects Distance to read the % of total resistance
Defect radius 95% 99% 99.5%
5mm 0.1m 0.5m 1m
50mm 1m 5m 10m
100mm 2m 10m 20m
On the surface, the probes are positioned so that one electrode is on top of the pipe and the second is a distance away. Assuming that the depth is d and the probe
spac-ing is l then the distance to read the total resistance is dr.
Table 2 Probe Spacing to Read Total Voltage Gradient for Various Defect Sizes Probe spacing for DCVG at a depth of 1.5m
Defect radius 95% 99% 99.5%
5mm Won’t read Won’t read Won’t read
50mm Won’t read 4.8m 9.9m
100mm 1.3m 9.9m 19.9m
Note: that the deeper the pipe, the less likely DCVG will pick up small defects.
It is apparent from the above calcula-tions that a small holiday at a depth of 1.5 meters has an equivalent hemis-phere that does not intersect the surface of the ground above the pipeline and will not be detected by DCVG techniques. Figure 6 shows the Equipotential lines about a defect.
Since DCVG does not measure the rec-tifier ON or OFF pipe-to-soil potential, practitioners have had to arrive at some method to determine the necessity of repairing the coating defect or holiday. The result is a formula described as % IR.
2.2 DCVG % IR Calculation
The NACE test method TM0109-2009 offers a formula to determine the severity of a coating defect or holiday.
Indication pipe to remote earth DCVG signal magnitudes (P/RE) are calculated using the following formula.
dx (S1 – S2)
Coating Fault P/RE = S1 + ---
(d2 – d1)
Where:
P/RE = Pipe to remote earth DCVG signal magnitude (mV)
S1 = DCVG signal amplitude to remote earth at Test Station 1 (mV) S2 = DCVG signal amplitude to remote earth at Test Station 2 (mV)
d1 = Distance measurement of Test Station 1 (This is zero at the beginning of a sur-vey.) (m)
d2 = Distance measurement of Test Station 2 (m)
dx = Distance measurement of indication from Test Station 1 (m)
Note: The distance between any two test posts should be kept as small as possible. It is not acceptable to simply use the difference between on and off pipe-to-soil poten-tials at test points (S1 and S2) as the DCVG signal magnitude. All DCVG magnitude measurements must include the voltage gradient from the test station to ground as well as the sum of the voltage gradients to remote earth
2.3 % IR Calculation (Simplified Calculation)
Once an indication is located, its % IR is estimated by measuring the potential differ-ence from the indication epicenter to remote earth (OL/RE). This potential differdiffer-ence is then expressed as a percentage of the total calculated potential shift on the pipeline at the indication location (P/RE), as shown in the Equation below.
Calculated Pipe to Remote Earth at Indication mV
Over the Line to Remote Earth mV * 100 %IR(Coating Indication Severity) = ---
Calculated Pipe to Remote Earth at Indication mV or
OL/RE * 100 55 *100
% IR = --- For Example --- = 9.4
P/RE 587.4
The indication severity is therefore 9.4%.
Each pipeline is different; the %IR at which a dig is warranted will vary with the soil resistivity and type of coating, the location, the cost and other factors. Without compa-nion rectifier ON and Instant OFF pipe-to-soil potentials, it is difficult for the corrosion engineer to justify digs based only on the % IR without knowing the effect of the coat-ing defect on the polarized potential of the pipeline.
3 Close Interval Potential Surveys
Close interval potential surveys (CIPS) are the mainstay of cathodic protection and are usually undertaken by a surveyor walking over the pipeline measuring the rectifier ON and Instant OFF (polarized) to-soil potentials at regular intervals along the pipe-line (See Figure 7). Since the indicator of the polarized potential is the instant OFF
pipe-to-soil potential, it is important that the rectifiers be in-terrupted synchronously preferably using the GPS system for synchronization (See Figure 3). A properly conducted CIPS survey will indicate those areas of the pipeline that meet the criterion for cathodic protection (See NACE SP0169-2007 Standard).
4 Combined CIPS and DCVG Surveys
There are several advantages to undertaking a combined CIPS and DCVG survey. Both surveys are undertaken at the same time by the same surveyors, under the same climatic and soil conditions without spatial errors. This results in more accurate survey data. Further, with modern digital survey equipment, each reading is stored along with the time, date and GPS coordinates; thus defects can easily be located if excavation is required. A further advantage can be
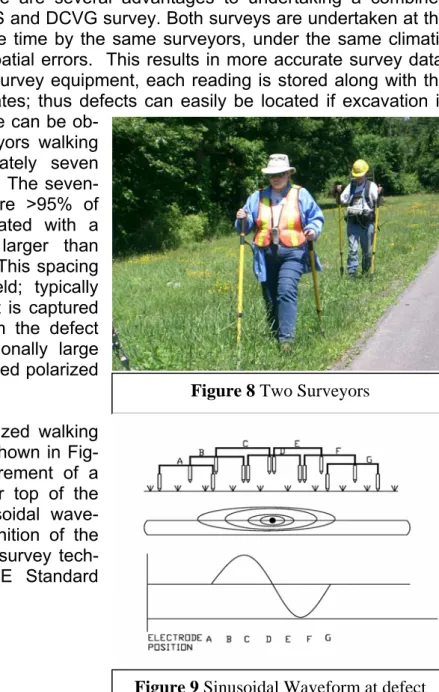
ob-tained by utilizing two surveyors walking over the pipeline approximately seven metres apart (See Figure 8). The seven-metre spacing should capture >95% of the voltage gradient associated with a coating defect or holiday larger than 50mm radius (See Table 2). This spacing has been proven in the field; typically >95% of the voltage gradient is captured within a 5 metre radius from the defect unless the defect is exceptionally large which would result in depressed polarized potentials.
When two surveyors are utilized walking over top of the pipeline (as shown in Fig-ure 8), the resultant measFig-urement of a coating defect recorded over top of the pipeline appears as a sinusoidal wave-form making for easy recognition of the defect (See Figure 9). This survey tech-nique is explained in NACE Standard Specification
SP0207-2007.
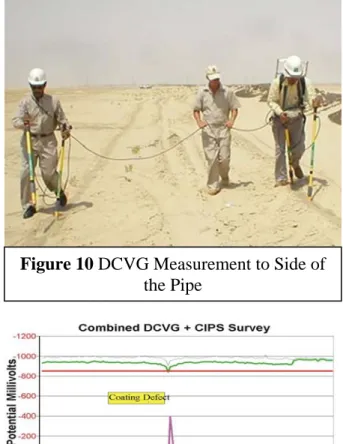
If the second surveyor walks to the side of the pipeline (As shown in Figure 10), then there is a sharp increase in the voltage gradient when the surveyors reach the epicen-ter of the defect (as shown in Figure 11). If the coating defect is large enough to af-fect the pipe-to-soil potentials, then a reduction in the rectifier ON and Instant OFF potentials will be apparent.
Figure 8 Two Surveyors Figure 7 CIPS
Surveyor
By utilizing a two-person survey crew walking over the pipeline, the pipe-to-soil potential can be measured simultaneously with the DCVG gradient; thus there is no spatial error. Further, when the surveyors walk over the pipeline a sinusoidal signal occurs at coating defects (See Figure 9). In Figure 11 the coating defect can be seen as a voltage spike with correspond-ing reduction in the rectifier ON and in-stant OFF pipe-to-soil potentials. A corro-sion engineer must be cognizant of the level of polarization of pipelines under his jurisdiction. Only a rectifier-interrupted CIPS survey will reveal the level of ca-thodic polarization on a pipeline.
A DCVG survey will locate coating holi-days or defects, but it can not indicate the level of cathodic polarization. A number of practitioners of DCVG surveys have tried to develop a formula that would indicate the magnitude of a coating defect.
4.1 % IR for Combined CIPS and DCVG
One proposed formula for calculating the % IR for combined CIPS and DCVG surveys developed by R. A. Gummow and S. Segall and R. Reid is as follows.
For a combined CIPS – DCVG survey the %IR can be calculated as follows: K(d,s) * ∆ G ol-d
%IR = --- ∆ V ol + ∆ G ol-d
Where:
∆ G ol-d lateral gradient shift as measured between a reference electrode installed
over the line (RE1) and a reference electrode (RE2) installed at a distance (s) perpen-dicular to the line.
∆ V ol potential shift between the pipe and a reference electrode (RE1) installed over
the line.
K(d, s) function depending on the pipe depth (d) and the distance (s) between the two reference electrodes used to measure the gradient. For a pipeline 1.2 metres deep where d = 3 metres K = 1.59, for 5 metres K = 1, for 10 metres K = 0.5
Figure 11 Graph of Voltage Gradient at a Defect
Figure 10 DCVG Measurement to Side of the Pipe
5 Examples of defects located by combined CIPS and DCVG surveys
The first example is of a defect on a 20-inch gas line where the coating at a joint had deteriorated (See Figure 12) resulting in a small defect that affected the pipe-to-soil potentials (As shown in Figure 13).
This defect was at the 3 o’clock position on the pipeline where petrolatum tape was used instead of the specified shrink sleeve. By combining the CIPS and DCVG survey, the corrosion engineer can easily prioritize the repair of coating defects.
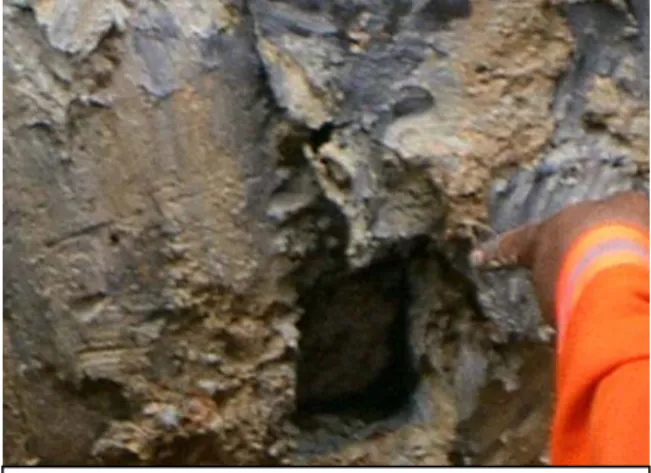
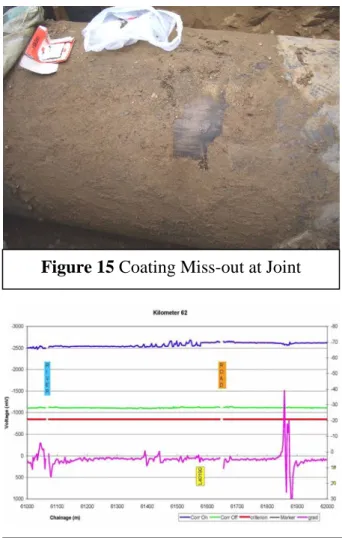
The second example is of a weld area at a joint where coating repair had not been performed. The defect was on a 20-inch gas line coated with a three-layer polyethylene coating system. The defect was located using a combined CIPS and DCVG survey with two sur-veyors walking over top of the pipeline. Figure 14 shows the graphical display of the pipe-to-soil potential and the DCVG voltage gradient at the coating miss-out.
Figure 15 is a photograph of the defect taken after excavation but before cleaning of the pipeline. Although the defect was relatively large, it was not affecting the polarization of the pipeline. With the three-layer poly coating system, very little current was required for cathodic protec-tion of the pipeline.
The third example is of a three-layer po-lyethylene coated pipeline where third party damage had occurred in the form of a scrape of the pipeline coating by me-chanical digging equipment. The graph of the combined CIPS and DCVG survey (See Figure 16) shows multiple sinusoidal
Figure 12 Coating Defect at Joint
Figure 14 Sinusoidal Waveform at
Defect
Figure 13 Voltage Gradient Spike at a
waveforms at the coating defect. A pho-tograph of the pipeline after excavation is shown in Figure 17.
Although the coating damage shown in Figures 15 and 17 did not affect the pola-rized potential of the pipeline, it was well protected from corrosion by cathodic pola-rization and could have been safely left unrepaired. Both of these defects were excavated as a training exercise for cor-rosion engineers implementing External Corrosion Direct Assessment methodolo-gy (ECDA) as described in NACE SP0502-2007.
The sinusoidal waveform produced at a coating defect when two surveyors walk over top of the pipeline performing a CIPS and DCVG survey makes it very easy to visually recognize a coating defect even when the recorded voltage gradient is subject to electrical noise.
6 Conclusion
In conclusion, a combined CIPS and DCVG survey provides the corrosion engineer with accurate information on the level of polarization of the pipeline and the effect of coating defects or holi-days. By undertaking a CIPS and a DCVG survey at the same time, spatial errors do not occur and errors due to soil moisture and cathodic polarization as well as operator skill do not influence the survey result. A combined CIPS and DCVG survey can locate small coating defects and third party damage with each reading taken stamped with the GPS coordinates and the date and time the readings where taken.
A DCVG survey does not provide any information on the level of cathodic protection, only information on the integrity of the coating. Repairing coating defects is a double edged sword. As the number of defects is reduced, the surface area of steel from which AC current can discharge is also reduced; thus the current density discharging from the pipeline at any given location is increased and could result in corrosion from DC stray current or AC current discharge.
Figure 15 Coating Miss-out at Joint
Figure 16 Multiple Sinusoidal Waveforms
The corrosion engineer must have sufficient information on the level of cathodic pola-rization on the pipelines under his jurisdiction that he can assure management that the cathodic protection systems are functioning and providing cathodic protection current to all areas of the pipeline. To reach this level of confidence, the corrosion engineer needs regular current-interrupted close interval potential surveys as they are the only method that indicates the level of cathodic polarization on the pipelines. DCVG surveys can not provide this information.
References
1) World Pipelines, Stray and Telluric Correction of CIPS data February 2010 2) Peter Nicholson Corrosion 2008 Paper 08123 Is Your Pipeline Corroding 3) Peter Nicholson NACE Northern Region 2008 Is Your Pipeline Corroding 4) World Pipelines, Combined CIPS & DCVG surveys for more accurate ECDA
Data November 2007 issue
5) Peter Nicholson Corrosion 2007 Paper 07181 Combined CIPS & DCVG for more accurate data correlation
6) Peter Nicholson Corrosion 2007 Stray &Telluric Correction of CIPS Data Paper 07182
7) Peter Nicholson “External Corrosion Direct Assessment”, Pipeline Rehabilitation & Maintenance September 2006 Istanbul Turkey
8) Gummow, Seagal, Reid Corrosion 2006 Paper 06193 Use of an Integrated CIPS/DCVG Survey in the ECDA Process
9) 23rd. World Gas Conference Amsterdam 2006 C.P. data, CIPS & DCVG
tech-niques: another way to predict Corrosion on Gas Pipeline. A Taberkokt, Algeria
10) Peter Nicholson “External Corrosion Direct Assessment”, Corcon 2004 New Delhi India
11) Peter Nicholson “Pipeline Integrity”, World Pipelines, March 2003
12) Peter Nicholson “Stray and Telluric Current Correction of Close Interval Poten-tial Survey Data”, Eurocorr 2003 Budapest Hungary
13) R.L. Pawson: "Close Interval Potential Surveys - Planning, Execution, Results", Materials Performance, February 1998, pp.16-21.
14) N.G. Thompson and K.M. Lawson, PRCI PR-186-807 Improved Pipe-to-Soil Po-tential Survey Methods, April 1991
15) Cathodic Protection, Roger Alexander 1982 Early Practitioner of DCVG 16) Tagg, G.F. Earth Resistances. George Newnes Ltd, London. 1964
17) NACE International Recommended Practice SP0502-2007 18) NACE International Recommended Practice SP0507-2007
19) NACE International Standard Practice SP0169-2007
20) NACE International Standard Practice SP0207-2007
21) NACE TM0109-2009 Test Method Aboveground Survey Techniques for the Evaluation of Underground Pipeline Coating Condition
22) US Department of Transportation, Federal Highway Administration Publica-tion, Corrosion Cost and Preventative Strategies in the United States Pub-lished 2002