ARTICLE
Large-Scale Exome-wide Association Analysis
Identifies Loci for White Blood Cell Traits
and Pleiotropy with Immune-Mediated Diseases
Salman M. Tajuddin,1,80 Ursula M. Schick,2,3,80 John D. Eicher,4 Nathalie Chami,5,6 Ayush Giri,7 Jennifer A. Brody,8 W. David Hill,9,10 Tim Kacprowski,11,12 Jin Li,13 Leo-Pekka Lyytika¨inen,14,15 Ani Manichaikul,16 Evelin Mihailov,17 Michelle L. O’Donoghue,18 Nathan Pankratz,19 Raha Pazoki,20 Linda M. Polfus,21 Albert Vernon Smith,22,23 Claudia Schurmann,2,3 Caterina Vacchi-Suzzi,24
Dawn M. Waterworth,25 Evangelos Evangelou,26,27 Lisa R. Yanek,28 Amber Burt,29 Ming-Huei Chen,4 Frank J.A. van Rooij,20 James S. Floyd,8 Andreas Greinacher,30 Tamara B. Harris,31
Heather M. Highland,21,32 Leslie A. Lange,33 Yongmei Liu,34 Reedik Ma¨gi,17 Mike A. Nalls,35
Rasika A. Mathias,36 Deborah A. Nickerson,37 Kjell Nikus,38,39 John M. Starr,9,40 Jean-Claude Tardif,5,6 Ioanna Tzoulaki,26,27 Digna R. Velez Edwards,41 Lars Wallentin,42 Traci M. Bartz,43 Lewis C. Becker,44 Joshua C. Denny,45 Laura M. Raffield,33 John D. Rioux,5,6 Nele Friedrich,12,46 Myriam Fornage,47 He Gao,26 Joel N. Hirschhorn,48,49David C.M. Liewald,9,10Stephen S. Rich,16 Andre Uitterlinden,20,50,51 Lisa Bastarache,45 Diane M. Becker,28 Eric Boerwinkle,21,52 Simon de Denus,6,53 Erwin P. Bottinger,2
(Author list continued on next page)
White blood cells play diverse roles in innate and adaptive immunity. Genetic association analyses of phenotypic variation in circulating white blood cell (WBC) counts from large samples of otherwise healthy individuals can provide insights into genes and biologic path-ways involved in production, differentiation, or clearance of particular WBC lineages (myeloid, lymphoid) and also potentially inform the genetic basis of autoimmune, allergic, and blood diseases. We performed an exome array-based meta-analysis of total WBC and sub-type counts (neutrophils, monocytes, lymphocytes, basophils, and eosinophils) in a multi-ancestry discovery and replication sample of ~157,622 individuals from 25 studies. We identified 16 common variants (8 of which were coding variants) associated with one or more WBC traits, the majority of which are pleiotropically associated with autoimmune diseases. Based on functional annotation, these loci included genes encoding surface markers of myeloid, lymphoid, or hematopoietic stem cell differentiation (CD69,CD33,CD87), transcription factors regulating lineage specification during hematopoiesis (ASXL1,IRF8,IKZF1,JMJD1C,ETS2-PSMG1), and molecules involved in neutrophil clearance/apoptosis (C10orf54,LTA), adhesion (TNXB), or centrosome and microtubule structure/function (KIF9, TUBD1). Together with recent reports of somaticASXL1mutations among individuals with idiopathic cytopenias or clonal hematopoi-esis of undetermined significance, the identification of a common regulatory 30UTR variant ofASXL1suggests that both germline and somaticASXL1mutations contribute to lower blood counts in otherwise asymptomatic individuals. These association results shed light on genetic mechanisms that regulate circulating WBC counts and suggest a prominent shared genetic architecture with inflammatory and autoimmune diseases.
Introduction
White blood cells (WBCs) are major constituents of the blood and lymphatic system. They are classified into two
lineages: myeloid (neutrophils, basophils, eosinophils, and monocytes) and lymphoid (lymphocytes). Lineage commitment of hematopoietic stem cells involves precise transcriptional and epigenetic regulation, creating the
1Laboratory of Epidemiology and Population Sciences, National Institute on Aging, NIH, Baltimore, MD 21224, USA;2The Charles Bronfman Institute for Personalized Medicine, The Icahn School of Medicine at Mount Sinai, New York, NY 10029, USA;3The Genetics of Obesity and Related Metabolic Traits Program, The Icahn School of Medicine at Mount Sinai, New York, NY 10029, USA;4Population Sciences Branch, National Heart Lung and Blood Institute, The Framingham Heart Study, Framingham, MA 01702, USA;5Department of Medicine, Universite´ de Montre´al, Montre´al, QC H3T 1J4, Canada;6Montreal Heart Institute, Montre´al, QC H1T 1C8, Canada;7Division of Epidemiology, Institute for Medicine and Public Health, Vanderbilt University, Nashville, TN 37235, USA;8Department of Medicine, University of Washington, Seattle, WA 98101, USA;9Centre for Cognitive Ageing and Cognitive Epidemiology, Uni-versity of Edinburgh, Edinburgh EH8 9JZ, UK;10Department of Psychology, University of Edinburgh, Edinburgh EH8 9JZ, UK;11Department of Functional Genomics, Interfaculty Institute for Genetics and Functional Genomics, University Medicine Greifswald and Ernst-Mortiz-Arndt University Greifswald, Greifswald 17475, Germany;12DZHK (German Centre for Cardiovascular Research), partner site Greifswald, Greifswald, Germany;13Department of Med-icine, Division of Cardiovascular MedMed-icine, Stanford University School of MedMed-icine, Palo Alto, CA 94305, USA;14Department of Clinical Chemistry, Fimlab Laboratories, Tampere 33520, Finland;15Department of Clinical Chemistry, University of Tampere School of Medicine, Tampere 33014, Finland;16Center for Public Health Genomics, University of Virginia, Charlottesville, VA 22908, USA;17Estonian Genome Center, University of Tartu, Tartu 51010, Estonia; 18TIMI Study Group, Cardiovascular Division, Brigham and Women’s Hospital, Boston, MA 02115, USA;19Department of Laboratory Medicine and Pathol-ogy, University of Minnesota, Minneapolis, MN 55454, USA;20Department of Epidemiology, Erasmus University Medical Center, Rotterdam 3000, the
Netherlands;21Human Genetics Center, School of Public Health, University of Texas Health Science Center at Houston, Houston, TX 77030, USA;
22Icelandic Heart Association, 201 Kopavogur, Iceland;23Faculty of Medicine, University of Iceland, 101 Reykjavik, Iceland;24Department of Family,
(Affiliations continued on next page)
specific bone marrow microenvironment to produce each
distinct mature blood cell type.1 Mature WBCs play
diverse, choreographed roles in innate and adaptive immu-nity including detection, neutralization, and elimination of invading pathogens, response to tissue injury, and wound healing. In addition, WBCs are associated with the development of chronic inflammatory, allergic, and
autoimmune diseases.2 Therefore, total and differential
WBC counts are important clinical measures of susceptibil-ity to infection and used to monitor disease activsusceptibil-ity and tolerability to therapeutic regimens for oncologic and rheumatologic diseases.
Total and differential WBC counts are complex,
poly-genic traits with estimated heritability of 50%–60%.3
Previous genome-wide association studies (GWASs) have characterized common and lower frequency variation contributing to WBC counts in European, African, and Asian ancestry populations (N.P., U.M.S., J.B.-J., and
M.-H.C., unpublished data).3–12More than 30 distinct
ge-netic loci have been discovered; in some instances, these genetic studies have provided important biologic insights into the development, maturation, or regulation of WBC types. Nonetheless, these studies have explained only a
small proportion (<10%) of the estimated heritability of
Population and Preventive Medicine, Stony Brook University, Stony Brook, NY 11794, USA;25Genetics, Target Sciences, GlaxoSmithKline, King of Prussia, PA 19406, USA;26Department of Epidemiology and Biostatistics, MRC-PHE Centre for Environment and Health, School of Public Health, Imperial College
London, London W2 1PG, UK; 27Department of Hygiene and Epidemiology, University of Ioannina Medical School, Ioannina 45110, Greece;
28Department of Medicine, Division of General Internal Medicine, Johns Hopkins University School of Medicine, Baltimore, MD 21205, USA;29Division of Medical Genetics, Department of Medicine, University of Washington, Seattle, WA 98195, USA;30Institute for Immunology and Transfusion Medicine, University Medicine Greifswald, Greifswald 17475, Germany;31Laboratory of Epidemiology, Demography, and Biometry, National Institute on Aging, In-tramural Research Program, NIH, Bethesda, MD 20892, USA;32Department of Epidemiology, University of North Carolina at Chapel Hill, Chapel Hill, NC 27514, USA;33Department of Genetics, University of North Carolina, Chapel Hill, NC 27514, USA;34Center for Human Genetics, Division of Public Health Sciences, Wake Forest School of Medicine, Winston-Salem, NC 27157, USA;35Laboratory of Neurogenetics, National Institute on Aging, NIH, Bethesda, MD 20892, USA;36Department of Medicine, Divisions of Allergy and Clinical Immunology and General Internal Medicine, Johns Hopkins University School of
Medicine, Baltimore, MD 21205, USA;37Department of Genome Sciences, School of Medicine, University of Washington, Seattle, WA 98105, USA;
38Department of Cardiology, Heart Center, Tampere University Hospital, Tampere 33521, Finland;39University of Tampere School of Medicine, Tampere 33014, Finland;40Alzheimer Scotland Dementia Research Centre, Edinburgh EH8 9JZ, UK;41Vanderbilt Epidemiology Center, Department of Obstetrics and Gynecology, Institute for Medicine and Public Health, Vanderbilt Genetics Institute, Vanderbilt University, Nashville, TN 37203, USA;42Department of Medical Sciences, Cardiology, and Uppsala Clinical Research Center, Uppsala University, 751 85 Uppsala, Sweden;43Department of Biostatistics, Uni-versity of Washington, Seattle, WA 98195, USA;44Department of Medicine, Divisions of Cardiology and General Internal Medicine, Johns Hopkins Uni-versity School of Medicine, Baltimore, MD 21205, USA;45Department of Biomedical Informatics, School of Medicine, Vanderbilt University, Nashville, TN 37203, USA;46Institute of Clinical Chemistry and Laboratory Medicine, University Medicine Greifswald, Greifswald 13347, Germany;47Institute of Mo-lecular Medicine, The University of Texas Health Science Center at Houston, Houston, TX 77030, USA;48Program in Medical and Population Genetics, Broad Institute, Cambridge, MA 02142, USA;49Department of Endocrinology, Boston Children’s Hospital, Boston, MA 02115, USA;50Department of In-ternal Medicine, Erasmus University Medical Center, Rotterdam 3000, the Netherlands;51Netherlands Consortium for Healthy Ageing (NCHA), Rotterdam 3015, the Netherlands;52Human Genome Sequencing Center, Baylor College of Medicine, Houston, TX 77030, USA;53Faculty of Pharmacy, Universite´ de Montre´al, Montre´al, QC H3T 1J4, Canada;54MRC Human Genetics Unit, Institute of Genetics and Molecular Medicine, University of Edinburgh,
Edin-burgh EH4 2XU, UK;55Department of Epidemiology, Harvard TH Chan School of Public Health, Boston, MA 02115, USA;56Departments of Genetics
and Biostatistics, University of North Carolina at Chapel Hill, Chapel Hill, NC 27599, USA;57National Heart, Lung, and Blood Institute, The Framingham Heart Study, Framingham, MA 01702, USA;58Cardiology Section and Center for Population Genomics, Boston Veteran’s Administration (VA) Healthcare, Boston, MA 02118, USA;59Morehouse School of Medicine, Social Epidemiology Research Center, Cardiovascular Research Institute, Atlanta, GA 30310, USA;60Institute for Translational Genomics and Population Sciences, Los Angeles Biomedical Research Institute, Torrance, CA 90502, USA;61Department of Pediatrics, Harbor-UCLA Medical Center, Torrance, CA 90502, USA;62Department of Biomedical Informatics and Medical Education, University of Wash-ington, Seattle, WA 98195, USA;63Department of Cardiology, University Medicine Greifswald, Greifswald 17475, Germany;64Department of Clinical Phys-iology, Tampere University Hospital, Tampere 33521, Finland;65Department of Clinical Physiology, University of Tampere School of Medicine, Tampere 33014, Finland;66Cardiovascular Health Research Unit, Departments of Epidemiology, Health Services, and Medicine, University of Washington, Seattle, WA 98101, USA;67Group Health Research Institute, Group Health Cooperative, Seattle, WA 98101, USA;68OmicSoft Corporation, Cary, NC 27513, USA; 69Genetics, Target Sciences, GlaxoSmithKline, Research Triangle Park, NC 27709, USA;70Green Lane Cardiovascular Service, Auckland City Hospital and University of Auckland, Auckland 1142, New Zealand;71Departments of Internal Medicine and Human Genetics, University of Michigan, Ann Arbor, MI
48108, USA;72The Mindich Child Health and Development Institute, The Icahn School of Medicine at Mount Sinai, New York, NY 10029, USA;
73Department of Anesthesiology and Critical Care Medicine, Johns Hopkins University School of Medicine, Baltimore, MD 21205, USA;74Department of Physiology and Biophysics, University of Mississippi Medical Center, Jackson, MS 39216, USA;75Division of Hematology Oncology, Department of Med-icine, The University of Vermont, Colchester, VT 05446, USA;76Division of Epidemiology, Department of Medicine, Institute for Medicine and Public Health, Vanderbilt Genetics Institute, Vanderbilt University, Nashville, TN 37203, USA;77Department of Epidemiology, University of Washington, Seattle, WA 98195, USA;78Division of Public Health Sciences, Fred Hutchinson Cancer Research Center, Seattle, WA 98109, USA;79Zilber School of Public Health, University of Wisconsin-Milwaukee, Milwaukee, WI 53205, USA
80These authors contributed equally to this work
*Correspondence:[email protected](A.P.R.),[email protected](P.L.A.) http://dx.doi.org/10.1016/j.ajhg.2016.05.003.
Caroline Hayward,54Albert Hofman,20,55Georg Homuth,11Ethan Lange,56Lenore J. Launer,31
Terho Lehtima¨ki,14,15Yingchang Lu,2,3Andres Metspalu,17Chris J. O’Donnell,57,58Rakale C. Quarells,59 Melissa Richard,47Eric S. Torstenson,7Kent D. Taylor,60,61Anne-Claire Vergnaud,26Alan B. Zonderman,1 David R. Crosslin,62Ian J. Deary,9,10Marcus Do¨rr,12,63Paul Elliott,26Michele K. Evans,1
Vilmundur Gudnason,22,23Mika Ka¨ho¨nen,64,65Bruce M. Psaty,66,67Jerome I. Rotter,60,61
Andrew J. Slater,68,69Abbas Dehghan,20Harvey D. White,70Santhi K. Ganesh,71Ruth J.F. Loos,2,3,72 To˜nu Esko,17,48Nauder Faraday,73James G. Wilson,74Mary Cushman,75Andrew D. Johnson,4
Todd L. Edwards,76Neil A. Zakai,75Guillaume Lettre,5,6,80Alex P. Reiner,77,78,80,*and Paul L. Auer79,80,*
WBC traits in European ancestry populations6 and less than 25% in African ancestry (AA) populations (in AA, a substantial proportion of the variation in WBC counts is
attributed to a single variant—rs2814778—inDARC[Duffy
Antigen Receptor for Chemokines (MIM: 613665)]).3,13In
an effort to augment the discoveries from GWASs and to identify additional functional loci contributing to varia-tion in WBC counts, we performed exome array-based meta-analysis of total and differential counts in a multi-ancestry samples from 25 studies.
Material and Methods
Study Subjects
The Blood-Cell Consortium (BCX) is an international collabora-tion with the goal of identifying common and rare variants asso-ciated with blood cell traits through exome genotyping arrays (Table S1). The consortium, which is comprised of multi-ancestry cohorts including European ancestry (EA), African ancestry (AA), Hispanic ancestry (HA), East Asian ancestry (EAS), and South Asian ancestry (SA), is divided into three main working groups: red blood cell (RBC), platelet, and WBC. For exome-wide association analysis of WBC traits, the discovery and replication phases included a total of 157,622 participants from 25 cohorts (Tables 1,S2, and S3). The discovery sample consisted of up to 138,814 individuals from 21 studies. The replication sample included 18,808 indepen-dent individuals from 4 additional studies. The division of discov-ery and replication samples was dictated by timing; we collected all available studies for initial discovery and then identified others who could participate only at a later point in time and hence were used for replication. A summary of descriptive statistics for total WBC, neutrophils, monocytes, lymphocytes, basophils, and eosinophils is shown in Table S4. All participants provided informed consent and the study was approved by the Institutional Review Board of each participating study.
Genotyping and Quality Control
Each participating study used one of the following exome content genotyping arrays: Illumina ExomeChip v.1.0, Illumina ExomeChip v.1.1_A, Illumina ExomeChip-12 v.1.1, Affymetrix Axiom Biobank Plus GSKBB1, or Illumina HumanOmniExpressExome Chip. Geno-types were called either using a combination of the Illumina GenomeStudio and zCall software or using the Exomechip joint
call-ing plan developed by the Cohorts for Heart and Agcall-ing Research in Genomic Epidemiology (CHARGE) Consortium14(Table S1). Stan-dard quality-control criteria were applied by each study. Exclusion criteria included sample call rates of less than 98%, excess heterozy-gosity rates, Hardy-Weinberg equilibrium p values<13106, and sex mismatch. Additionally, ancestry was confirmed through prin-cipal components or multi-dimensional scaling analyses using link-age disequilibrium (LD) pruned markers (r2<0.2) with minor allele frequency greater than 1%. Scatterplots anchored using the 1000 Genomes Project populations were visually inspected and ancestry outliers were excluded. Insertion and deletion variants and variants mapping to the Y chromosome, the pseudo-autosomal region, or mitochondrial sequence were removed, leaving only those on the autosomal and X chromosomes. All remaining variants (including monomorphic variants) were aligned to the forward strand and al-leles were checked to ensure that the correct reference allele was specified. After all quality-control procedures, each study generated an indexed variant call file (VCF) for subsequent analyses. The VCF files were checked for allele alignment with the checkVCF package. We performed study-specific quality control on each trait associ-ation result using the EasyQC protocol.15 Variant allele fre-quencies from each study were plotted against ethnicity-specific reference population allele frequencies to identify allele frequency deviations and the presence of flipped alleles. In order to assess proper trait transformation in each cohort, a scatterplot of the me-dian standard error versus study-specific sample size was visually inspected for deviations.
Statistical Analysis
To assess the association between WBC-related traits and Exome-chip variants, white blood cell and differential counts (total WBC, neutrophils, monocytes, lymphocytes, eosinophils, and basophils) were obtained from complete blood cell count. Each of the WBC-related traits was log10transformed to normalize the distribution of the traits. In each participating study, residuals for each WBC trait were calculated from linear regression models adjusted for age, age-squared, sex, study center (where applicable), and principal components. Residuals from this model were then transformed using the rank-based inverse normal transformation to control type I error.16Autosomal and X chromosome variants were then tested for association with each WBC trait using either Rvtests or RAREMETALWORKER software packages. Both packages generate single variant association score summary statistics, vari-ance-covariance matrices containing LD relationships between
Table 1. Sample Sizes for Exome-wide Association Analyses of White Blood Cell Traits
Population Total WBC Neutrophils Monocytes Lymphocytes Basophils Eosinophils
Discovery
European ancestry 108,596 60,851 44,325 47,105 44,138 32,517
African ancestry 23,250 10,119 9,790 9,808 9,509 8,282
Hispanic American 5,536 4,825 3,452 3,450 3,453 3,450
East Asian 968 965 – – – –
South Asian 464 463 – – – –
Replication
European ancestry 18,808 17,066 17,066 17,109 16,189 15,327
variants within a 1 MB window, and variant-specific parameters including minor allele frequency, chromosome position, strand, genotype call rate, and Hardy-Weinberg equilibrium p values.
Discovery Association Meta-analysis
For each WBC trait, we performed three distinct discovery meta-analyses: in EA only, AA only, and combined across all five ancestry groups. Ancestry-stratified (EA and AA) and combined all ancestry (EA, AA, HA, EAS, and SA) meta-analyses of single variant association results were carried out using the Cochran-Mantel-Haenszel approach implemented in RareMETALS.17 We included variants in the meta-analysis if the genotype call rate wasR95%. For palindromic variants (i.e., A/T and C/G variants), we compared allele frequencies taken across the entire consortium in order to detect flipped alleles. We kept variants with an allele frequency difference<0.3 or<0.6 for ancestry-specific (EA, AA) or combined all ancestry analyses, respectively.15 Using single-variant score statistics and variance-covariance matrices of LD es-timates, we performed two types of gene-based tests across the contributing studies: (1) a burden test that assumes all qualifying rare variants in a gene are associated with a trait with the same di-rection of effect (variable threshold test), and (2) the sequence kernel association test (SKAT) that accounts for rare variants in a gene having opposing direction of effects.17For all gene-based tests performed, we considered single-nucleotide variants (SNVs) with an allele frequency of %1% and annotated as missense, nonsense, and splice site variants; the latter two categories include loss-of-function variants. Similar to the single-variant analyses, re-sults were generated for EA, AA, and for the combined all ancestry samples. For the discovery single variant and gene-based associa-tion analyses, the statistical significance threshold was set as p value<23107and<33106, respectively.
Conditional Analysis
To identify multiple independent associations within a region, us-ing the RareMETALS software we performed stepwise conditional analyses adjusting for the most significant single variant in a 1 MB window, across the entire Exomechip array. This step was repeated until there was no new association signals identified in each region, defined as a p value<23107. Further, to assess whether SNVs identified by the present study were independent of any previously reported WBC-associated variants, we condi-tioned our regression models on known GWAS sentinel variants or their proxies (LDr2R0.80). For regions of the genome where there is extended LD structure spanning more than 1 MB, we per-formed a stepwise conditional analysis in GCTA software18 condi-tioning on the most significant variant in the region first (or the GWAS sentinel variant or LD proxy).
Replication Meta-analysis
We sought replication of association results using four indepen-dent European ancestry cohorts (Tables 1 and S3). The single-variant association results from each replication cohort were combined using the Cochran-Mantel-Haenszel method in RareMETALS. Contributing replication cohorts adhered to the quality control and association analysis procedures described previously for the discovery analysis. Replication of association findings were considered significant if the variants demonstrated the same direction of effect as the discovery association meta-analyses with a replication p value< 0.05. A meta-analysis of discovery and replication results was performed using an
in-verse-variance weighting method as implemented in METAL.19 We also performed replication of gene-based associations in inde-pendent ~2,900 EA samples.
Phenome-wide Association Study Analysis
In 29,722 EA samples from the BioVU study,20we performed phe-nome-wide association study (PheWAS) analysis21to assess the as-sociation between our WBC-related loci and 1,502 International Classification of Disease, Ninth Revision (ICD-9) code curated clinical phenotypes.21Variants were included in the analysis if there were ten cases with at least one copy of the minor allele. Associations between SNVs and phenotypes were assessed using a logistic regression model adjusted for sex and five principal com-ponents. Empirical significance was estimated by permutation test. The permutation test was performed by assigning each vector of clinical phenotypes to a random subject 50,000 times, and then scanning all SNV-phenotype combinations with association tests. We then created a ranked distribution of the maximum test statis-tics over all SNV-phenotype combinations in each of the 50,000 permutations. The 95thpercentile of the distribution of maximum test statistics across the 1,502 clinical phenotypes and 95 SNVs equates to a threshold that controls the family-wise error rate at 0.05. This threshold accounts for multiple testing across SNVs and phenotypes. Our observed test statistics greater than this 95thpercentile were considered statistically significant.
To further assess pleiotropy between WBC-associated variants and inflammatory diseases, we performed lookups in published GWASs of various autoimmune diseases (celiac disease [MIM: 212750], inflammatory bowel disease [IBD; MIM: 266600], multi-ple sclerosis [MS; MIM: 126200], primary biliary cirrhosis [PBC; MIM: 109720], psoriasis [MIM: 177900], rheumatoid arthritis [RA; MIM: 180300], systemic lupus erythematosus [SLE; MIM: 152700], type 1 diabetes mellitus [T1D; MIM: 222100]) and coro-nary artery disease (MIM: 608901).22–30 We supplemented the full GWAS summary statistics lookups with the GRASP database31 to include other immunologically relevant clinical phenotypes and quantitative traits. Similarly, to assess whether the WBC vari-ants were associated with other blood cell traits, we obtained effect sizes and p values for these variants from RBC- and platelet-related traits exome array analyses within the BCX consortium.32,33
Functional Annotation of Variants
To assess the functional consequences of coding and non-coding variants associated with WBC traits, we utilized a variety of exist-ing variant annotation resources. Usexist-ing a curated collection of more than 100 separate expression quantitative trait loci (eQTL) datasets, we queried whether our list of WBC-trait loci were also associated with transcript expression in blood-cell-specific eQTL datasets. A general overview of a subset of>50 eQTL studies has been published,34with specific citations for the blood-cell-specific eQTL datasets shown inTable S5. Additional in silico functional annotations were performed with ANNOVAR.35The deleterious-ness of each variant was estimated with the Combined Annota-tion-Dependent Depletion (CADD) score where each variant is assigned a scaled C score; a score of greater than 10 is suggested to indicate deleteriousness.36
Results
We conducted an exome-wide association analyses of total WBC and differential counts (neutrophils, monocytes,
lymphocytes, basophils, and eosinophils) in a discovery sample of ~138,814 individuals of European, African, His-panic, East Asian, and South Asian ancestries across 21
co-horts (Tables 1 and S3). Quantile-quantile plots with
genomic inflation factors and their respective Manhattan
plots for each discovery meta-analysis are presented in
Fig-ures 1,S1, andS2. The discovery effort yielded 144
array-wide significant SNV associations (p value<2.0 3107)
(Table S6). After stepwise conditional analyses, we refined
this list to 28 independent SNV associations with WBC
counts that were not previously reported (Table S7).
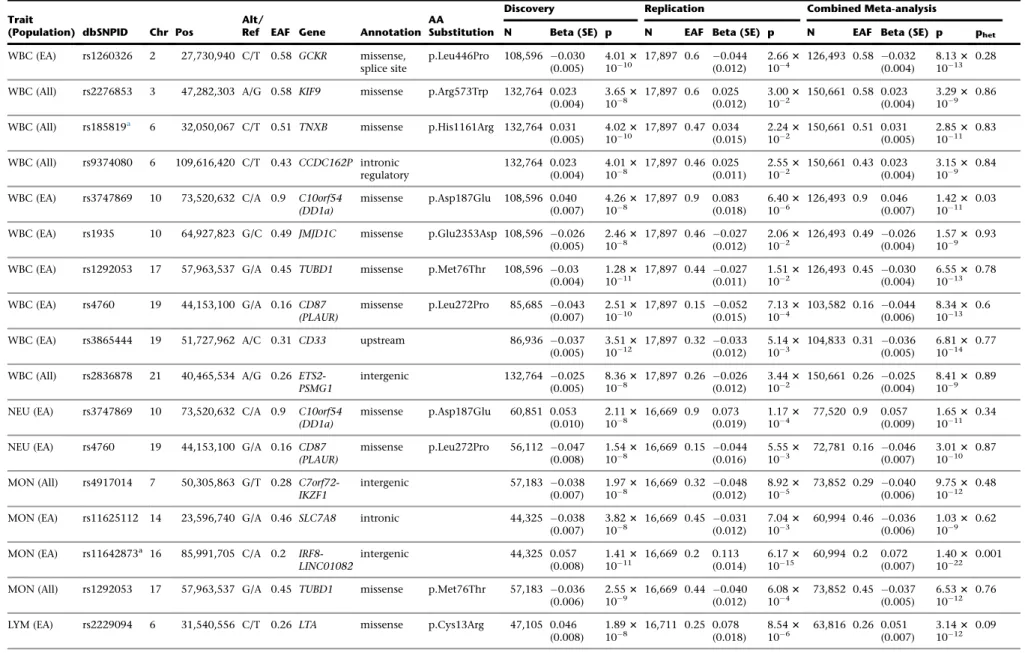
Of these 28 variant associations, 16 were replicated
(p value < 0.05 and consistent direction of effect) in
17,897 independent EA individuals (Figure 1, Table 2).
Fourteen of the replicated loci are located in genomic gions not previously associated with WBC traits. The
re-maining two loci (TNXBrs185819 andIRF8 rs11642873)
represent secondary, independent signals located within a 1 MB window of a previously reported WBC locus. Of the 16 replicated loci, 10 were significantly associated with total WBC count, 2 with neutrophil count, 4 with monocyte count, 2 with lymphocyte count, and 1 with
basophil count. As described further below, several loci
were associated with more than one WBC trait (Table 2);
the WBC-subtype-specific association results for each of
the 16 replicated variants are shown inTable S8. For each
locus, the allele frequencies stratified by ancestry are
shown inTable S9. The full summary Exomechip
associa-tion results for all traits are publicly available online (see
Web Resources).
Total WBC
We found missense variants in a number of genes that were
associated with total WBC. In GCKR (MIM: 600842),
rs126032 (p.Leu446Pro [c.1337T>C]) was associated with
lower total WBC in the EA meta-analysis (p value ¼
8.1331013). This variant was also nominally associated
with lower neutrophil, lymphocyte, and basophil counts in EAs, consistent with its association with total WBC. The rs126032 variant was also associated with lower total
WBC in AAs (p value ¼ 0.014). InKIF9 (MIM: 607910),
rs2276853 (p.Arg573Trp [c.1717C>T]) was associated
with increased total WBC in the multi-ancestry
meta-anal-ysis (p value¼3.293109). The signal was largely driven
Figure 1. Manhattan Plots of p Values of White Blood Cell Traits (A) Discovery association results in the combined all ancestries sample. (B) Discovery association results in the European ancestry samples.
Table 2. Variants Associated with White Blood Cell Traits
Trait
(Population) dbSNPID Chr Pos
Alt/
Ref EAF Gene Annotation AA
Substitution
Discovery Replication Combined Meta-analysis
N Beta (SE) p N EAF Beta (SE) p N EAF Beta (SE) p phet
WBC (EA) rs1260326 2 27,730,940 C/T 0.58 GCKR missense, splice site
p.Leu446Pro 108,596 0.030 (0.005)
4.013 1010
17,897 0.6 0.044 (0.012)
2.663 104
126,493 0.58 0.032 (0.004)
8.133 1013
0.28
WBC (All) rs2276853 3 47,282,303 A/G 0.58 KIF9 missense p.Arg573Trp 132,764 0.023 (0.004)
3.653
108 17,897 0.6 0.025(0.012) 103.0023 150,661 0.58 0.023(0.004) 3.291093 0.86
WBC (All) rs185819a 6 32,050,067 C/T 0.51 TNXB missense p.His1161Arg 132,764 0.031 (0.005)
4.023 1010
17,897 0.47 0.034 (0.015)
2.243 102
150,661 0.51 0.031 (0.005)
2.853 1011
0.83
WBC (All) rs9374080 6 109,616,420 C/T 0.43 CCDC162P intronic regulatory
132,764 0.023 (0.004)
4.013 108
17,897 0.46 0.025 (0.011)
2.553 102
150,661 0.43 0.023 (0.004)
3.153 109
0.84
WBC (EA) rs3747869 10 73,520,632 C/A 0.9 C10orf54 (DD1a)
missense p.Asp187Glu 108,596 0.040 (0.007)
4.263 108
17,897 0.9 0.083 (0.018)
6.403 106
126,493 0.9 0.046 (0.007)
1.423 1011
0.03
WBC (EA) rs1935 10 64,927,823 G/C 0.49 JMJD1C missense p.Glu2353Asp 108,596 0.026 (0.005)
2.463 108
17,897 0.46 0.027 (0.012)
2.063 102
126,493 0.49 0.026 (0.004)
1.573 109
0.93
WBC (EA) rs1292053 17 57,963,537 G/A 0.45 TUBD1 missense p.Met76Thr 108,596 0.03 (0.004)
1.283
1011 17,897 0.44 (0.011)0.027 1.511023 126,493 0.45 (0.004)0.030 6.5510133 0.78 WBC (EA) rs4760 19 44,153,100 G/A 0.16 CD87
(PLAUR)
missense p.Leu272Pro 85,685 0.043 (0.007)
2.513 1010
17,897 0.15 0.052 (0.015)
7.133 104
103,582 0.16 0.044 (0.006)
8.343 1013
0.6
WBC (EA) rs3865444 19 51,727,962 A/C 0.31 CD33 upstream 86,936 0.037
(0.005)
3.513
1012 17,897 0.32 (0.012)0.033 5.141033 104,833 0.31 (0.005)0.036 6.8110143 0.77 WBC (All) rs2836878 21 40,465,534 A/G 0.26
ETS2-PSMG1
intergenic 132,764 0.025
(0.005)
8.363 108
17,897 0.26 0.026 (0.012)
3.443 102
150,661 0.26 0.025 (0.004)
8.413 109
0.89
NEU (EA) rs3747869 10 73,520,632 C/A 0.9 C10orf54 (DD1a)
missense p.Asp187Glu 60,851 0.053 (0.010)
2.113
108 16,669 0.9 0.073(0.019) 1.171043 77,520 0.9 0.057(0.009) 1.6510113 0.34
NEU (EA) rs4760 19 44,153,100 G/A 0.16 CD87 (PLAUR)
missense p.Leu272Pro 56,112 0.047 (0.008)
1.543 108
16,669 0.15 0.044 (0.016)
5.553 103
72,781 0.16 0.046 (0.007)
3.013 1010
0.87
MON (All) rs4917014 7 50,305,863 G/T 0.28 C7orf72-IKZF1
intergenic 57,183 0.038
(0.007)
1.973 108
16,669 0.32 0.048 (0.012)
8.923 105
73,852 0.29 0.040 (0.006)
9.753 1012
0.48
MON (EA) rs11625112 14 23,596,740 G/A 0.46 SLC7A8 intronic 44,325 0.038
(0.007)
3.823
108 16,669 0.45 (0.012)0.031 7.041033 60,994 0.46 (0.006)0.036 1.031093 0.62 MON (EA) rs11642873a 16 85,991,705 C/A 0.2
IRF8-LINC01082
intergenic 44,325 0.057
(0.008)
1.413 1011
16,669 0.2 0.113 (0.014)
6.173 1015
60,994 0.2 0.072 (0.007)
1.403 1022
0.001
MON (All) rs1292053 17 57,963,537 G/A 0.45 TUBD1 missense p.Met76Thr 57,183 0.036 (0.006)
2.553
109 16,669 0.44 (0.012)0.040 6.081043 73,852 0.45 (0.005)0.037 6.5310123 0.76 LYM (EA) rs2229094 6 31,540,556 C/T 0.26 LTA missense p.Cys13Arg 47,105 0.046
(0.008)
1.893 108
16,711 0.25 0.078 (0.018)
8.543 106
63,816 0.26 0.051 (0.007)
3.143 1012
0.09
(Continued on next page)
by the association in EAs (p value¼1.393106) and was apparent for both neutrophil and lymphocyte counts in
EAs and in multi-ancestry meta-analyses. InTNXB(MIM:
600985), rs185819 (p.His1161Arg [c.3428A>G]) was
asso-ciated with increased total WBCs in the multi-ancestry
meta-analysis (p value ¼ 2.85 31011). The association
was consistently significant across EA and AA populations and for all WBC sub-types. The effect allele frequency was comparable between EAs and AAs but varied in the other
ancestry groups. In C10orf54(MIM: 615608), rs3747869
(p.Asp187Glu [c.561T>G]) was associated with increased
total WBC in the EA meta-analysis (p value ¼ 1.42 3
1011). Although rs3747869 was also associated with
neutrophil, monocyte, and eosinophil counts, the signal was not consistent across ancestry groups. The effect allele frequencies were markedly different between EA,
AA, HA, SA, and EAS ancestry groups. In JMJD1C(MIM:
604503), rs1935 (p.Glu2353Asp [c.7059G>C]) was
associ-ated with lower total WBC (p value ¼ 1.57 3 109) in
the EA meta-analysis. Although the rs1935 variant was not consistently associated with total WBC across all the major ethnic groups, it was significant in the HAs
(p value ¼ 5.58 3 103). Significantly low neutrophil,
lymphocyte, and eosinophil counts were also observed
for rs1935. In TUBD1 (MIM: 607344), rs1292053
(p.Met76Thr [c.227T>C]) was associated with lower total
WBC in the EA meta-analysis (p value ¼ 6.553 1013).
This association was similar in EAs and AAs and for
neutro-phil, monocyte, and lymphocyte counts. Finally, inPLAUR
(MIM: 173391) the rs4760 (p.Leu272Pro [c.815T>C])
variant was associated with lower total WBC (p value¼
8.3431013) in the EA meta-analysis. The effect allele
fre-quencies were highly discrepant across ancestries, perhaps explaining why the association was observed only in EAs. The rs4760 association with total WBC was almost entirely due to its strong association with neutrophil counts.
Outside of coding regions, an intronic variant (rs9374080) in CCDC162P was associated with increased total WBC
in the multi-ancestry meta-analysis (p value ¼ 3.15 3
109). The association was consistent across EAs and AAs
and was observed for neutrophil and monocyte counts and was especially strong for basophil counts. The
rs3865444 variant, just upstream ofCD33(MIM: 159590),
was associated with lower total WBC in the EA
meta-analysis (p value ¼ 6.813 1014). The allele frequencies
were highly discrepant across ancestry groups and rs3865444 was not significantly associated with total WBC outside of the EAs. However, the association was consistent across neutrophil, monocyte, and eosinophil counts.
Finally, an intergenic variant (rs2836878) nearETS2(MIM:
164740) and PSMG1 (MIM: 605296) was associated with
lower total WBC in the multi-ancestry meta-analysis
(p value¼8.413109). The association was driven by the
We identified a rare, missense variant in OR4C6
(rs144349650, p.Leu112Val [c.334C>G], EAF ¼ 0.00042)
that was significantly associated with lower total WBC in
the EA discovery analysis (p value¼1.8731011;Table
S7). The allele frequency was rare in all ancestry groups
and did not replicate in additional samples of >17,000
EAs, perhaps due to low statistical power. Likewise, we
identified a burden of rare, missense variants in TAF3
(MIM: 606576) that was significantly associated with
increased total WBC in the EA discovery set (pVT ¼
1.583106;Table S10). However, the signal did not
repli-cate in an additional independent 2,898 samples.
Neutrophil Count
In addition to the associations with total WBC, we identi-fied two missense variants that were associated with neutrophil count at exome-wide significance levels. The
effect estimate of the rs3747869 variant in C10orf54
for total WBC appeared to be a combination of effects from neutrophil, monocyte, and eosinophil counts, though the effect was strongest for neutrophils, largely explaining the overall association with total WBC. The
association between rs4760 inPLAURand total WBC also
appeared to be explained by the association with neutro-phil counts.
The association between the rare, missense rs144349650
variant inOR4C6 was observed for neutrophil counts as
well as total WBC in the EA and multi-ancestry discovery
sets. In gene-based test,OR4C6was associated with
neutro-phil count (pSKAT ¼ 2.563108;Table S10). Likewise, a
burden of rare, missense variants inZNF439was associated
for neutrophil counts in the AA set (pVT¼ 9.573107;
Table S10). Neither theZNF439nor theOR4C6gene-based
association signals replicated.
Monocyte Count
We found mostly non-coding variants associated with monocyte counts at the exome-wide level. One exception was the rs1292053 (p.Met76Thr) missense variant in
TUBD1, for the multi-ancestry meta-analysis (p value ¼
6.53 3 1012). Although the association was consistent
across neutrophil and lymphocyte counts, the association with total WBC was almost entirely driven by the strong association with monocyte counts. An intergenic variant
(rs4917014) nearC7orf72-IKZF1(MIM: 603023) was
asso-ciated with lower monocyte count in the multi-ancestry
meta-analysis (p value¼9.7531012). It was not
associ-ated with any other WBC sub-type. An intronic variant
(rs11625112) in SLC7A8 (MIM: 600749) was associated
with lower monocyte counts in the EA meta-analysis
(p value¼1.033109). We also found a secondary signal,
rs11642873 nearIRF8 (MIM: 601565),37that was
associ-ated with higher monocyte count in the EA meta-analysis
(discovery beta [p value]¼ 0.072 [1.40 31022],
condi-tional beta [p value]¼ 0.054 [1.41 3 1011]). Similar to
their association with monocyte count, both rs11625112 inSLC7A8and rs11642873 nearIRF8had consistent
asso-ciations with basophil and eosinophil counts, but were not seen in AAs and HAs.
Lymphocyte Count
An intronic variant (rs4763879) inCD69(MIM: 107273)
was associated with decreased lymphocyte count in the
EA meta-analysis (p value¼ 1.593 1010). None of the
other sub-types showed an association with rs4763879. The signal was not observed in AAs or HAs. A secondary
missense variant (rs2229094, p.Cys13Arg [c.37T>C]) in
LTA (MIM: 153440) was associated with higher
lympho-cyte count in the EA meta-analysis (p value ¼ 3.14 3
1012). The association was consistent across EAs and
AAs, as well as for neutrophil counts, basophil counts,
and for total WBC. LTA-rs2229094 is located near a
previously reported WBC-associated SNP rs2524079 in
LOC101929772,6 though the LD between these variants
is quite low (r2 ¼ 0.04). Finally, although we observed
a rare, missense variant in TRIM6 (MIM: 607564)
(rs199694284, p.Val258Ala [c.773T>C], EAF in EAs ¼
5.253105, discovery p value¼7.563108) associated
with lymphocyte counts in EAs (Table S7), the association
did not replicate.
Basophil Count
In the EA meta-analysis, we identified a 30 UTR variant
(rs2295764) in ASXL1 (MIM: 612990) associated with
lower basophil count (p value¼1.4631010). This variant
was also associated with lower eosinophil and monocyte counts. The allele frequencies differed across ethnic groups and the association was not observed in AAs or HAs.
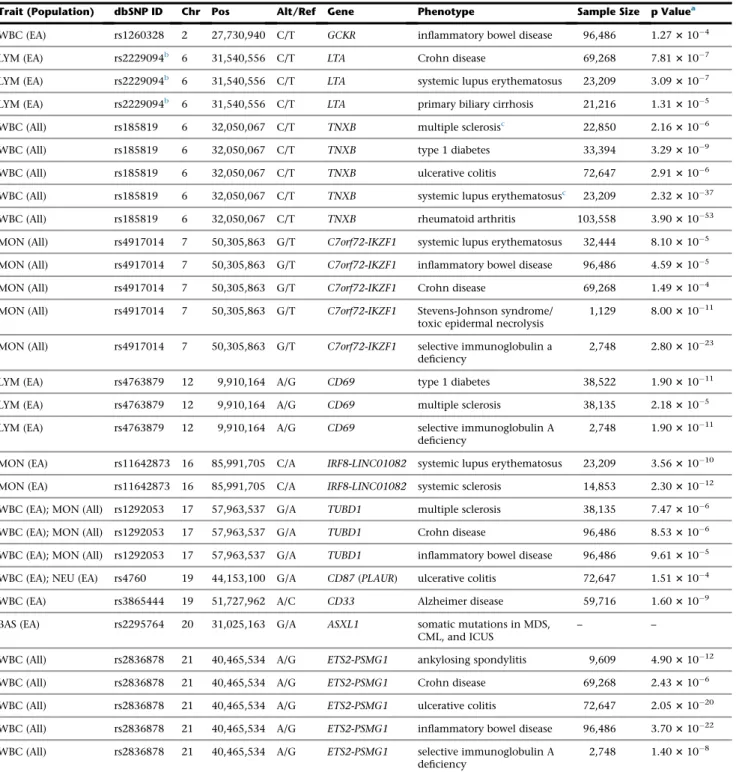
Shared Associations of WBC Loci with Disease Phenotypes
To assess the shared association between these WBC loci and immune-mediated diseases and other relevant clinical phenotypes, we performed a PheWAS in 29,722 individ-uals and queried published GWAS databases of autoim-mune diseases including IBD, MS, RA, SLE, and T1D. The majority of WBC variants discovered by the present study were associated with multiple autoimmune diseases.
PheWAS identifiedTNXB(rs185819, p.His1161Arg)
associ-ated with risk of MS and SLE (Figure 2,Table 3). In lookups
of GWAS databases, after correcting for multiple testing of
16 variants and 15 inflammatory diseases (p value<2.083
104), disease-variant associations were additionally
de-tected for MS (CD69, TUBD1), IBD (GCKR, LTA, TNXB,
IKZF1, TUBD1, ETS2-PSMG1), SLE (LTA, IRF8, TNXB,
IKZF1), RA (TNXB), PBC (LTA), and T1D (CD69, TNXB). Additional associations between immunologically relevant clinical phenotypes and WBC trait variants included selec-tive immunoglobulin A deficiency (MIM: 137100) with
CD69 andIKZF1(p value< 1.90 31011) and between
IRF8 and systemic sclerosis (MIM: 181750) (p value ¼
2.30 31012). The inflammatory marker C-reactive
pro-tein (CRP) was strongly associated withGCKRand
ETS2-PSMG1(p value<4.003108) (Tables 3andS11).
Discussion
In this large-scale exome-wide association meta-analysis of WBC related traits in ~157,622 discovery and replication samples from five ancestries, we discovered 14 primary and 2 secondary SNV associations with total WBC and dif-ferential counts in EAs and the combined multi-ancestry samples, substantially increasing the number of loci associated with these hematologic traits. We observed shared genetic mechanisms influencing variations in WBC counts and susceptibility to chronic inflammatory and autoimmune diseases. These include genes and path-ways involved in hematopoietic stem cell differentiation, apoptosis, cell adhesion, centrosome, and microtubule function.
Our statistical thresholds to declare significance at the
discovery stage (p < 2 3 107 in the single-variant
analyses) was adjusted for the approximate number of variants genotyped on the ExomeChip. Although we did not explicitly correct for testing multiple traits,
the p values of our reported variants (Table 2) all
pass the 5.0 3 108 standard of evidence for
genome-wide association studies of correlated traits.38
Further-more, we relied on independent replication to confirm our observed associations. Despite the limited size of
our replication set, it is noteworthy that we robustly replicated both known and novel WBC variants, suggest-ing a very low probability of reportsuggest-ing false-positive associations.
To quantitatively assess the contribution of loci identi-fied by our Exomechip analysis, we have performed a comparative analysis of the proportion of total WBC phenotypic variance explained in a random sub-sample of 17,306 EAs from our largest discovery cohort, the WHI study. The proportion of variance in total WBC explained by the 28 previously known GWAS loci is 0.0137. The pro-portion of variance explained by the combination of known GWAS loci plus the ten additional Exomechip-identified loci we report is 0.0183. Thus, our Exomechip analysis has resulted in a 34% increase in the proportion of variance explained for total WBC in whites. These re-sults suggest the possibility that exonic variants and/or variants not well-captured by traditional GWAS arrays may make an important contribution to the genetic archi-tecture of WBC traits.
Loci Involving Hematopoietic Lineage Differentiation and Activation of Cell Surface Receptors
Consistent with the pattern of association of theCD33
in-dex SNP rs3865444 with lower total WBC count involving
Figure 2. Pleiotropy Plot Showing Shared Genetic Loci between WBC Traits and Autoimmune Inflammatory and Other Immune-Mediated Diseases
all myeloid lineages (and lower platelet count) (Table S12), CD33 is an early myeloid differentiation antigen and cell surface receptor that binds sialic acid-containing ligands and mediates diverse inhibitory functions of
WBC in the innate immune system.39CD33is also highly
expressed on the surface of acute myeloid leukemia (AML)
cells. CD33 rs3865444 is in complete LD with CD33
rs12459419 (p.Ala14Val), the presumed functional variant
that results in lower full-length CD33 expression due to
skipping of exon 2.40
Table 3. Association of White Blood Cell Trait Variants with Immune-Mediated Diseases and Clinical Phenotypes in Previous Genome-wide Association Studies
Trait (Population) dbSNP ID Chr Pos Alt/Ref Gene Phenotype Sample Size p Valuea
WBC (EA) rs1260328 2 27,730,940 C/T GCKR inflammatory bowel disease 96,486 1.273104
LYM (EA) rs2229094b 6 31,540,556 C/T LTA Crohn disease 69,268 7.813107
LYM (EA) rs2229094b 6 31,540,556 C/T LTA systemic lupus erythematosus 23,209 3.093107
LYM (EA) rs2229094b 6 31,540,556 C/T LTA primary biliary cirrhosis 21,216 1.313105
WBC (All) rs185819 6 32,050,067 C/T TNXB multiple sclerosisc 22,850 2.163106
WBC (All) rs185819 6 32,050,067 C/T TNXB type 1 diabetes 33,394 3.293109
WBC (All) rs185819 6 32,050,067 C/T TNXB ulcerative colitis 72,647 2.913106
WBC (All) rs185819 6 32,050,067 C/T TNXB systemic lupus erythematosusc 23,209 2.3231037
WBC (All) rs185819 6 32,050,067 C/T TNXB rheumatoid arthritis 103,558 3.9031053
MON (All) rs4917014 7 50,305,863 G/T C7orf72-IKZF1 systemic lupus erythematosus 32,444 8.103105
MON (All) rs4917014 7 50,305,863 G/T C7orf72-IKZF1 inflammatory bowel disease 96,486 4.593105
MON (All) rs4917014 7 50,305,863 G/T C7orf72-IKZF1 Crohn disease 69,268 1.493104
MON (All) rs4917014 7 50,305,863 G/T C7orf72-IKZF1 Stevens-Johnson syndrome/
toxic epidermal necrolysis
1,129 8.0031011
MON (All) rs4917014 7 50,305,863 G/T C7orf72-IKZF1 selective immunoglobulin a
deficiency
2,748 2.8031023
LYM (EA) rs4763879 12 9,910,164 A/G CD69 type 1 diabetes 38,522 1.9031011
LYM (EA) rs4763879 12 9,910,164 A/G CD69 multiple sclerosis 38,135 2.183105
LYM (EA) rs4763879 12 9,910,164 A/G CD69 selective immunoglobulin A
deficiency
2,748 1.9031011
MON (EA) rs11642873 16 85,991,705 C/A IRF8-LINC01082 systemic lupus erythematosus 23,209 3.5631010
MON (EA) rs11642873 16 85,991,705 C/A IRF8-LINC01082 systemic sclerosis 14,853 2.3031012
WBC (EA); MON (All) rs1292053 17 57,963,537 G/A TUBD1 multiple sclerosis 38,135 7.473106
WBC (EA); MON (All) rs1292053 17 57,963,537 G/A TUBD1 Crohn disease 96,486 8.533106
WBC (EA); MON (All) rs1292053 17 57,963,537 G/A TUBD1 inflammatory bowel disease 96,486 9.613105
WBC (EA); NEU (EA) rs4760 19 44,153,100 G/A CD87(PLAUR) ulcerative colitis 72,647 1.513104
WBC (EA) rs3865444 19 51,727,962 A/C CD33 Alzheimer disease 59,716 1.603109
BAS (EA) rs2295764 20 31,025,163 G/A ASXL1 somatic mutations in MDS,
CML, and ICUS
– –
WBC (All) rs2836878 21 40,465,534 A/G ETS2-PSMG1 ankylosing spondylitis 9,609 4.9031012
WBC (All) rs2836878 21 40,465,534 A/G ETS2-PSMG1 Crohn disease 69,268 2.433106
WBC (All) rs2836878 21 40,465,534 A/G ETS2-PSMG1 ulcerative colitis 72,647 2.0531020
WBC (All) rs2836878 21 40,465,534 A/G ETS2-PSMG1 inflammatory bowel disease 96,486 3.7031022
WBC (All) rs2836878 21 40,465,534 A/G ETS2-PSMG1 selective immunoglobulin A
deficiency
2,748 1.403108
Abbreviations: Chr, chromosome; Pos, basepair position; Alt, effect allele; Ref, reference allele; CML, chronic myelogenous leukemia; ICUS, Idiopathic cytopenia of undetermined significance; MDS, myelodysplastic syndrome, WBC, white blood cell; NEU, neutrophil; MON, monocyte; LYM, lymphocyte; BAS, basophil.
aSignificant results are shown after correcting for multiple testing of 16 variants and 15 diseases (p<2.083104). When multiple studies report the same
variant-trait associations, results from the largest sample size are presented here.
bLDr2between rs2229094 and rs1799964 is 0.75. c
Phenome-wide association results. Permutation p value for association with multiple sclerosis was 0.0122.
PLAUR encodes for the
glycosyl-phosphatidylinositol-anchored urokinase plasminogen activator receptor
(UPAR). UPAR, also known as CD87, is a differentiation
antigen on cells of the myelomonocytic lineage and also an activation antigen on monocytes and T
lympho-cytes.41,42 The deleterious coding variant of CD87
rs4760A>G (p.Leu272Pro)36 is also a strong eQTL for
CD87 expression in monocytes and whole blood (Table
S13). In addition to its role in plasminogen activation
and fibrinolysis, UPAR is involved in cell adhesion, migra-tion, and chemotaxis and is a regulator of the uptake by
macrophages of apoptotic neutrophils.43 It is possible
that the latter mechanism might explain the selective asso-ciation of rs4760 with lower neutrophil count.
TheCD69intronic allele rs4763879G>A was associated
with lower lymphocyte count but not with other WBC
types. Accordingly, CD69 encodes a calcium-dependent
lectin superfamily of type II transmembrane cell surface re-ceptor involved in regulation of lymphocyte
prolifera-tion.44 As an early activation marker of lymphocytes,
CD69 inhibits egress of lymphocytes into the circulation by downregulating sphingosine-1-phosphate receptor
type 1 (MIM: 601974).44Notably,CD69rs4763879
corre-lates with the expression of CD69 in monocytes and
with the expression of C-type lectin domain family
member genes CLECL1 and CLEC2D in lymphoid cells
(Table S13).
The intronic variant rs9374080 of non-coding RNA/
pseudogene CCDC162P has been previously associated
with red blood cell traits—lower mean corpuscular
vol-ume, mean corpuscular hemoglobin45—and with platelet
traits (Tables S11andS12). In this study, we extend the
as-sociation of rs9374080 to higher total WBC and
myeloid-derived cell counts, including basophil count (Table S8).
The index SNP is located ~70 kb 30 of CD164 (endolyn)
(MIM: 603356), which encodes a small transmembrane sialomucin protein on the surface of early hematopoietic progenitors, maturing erythroid cells, and activated
baso-phils.46CD164regulates CXCR4/CXCL12 signaling in
he-matopoietic precursor cells.47The region of association is
located within a putative regulatory region enriched in epigenomic marks and ChIP-seq sites for various
hemato-poietic transcription factors (GATA1, TAL1) in K562
erythroleukemia and lymphoblastoid cell lines.48 These
observations fit with the broad pattern of association of this variant with multiple blood cell lineages.
Loci Involving Hematopoietic Transcription Factors and Epigenetic Modifiers
We identified variants in or near multiple genes encoding hematopoietic transcription factors that are associated
with WBC traits. These loci include IRF8-LINC01082,
C7orf72-IKZF1, SLC7A8-CEBPE, JMJD1C, ASXL1, and
ETS2-PSMG1.
The 30 UTR variant rs2295764 of ASXL1, which was
significantly associated withASXL1transcript expression,
was associated with lower basophil count and to a lesser
degree with lower monocyte and eosinophil counts and also to some extent with higher red cell distribution width
(Tables S12 and S13). ASXL1 is a chromatin binding
transcriptional regulator of the polycomb group and
he-matopoietic tumor suppressor gene.49JMJD1C is also an
epigenetic regulator of gene expression, probably through
histone demethylation.50The association betweenJMJD1C
and lower WBC counts (this study), platelet count, mean
platelet volume, and platelet reactivity51indicate
multi-lineage effects on hematopoiesis. JMJD1C was originally
identified as a ligand-dependent interacting partner of
thyroid hormone and androgen receptors.52 In human
myeloid leukemia cells,JMJD1Cfunctions as a coactivator
for the leukemogenic transcriptional complex
RUNX1-RUNX1T1 to increase AML cell proliferation and
sur-vival.53An intergenic variant rs2836878 located between
ETS2andPSMG1showed evidence of multi-lineage associ-ation with lower total WBC count across all myeloid cell types and to a lesser extent with lower platelet count and
higher hemoglobin (Table S12); rs2836878 is a
whole-blood eQTL forETS2(Table S13).ETS2is another
proto-oncogene that encodes for a transcription factor involved in stem cell development, cell senescence, and death,
whereas the product ofPSMG1is involved in maturation
of proteasomes.ETS2, which is highly expressed in
mono-cytes but not in granulomono-cytes, has been shown to be involved in macrophage differentiation, regulation of megakaryocytic gene expression, T cell development, and phenotypic switch from erythroid to megakaryocytic
development in hematopoietic cells.54
We identified several variants associated with monocyte count in loci that involve hematopoietic transcription
fac-tor genes (IRF8,SLC7A8, and IKZF1), further supporting
their role in regulation of myelopoiesis and granulocyte/ monocyte lineage fate. The minor C allele of rs11642873,
located 35 kb 30ofIRF8, was associated with higher
mono-cyte count (and to a lesser degree with higher eosinophil
and basophil counts) (Table S8). In eQTL analysis, an
IRF8variant rs17445836 is in moderate LD with theIRF8
rs11642873 variant (r2 ¼ 0.48) that has a cis-regulatory
effect on IRF8 expression in CD14þ monocytes (Table
S13). IRF8 encodes a transcription factor critical for
myeloid lineage commitment by promoting differentia-tion of monocytes/dendritic cells and suppressing
granul-poiesis.55Irf8/mice have a myeloproliferative disorder
with markedly increased number of macrophages and granulocytes in bone marrow, spleen, and lymph nodes as well as increased number of granulocytes in peripheral
blood, suggesting a tumor-suppressive role ofIRF8.56
Another non-coding variant associated with lower monocyte count, and to a lesser extent with lower basophil and eosinophil counts, was the intronic variant
rs11625112 of SLC7A8, which encodes an amino acid
transporter highly expressed in absorptive epithelia of
the kidney and small intestine and also in the brain.57
The index SNP is located within a blood cell DNase
hematopoietic transcription factor essential for terminal differentiation and functional maturation of
granulo-cytes.58Recent data also suggest a role ofCEBPEisoforms
in differential regulation of eosinophil production as well
as in the monocyte-granulocyte lineage decision.59
The transcription factor encoded byIKZF1or Ikaros was
initially described as a regulator of lymphoid lineage
differ-entiation and hematopoietic progenitor cell self-renewal.60
An Ikaros isoform selectively expressed in myeloid precur-sor cells was subsequently found to regulate myeloid
differentiation.60 The minor allele of intergenic variant
rs4917014 in C7orf72-IKZF1 associated selectively with
lower monocyte count is located ~50 kb upstream of
IKZF1within an LD block enriched in hematopoietic cell DNase hypersensitivity sites and enhancer histone markers, several of which are also located within ChIP-seq binding sites for the myeloid transcription factor
PU.1.48The index SNP is also a monocyte and whole blood
trans-eQTL for several immune response genes (Table S13). Further studies are required to assess whether the upstream
IKZF1orCEBPEregulatory elements harboring the index SNP are important for isoform- or lineage-specific mono-cyte development.
Loci Involved in Regulation of Cell Death and Apoptosis
Apoptosis regulates hematopoietic stem cells and main-tains the balance between cell proliferation and cell
death.61 Altered apoptotic processes contribute to the
development of autoimmune and other inflammatory
dis-eases.62We identified associations between WBC traits and
coding variants in two additional genes involved in
apoptosis.C10orf54rs3747869 (p.Asp187Glu) was
associ-ated with higher total WBC and neutrophil counts. The
product of C10orf54 (also known as Death Domain
1-alpha,DD1a), a direct transcriptional target of p53,
regu-lates apoptosis and clearance of apoptotic cells, processes that are critical for resolution of inflammation, immune
tolerance, and regulation of autoimmune responses.63
DD1ais exclusively expressed within the hematopoietic
compartment (monocytes, mature T cells, and macro-phages) and functions as a negative immune checkpoint
regulator for T cell activation and response.64
LTArs2229094 (p.Cys13Arg) was associated with higher
lymphocyte count.LTAencodes a member of the tumor
necrosis factor family involved in lymphoid organ
devel-opment and apoptosis.65Loss ofLTAwas associated with
a 4-fold increase in B lymphocytes in peripheral blood
count in mice.65 The index missense SNP is also a cis
-eQTL forLTAandNFKBIL1(MIM: 601022) (Table S13).
Loci Involved in Other Cellular and Inflammatory Processes
We identified several missense variants (TNXB rs185819
[p.His1161Arg], TUBD1 rs1292053 [p.Met76Thr], and
KIF9rs2276853 [p.Arg573Trp]) in genes involved in other
cellular processes that might be relevant to WBC
produc-tion or immune funcproduc-tion. TNXB encodes a member of
the tenascin family of extracellular matrix glycoproteins
and inhibits cell adhesion and migration.66 The index
SNP localizes to the major histocompatibility complex
class III region on chromosome 6 and overlaps ATF6B
and CYP21A2 at its 50 and 30 ends, respectively. The missense SNP is also an eQTL in blood or lymphoblastoid
cell lines for several class II HLA genes (Table S13). The
pattern of association ofTNXBrs185819 suggests an effect
at an early stage of myeloid and lymphoid differentiation.
ATF6B, a member of the ATF6-related family of transcrip-tion factors that operate in the unfolded protein
response,67is also a key virulence factor for Toxoplasma
gondii.68
Although the role ofTUBD1andKIF9on hematopoiesis
is not known, both genes are involved in the structure and function of microtubules and centrosomes that are
impor-tant for cell division and proliferation.69TUBD1encodes
for delta-tubulin microtubule protein that is associated
with centrosome structure and function. The TUBD1
rs1292053 (p.Met76Thr), which was associated with both total WBC and monocyte counts, and to some extent with red cell and platelet parameters, is in LD with a
num-ber of SNPs in neighboring genesRPS6KB1andRNFT1and
is a blood eQTL forRNFT1(Tables S12andS13).RPS6KB1
encodes a member of the ribosomal S6 kinase family of serine/threonine kinases and is part of the PI3K/AKT/ mTOR signaling pathway that plays a central role in a wide spectrum of cellular activities, including cell
prolifer-ation, survival, and differentiation.70The PI3K pathway is
also involved in Toll-like receptor (TLR) signaling and
release of cytokines from macrophages,71 and a proxy
SNP of TUBD1 rs1292053 has been associated with
CRP.72 KIF9 is a member of the kinesin family of genes
related to microtubule binding and microtubule motor
ac-tivity. TheKIF9rs2276853 variant is in LD with about 50
other variants spanning two other genes, SETD2 and
KLHL18, several of which are within epigenomic blood
cell marks and eQTLs forKIF9,KLHL18, andNBEAL2.48
The GCKR rs1260326 variant is an eQTL for SNX17,
which has been associated with T cell activation and is a binding protein for human papillomavirus L2 capsid
protein and for NRBP1, which binds a Dengue virus
protein.48,73
Relationship of WBC Loci to Autoimmune and Chronic Inflammatory Diseases
Abnormal immune response by lymphocytes and other white blood cells directed against self-antigens can lead to tissue injury and development of autoimmune
dis-eases.74Our results add to recent evidence that genetic
fac-tors controlling WBC and immune cell counts contribute
to autoimmune disease risk.75Several loci involve
regula-tion of cellular mechanisms critical in the development of autoimmune diseases such as modulation of
autoim-mune reactivity (CD69)76 and apoptosis (LTA, DD1a,
CD87).43,63
The majority of our WBC-associated loci that showed substantial overlap were also associated with risk of various autoimmune and inflammatory diseases including IBD, RA, SLE, T1D, PBC, systemic sclerosis, Alzheimer disease,
and Stevens-Johnson syndrome (Figure 2, Table 3).
Although many of these genetic susceptibility loci are shared between different autoimmune diseases, other loci appear to be more restricted to particular cellular contexts. For example, there is an over-representation of SLE loci expressed selectively in B cells; RA-associated loci are
pref-erentially expressed in CD4þ effector T memory cells;
epithelial-associated stimulated dendritic cell genes in Crohn disease; and monocyte-specific eQTLs among
neurodegenerative disease variants.77,78
Abnormal inflammatory response and activation of mi-croglial cells are linked with the development of AD and other neurodegenerative diseases. The WBC-associated
gene CD33 is among the inflammation-related AD risk
loci identified by GWASs.79 A variant in this gene was
shown to modulateCD33exon 2 splicing efficiency,
lead-ing to abnormal activation of microglial cells that are tissue-resident macrophages of the brain derived from
monocyte lineage cells.79In eQTL analysis of
neuropatho-logically normal human brain tissues,CD33rs3865444 is a
cis-eQTL of C-type lectin domain family 11 member A
(CLEC11A) that functions as growth factor for
hemato-poietic progenitor cells.80 Several of the same loci are
involved in susceptibility to infectious diseases (IRF8and
mendelian susceptibility to mycobacterial disease [MIM:
209950],81TNXBassociated with T. gonadii and climatic
adaptation,68,82 malaria with ABO [MIM: 110300] and
DARC,3,83CD87with clearance of bacteria84), highlighting
the evolutionary trade-offs between protection against pathogens and risk of chronic disease later in life.
Relationship of WBC Loci to Hematologic Disease and Therapy
Hematopoiesis is controlled by the differential expression of key transcription factors that act cooperatively to main-tain a well-orchestrated balance of hematopoietic stem cell
self-renewal and differentiation.85These functions of
tran-scription factors are frequently dysregulated in leukemia by chromosomal translocations, mutations, or aberrant expression and lead to abnormal self-renewal. Several of the WBC loci have additional relationships to
hemato-logic disease and therapeutics.CD33 is expressed in the
brain and on AML blasts and leukemic stem cells and has therefore been exploited therapeutically as a target
for anti-leukemic therapy.40 The CD33 rs3865444 and
rs12459419 variants associated with lower WBC count and alternative splicing of exon 2, respectively, have been associated with both Alzheimer disease risk and
AML treatment efficacy.40The exon 2 region ofCD33 is
important for sialic acid binding, microglial cell phagocy-tosis of beta-amyloid, and an epitope recognized by the antibody-targeted chemotherapy agent gemtuzumab
ozo-gamicin.40,86CD87is expressed on various immune cells
including neutrophils, monocytes, macrophages, T cells, and basophils, as well as endothelial cells and
hepato-cytes.41,87The cleaved soluble form of CD87 might have
a role in hematopoietic stem/progenitor cell
mobiliza-tion.88
Somatic mutations inASXL1are associated with risk of
myelodysplastic syndrome (MDS [MIM: 614286]), chronic myelomonocytic leukemia (CMML [MIM: 607785]), and idiopathic cytopenia of undetermined significance
(ICUS).49,89,90 Knockdown of Asxl1 in mouse results in
impaired lymphoid and myeloid differentiation and
multi-lineage cytopenias.91Collectively, these results
sug-gest that both germline and somatic mutations inASXL1
cause lower blood cell counts. The transcription factor
ETS2 has been shown to regulate phenotypic switch
from erythroid to megakaryocyte in acute megakaryocytic
leukemia (AMKL), and overexpression of ETS2results in
altered sensitivity to chemotherapy drugs.54Recent studies
have shown that IKZF1 deletions and mutations that
caused reduction of Ikaros activity are highly associated
with development of acute lymphoblastic leukemia.92,93
On the other hand, depletion ofJMJD1Cleads to growth
impairment of a variety of leukemic cell types without
noticeable effects on normal hematopoietic cells.52
There-fore, JMJD1C is a potentially relevant drug target for
leukemia.
Besides the single-variant association results, we con-firmed previously reported gene-based association results
for WBC count (CXCR2)12and monocytes (IL17RA) (N.P.,
U.M.S., J.B.-J., and M.-H.C., unpublished data). We also identified an additional gene putatively associated with
WBC count (TAF3).IL17RAis widely expressed in
myelo-monocytic cells, lymphocytes, and bone marrow stromal cells and is part of the IL-17 cytokine signaling pathway that plays role in hematopoiesis, promotes inflammation, and is implicated in autoimmune diseases such as
psoria-sis, RA, and IBD.94TAF3, which encodes for a TATA-box
binding protein, is located nearGATA3, a transcription
fac-tor important for T lymphocyte differentiation. Variants in
TAF3 are associated with mean corpuscular hemoglobin
concentration95whereasGATA3variants have been
associ-ated with susceptibility to hematologic malignancies.96
Despite our large sample size, power to detect rare variants of more modest effect, either individually or aggregated into gene-based tests, may be limited. Future studies will require enormous sample sizes, probably considerably larger than in the current study, in order to detect addi-tional rare variants (both individually and in aggregate) of moderate effect sizes associated with complex traits.