ASTRONOMY
AND
ASTROPHYSICS
The kinematic and spatial deployment
of compact, isolated high-velocity clouds
R. Braun1and W.B. Burton2
1 Netherlands Foundation for Research in Astronomy, P.O. Box 2, 7990 AA Dwingeloo, The Netherlands 2 Sterrewacht Leiden, P.O. Box 9513, 2300 RA Leiden, The Netherlands
Received 23 July 1998 / Accepted 2 October 1998
Abstract. We have identified a class of high–velocity clouds which are compact and apparently isolated. The clouds are
com-pact in that they have angular sizes less than 2 degreesFWHM.
They are isolated in that they are separated from neighboring emission by expanses where no emission is seen to the detection limit of the available data. Candidates for inclusion in this class
were extracted from the Leiden/Dwingeloo Hisurvey of
Hart-mann & Burton (1997) and from the Wakker & van Woerden (1991) catalogue of high–velocity clouds identified in the sur-veys of Hulsbosch & Wakker (1988) and of Bajaja et al. (1985). The candidates were subject to independent confirmation us-ing either the 25–meter telescope in Dwus-ingeloo or the 140–foot telescope in Green Bank. We argue that the resulting list, even if incomplete, is sufficiently representative of the ensemble of compact, isolated HVCs – CHVCs – that the characteristics of their disposition on the sky, and of their kinematics, are reveal-ing of some physical aspects of the class. The sample is more likely to be representative of a single phenomenon than would a sample which included the major HVC complexes. We con-sider the deployment of the ensemble of CHVCs in terms used by others to ascertain membership in the Local Group, and show that the positional and kinematic characteristics of the compact HVCs are similar in many regards to those of the Local Group galaxies. The velocity dispersion of the ensemble is minimized in a reference frame consistent with the Local Group Standard of
Rest. The CHVCs have a mean infall velocity of 100 km s−1in
the Local Group reference frame. These properties are strongly suggestive of a population which has as yet had little interac-tion with the more massive Local Group members. At a typical distance of about 1 Mpc these objects would have sizes of about
15 kpc and gas masses, MHI, of a few times 107M,
corre-sponding to those of (sub-)dwarf galaxies.
Key words: ISM: clouds – Galaxy: kinematics and dynamics – galaxies: Local Group – radio lines: ISM
1. Introduction
The term High Velocity Cloud (HVC) has traditionally been
as-signed to features detected in theλ21 cm line of neutral
hydro-Send offprint requests to: R. Braun or W.B. Burton
gen emission which (1) have a radial velocity which is discrepant from that due to Galactic rotation in the direction of the feature (Muller et al. 1963) and (2) subsequently prove to have no
obvi-ous stellar counterpart. Aberrant velocity Hifeatures which do
have a detected stellar counterpart are, of course, classified as galaxies. It is obvious that this empirical definition of an HVC is not altogether satisfactory, but it underlines the fact that despite some 35 years of study, no generally accepted explanation for the origin, the distance and hence the basic properties of these enigmatic features has yet emerged. The class is effectively de-fined by what they are not. These are features which are not
related in a simple way to the bulk of Galactic Hivia spatial
or kinematic continuity and for which we are not yet aware of an associated stellar or gaseous component. This last point in particular is one that has by no means been addressed ex-haustively and may well prove to be a fruitful avenue for future study. Indeed, recent efforts to detect associated diffuse ionized
gas in Hαemission are beginning to meet with some success
(Reynolds et al. 1998).
It must be stressed that the term HVC encompasses a fairly wide range of observational phenomena. The distinct system of
Hifeatures known as the Magellanic Stream was first
recog-nized by Mathewson, Cleary & Murray (1974) to represent tidal debris originating in the gravitational interaction of the Galaxy with both the Large and Small Magellanic Clouds. This sys-tem subtends an extremely large solid angle, defining a belt that encircles the entire Galaxy. Given the spatial deployment and kinematic continuity of this system it can be plausibly assigned a distance of some tens of kpc. Some of the well-studied HVC complexes (known as A, C, H and M) are also distributed over large regions of some tens of square degrees. The distances of two of these complexes have been constrained by absorption– line observations: Danly et al. (1993) determined Complex M
to lie within the distance range1.7< d <5kpc, and van
Wo-erden et al. (1998) found Complex A to lie within the range
It is this last category of compact, peculiar velocity Hi emis-sion features which we consider here. The lack of obvious as-sociation with either the Galaxy or the large HVC complexes and their similar angular size may allow definition of a sin-gle class of HVCs, whose members plausibly originated under common circumstances and share a common subsequent evo-lutionary history. By utilizing the Leiden/Dwingeloo Survey of
Hiemission of Hartmann & Burton (1997) and the HVC
cata-log of Wakker & van Woerden (1991) we have compiled a list of candidate sources. Confirming observations were obtained of all candidates. A representative sample of 66 compact, isolated HVCs (or CHVCs) has emerged, including 23 sources cataloged here for the first time. The sample is distributed quite uniformly over the sky, and yet defines a well-organized kinematic sys-tem. The kinematic signature of this system suggests a strongly in-falling population associated with the Local Group gravita-tional potential. At a typical distance of 1 Mpc they have the
dimensions (15 kpc) and gas masses (MHI ∼ 107.5M) of
(sub-)dwarf galaxies. A similar suggestion was made by Blitz et al. (1998) based on a more heterogeneous sample of HVCs.
Our discussion is organized as follows. We begin by de-scribing the method of sample selection in Sect. 2, proceed with a description of the newly acquired observations in Sect. 3 and continue with a presentation and discussion of our results in Sects. 4 and 5.
2. Sample selection
The Leiden/Dwingeloo Survey (hereafter abbreviated as the
LDS, Hartmann and Burton 1997) of Hiemission in the
North-ern sky above declination about−30◦has made it possible to
select a well-defined sample of candidate sources of small angu-lar size. This survey provides nearly uniform spatial sampling
on a 0◦.5 grid at a sensitivity of about TB = 0.07 K rms at a
velocity resolution of 1 km s−1over the VLSRrange of−450
to+400km s−1. When smoothed to the typical HVC velocity
width of 20 km s−1, the LDS sensitivity is about 0.02 K rms.
The earlier HVC survey of Hulsbosch & Wakker (1988) already
provided spatial sampling on a 1◦grid above−17◦declination
with an rms sensitivity of about TB = 0.01 K rms at a
veloc-ity resolution of 16.5 km s−1 over the VLSR range of−950
to+800km s−1. The southern sky coverage of Hulsbosch &
Wakker was supplemented with data taken on a 2◦grid at about
half the sensitivity by Bajaja et al. 1985. A catalog based on these two HVC databases was presented by Wakker & van Woerden (1991, hereafter WW91). Since both of the northern surveys were carried out with the Dwingeloo 25 m telescope, with a beam size of about 35 arcmin, neither is Nyquist sampled, but no sources should slip completely through the cracks of the LDS sampling.
An issue of particular concern in a single-coverage survey with a total power instrument, is that of the effect of intermittent radio frequency interference (RFI) on the results. As noted by Hartmann (1994), RFI is often of the form of extremely narrow-band signals which are easily recognized as artificial when seen in a moderately high-resolution spectrum. However, some types of intermittent emission of unknown origin are characterized
by a broad spectral signature which is impossible to distinguish from a naturally occurring spectral line profile. Only repeated total-power or interferometric observations can be used to dis-tinguish such broad events from naturally ocurring ones.
We have searched the LDS database for all compact, isolated
Hiemission features. The method used to identify candidates
was to construct a series of “channel maps” of Hiemission, each
integrated over a velocity interval of 32 km s−1 and spanning
the entire spatial coverage of the survey (δ >−30◦). Compact
features (less than 2◦FWHM) were cataloged which were
spa-tially and kinematically distinct from Galactic Hiemission. The
condition of kinematic distinction from the Galaxy corresponds approximately to deviation velocities, as defined by Wakker
(1991), of about 50 km s−1or greater. A total of 123 candidates
was then subject to new, confirming observation as described in Sect. 3, either using the Dwingeloo 25–meter telescope or, for the weaker of the candidates, the 140–foot telescope of the NRAO in Green Bank.
The 44 candidates whose reality was confirmed in the new data entered the tabulation of CHVCs. Some of the candidates on the initial list extracted from the Leiden/Dwingeloo survey could not be confirmed. In some cases, the initial candidate was only of marginal signal–to–noise ratio. In other cases the second–epoch Dwingeloo spectra were not of sufficient quality to confirm the feature. We note that the interference environment in Dwingeloo had deteriorated substantially during the period between 1993, when the last observations for the LDS were made, and late 1997 and early 1998 when the confirmations were attempted. However, a number of the candidate sources turned out to correspond to cases of non-repeatable broad-band inter-ference. Many of the sources which we could confirm were sub-sequently imaged with small Nyquist-sampled pointing grids to more accurately determine source positions and sizes as de-scribed below.
The first step in compiling the list of compact, isolated HVCs was based on inspection of the Leiden/Dwingeloo survey alone, without consulting any earlier material. In a second step, we con-sulted the catalog of Wakker & van Woerden (1991), extract-ing from it all entries identified with a value of the parameter
N ≤3, i.e. referring to HVC detections based on an
observa-tion at a single pointing, or, at most, on 3 spectra and therefore having a surface area of less than about 4 square degrees. This is true of fully 430 of the total of 561 HVCs cataloged in WW91. We extracted LDS spectra at each of these 430 HVC positions. Of these, 59 had no data in the LDS, since they were below the
−30◦southern declination limit, 94 could not be confirmed to
the sensitivity of the LDS, 62 had a marginal confirmation and 216 could be confirmed with some confidence. Subsequently, we produced images of integrated HI emission at the position of each of the 216 confirmed WW91 sources integrated over
a velocity range of 100 km s−1centered on the cataloged
ve-locity centroid. Although all of these sources represent real Hi
power contour of each source in our images of integrated Hi emission had an area of less than 4 square degrees and (2) that to the sensitivity limit of the LDS the source was not connected to a diffuse emission complex. Only 42 of the 216 confirmed WW91 sources could satisfy those criteria and only 22 of these had not already been included in our sample.
In a final step, we consulted other publications which had reported HVCs which met our criteria of compactness and iso-lation, but found that these few sources, referenced in column 13 of the table, had already been recovered during the first two steps. We note in this regard that Davies’s (1970) cloud,
hvc120−20−444, was excluded by our isolation criterion –
it is less than1◦ removed from intense emission from M31 –
whereas we have no reason to think that this cloud does not show the same intrinsic properties characteristic of the CHVC objects in our tabulation.
3. Data
Observations were obtained with the Dwingeloo 25 m telescope in the periods 1997 September 17 to 19, 1997 November 27 to December 15 and 1998 March 2 to 3, for a total of about 21 days. A variety of switching methods, central frequencies, and total bandwidths was employed in an attempt to optimize baseline quality and avoid locally generated narrow band interference. The most successful strategy employed position switching to a nearby reference position and a total bandwidth of 10 MHz
cen-tered within a few hundred km s−1of the Local Standard of Rest.
The correlator provided 1024 spectral channels across the band. The single-polarization receiver had a typical system tempera-ture of 35 K. Spectra were calibrated in amplitude with regular
observations of the standard region S8, at (l, b)=(207◦.0,−15◦.0),
for which a peak line brightness of TB= 71 K and line integral
of 840 K km s−1over the VLSRinterval−5to+22km s−1was
assumed (Williams 1973, Hartmann 1994).
Candidate source positions were initially observed with a single pair of on-source and off-source pointings separated by two degrees in galactic latitude. The typical on-source integra-tion time was 6 minutes, providing an rms sensitivity of about
0.04 K at a velocity resolution of 2 km s−1 in the calibrated
spectra. As time permitted, confirmed sources were reobserved
with a3×3grid with a pointing separation of 15 arcmin and
subsequently with an additional3×3 grid with a 30 arcmin
pointing separation.
Additional observations were made with the Green Bank 140–foot telescope of the NRAO in 1997 September and 1997 December. A total bandwidth of 10 MHz was employed centered near the candidate frequency. The correlator provided 512 spec-tral channels in each of two polarizations. The typical system temperature was 20 K. Calibration spectra were obtained on the standard region S8. The observations were made in frequency switched mode with a 10 MHz switch to higher frequency. Typ-ical on-source integration times were less than about 5 minutes.
4. Results
Our catalog of 66 isolated CHVCs is shown in Table 1. The columns of the table are defined in the following way.
Column 1: Running identifying number in the catalog.
Column 2: The integer rounded Galactic longitude and latitude together with the integer rounded LSR velocity. All three co-ordinates in the designation are derived from the best available data for each source as outlined below.
Column 3: I/C = Initial/Confirmation data. The initial source of the candidate positions and velocities was either the LDS, indi-cated by “LD” in this column, or Wakker & van Woerden (1991), indicated as “W”. Confirming data were required in all cases to establish the repeatability of the source spectrum. In some cases the LDS provided independent confirmation of the “W” sources, while in other cases new data were obtained with the NRAO 140-foot telescope in Green Bank, denoted with “GB” or the Dwingeloo 25-m telescope, denoted with “D”. Those cases where Nyquist sampled maps were made with the Dwingeloo telescope are indicated with the designation “Dm”.
Columns 4 and 5: Galactic(l, b)coordinates of the source
cen-troid as determined from the new Nyquist sampled images of
the integrated Hiwhere available (designated with a “Dm” in
column 3) and otherwise from the integrated Hi data of the
LDS. Positional accuracy is about 5 arcmin for the “Dm” data and about 15 arcmin for the LDS.
Columns 6 and 7: J2000 right ascension and declination co-ordinates of the source centroid. Positional accuracy is about 5 arcmin for the “Dm” data and about 15 arcmin for the LDS.
Columns 8 and 9: The radial velocity measured with respect to the Local Standard of Rest and Galactic Standard of Rest. For those members of the ensemble which were subject to
de-tailed mapping, thevLSRrefers to the velocity at the centroid
position; for the other CHVCs, the velocity is that following from a Gaussian decomposition of the representative spectrum plotted in Fig. 1. The galactic standard of rest is defined by
vGSR= 220 cos(b) sin(l) +vLSR.
Columns 10, 11 and 12: The peak brightness temperature of the Gaussian component resulting from decomposition of the
representative spectrum plotted in Fig. 1, the fwhm velocity
width, and the integrated flux contributed by the component.
Columns 13, 14 and 15: The deconvolved major and minor axis
FWHM dimensions and the major axis position angle (East
of North) in(l, b)coordinates. These are derived from the new
Nyquist-sampled images of the integrated Hiwhere available
(designated with a “Dm” in column 3) and otherwise from the
integrated Hidata of the LDS.
Column 16: References to earlier mentions of the tabulated
HVCs, coded as follows:bbwh99, Burton, Braun, Walterbos,
& Hoopes 1999;cm79, Cohen & Mirabel 1979;g81, Giovanelli
1981;gh77, Giovanelli & Haynes 1977;h78, Hulsbosch 1978;
h92, Henning 1992;m81, Mirabel 1981;mc79, Mirabel &
Co-hen 1979;w#, Wakker & van Woerden 1991; andwr79, Wright
1979.
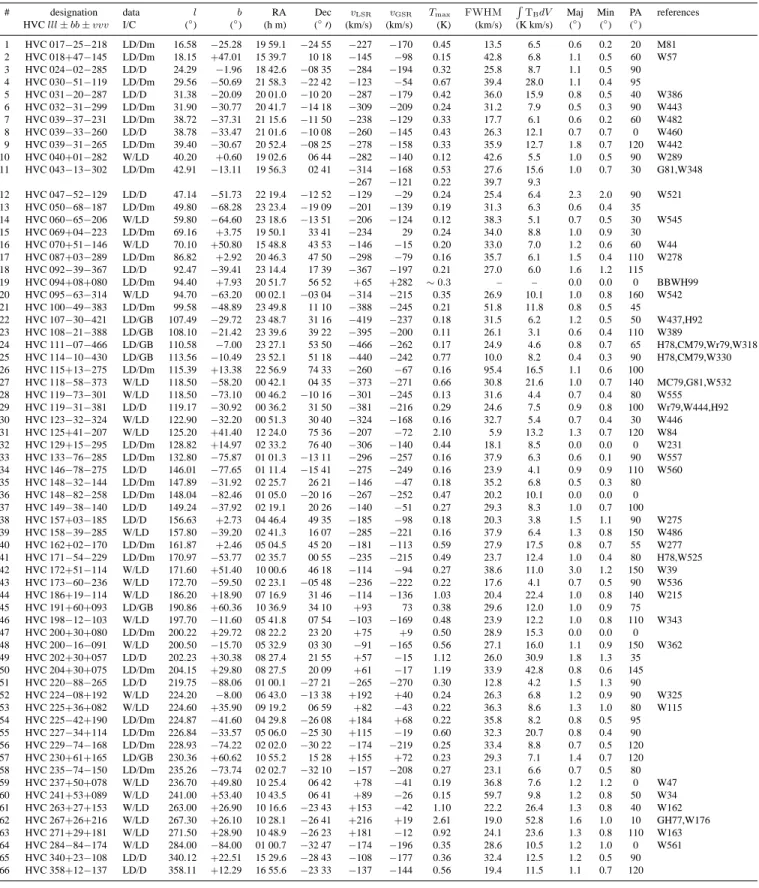
Each of the CHVCs is illustrated in Fig. 1 where the
inte-grated Hiintensity from the vicinity of each source is displayed,
together with a representative Hispectrum. The images were
Table 1. Compact, isolated high-velocity clouds.
# designation data l b RA Dec vLSR vGSR Tmax FWHM RTBdV Maj Min PA references HVClll±bb±vvv I/C (◦) (◦) (h m) (◦0) (km/s) (km/s) (K) (km/s) (K km/s) (◦) (◦) (◦)
1 HVC 017−25−218 LD/Dm 16.58 −25.28 19 59.1 −24 55 −227 −170 0.45 13.5 6.5 0.6 0.2 20 M81 2 HVC 018+47−145 LD/Dm 18.15 +47.01 15 39.7 10 18 −145 −98 0.15 42.8 6.8 1.1 0.5 60 W57 3 HVC 024−02−285 LD/D 24.29 −1.96 18 42.6 −08 35 −284 −194 0.32 25.8 8.7 1.1 0.5 90 4 HVC 030−51−119 LD/Dm 29.56 −50.69 21 58.3 −22 42 −123 −54 0.67 39.4 28.0 1.1 0.4 95 5 HVC 031−20−287 LD/D 31.38 −20.09 20 01.0 −10 20 −287 −179 0.42 36.0 15.9 0.8 0.5 40 W386 6 HVC 032−31−299 LD/Dm 31.90 −30.77 20 41.7 −14 18 −309 −209 0.24 31.2 7.9 0.5 0.3 90 W443 7 HVC 039−37−231 LD/Dm 38.72 −37.31 21 15.6 −11 50 −238 −129 0.33 17.7 6.1 0.6 0.2 60 W482 8 HVC 039−33−260 LD/D 38.78 −33.47 21 01.6 −10 08 −260 −145 0.43 26.3 12.1 0.7 0.7 0 W460 9 HVC 039−31−265 LD/Dm 39.40 −30.67 20 52.4 −08 25 −278 −158 0.33 35.9 12.7 1.8 0.7 120 W442 10 HVC 040+01−282 W/LD 40.20 +0.60 19 02.6 06 44 −282 −140 0.12 42.6 5.5 1.0 0.5 90 W289 11 HVC 043−13−302 LD/Dm 42.91 −13.11 19 56.3 02 41 −314 −168 0.53 27.6 15.6 1.0 0.7 30 G81,W348
−267 −121 0.22 39.7 9.3
12 HVC 047−52−129 LD/D 47.14 −51.73 22 19.4 −12 52 −129 −29 0.24 25.4 6.4 2.3 2.0 90 W521 13 HVC 050−68−187 LD/Dm 49.80 −68.28 23 23.4 −19 09 −201 −139 0.19 31.3 6.3 0.6 0.4 35 14 HVC 060−65−206 W/LD 59.80 −64.60 23 18.6 −13 51 −206 −124 0.12 38.3 5.1 0.7 0.5 30 W545 15 HVC 069+04−223 LD/Dm 69.16 +3.75 19 50.1 33 41 −234 29 0.24 34.0 8.8 1.0 0.9 30 16 HVC 070+51−146 W/LD 70.10 +50.80 15 48.8 43 53 −146 −15 0.20 33.0 7.0 1.2 0.6 60 W44 17 HVC 087+03−289 LD/Dm 86.82 +2.92 20 46.3 47 50 −298 −79 0.16 35.7 6.1 1.5 0.4 110 W278 18 HVC 092−39−367 LD/D 92.47 −39.41 23 14.4 17 39 −367 −197 0.21 27.0 6.0 1.6 1.2 115
19 HVC 094+08+080 LD/Dm 94.40 +7.93 20 51.7 56 52 +65 +282 ∼0.3 – – 0.0 0.0 0 BBWH99 20 HVC 095−63−314 W/LD 94.70 −63.20 00 02.1 −03 04 −314 −215 0.35 26.9 10.1 1.0 0.8 160 W542 21 HVC 100−49−383 LD/Dm 99.58 −48.89 23 49.8 11 10 −388 −245 0.21 51.8 11.8 0.8 0.5 45
22 HVC 107−30−421 LD/GB 107.49 −29.72 23 48.7 31 16 −419 −237 0.18 31.5 6.2 1.2 0.5 50 W437,H92 23 HVC 108−21−388 LD/GB 108.10 −21.42 23 39.6 39 22 −395 −200 0.11 26.1 3.1 0.6 0.4 110 W389
24 HVC 111−07−466 LD/GB 110.58 −7.00 23 27.1 53 50 −466 −262 0.17 24.9 4.6 0.8 0.7 65 H78,CM79,Wr79,W318 25 HVC 114−10−430 LD/GB 113.56 −10.49 23 52.1 51 18 −440 −242 0.77 10.0 8.2 0.4 0.3 90 H78,CM79,W330 26 HVC 115+13−275 LD/Dm 115.39 +13.38 22 56.9 74 33 −260 −67 0.16 95.4 16.5 1.1 0.6 100
27 HVC 118−58−373 W/LD 118.50 −58.20 00 42.1 04 35 −373 −271 0.66 30.8 21.6 1.0 0.7 140 MC79,G81,W532 28 HVC 119−73−301 W/LD 118.50 −73.10 00 46.2 −10 16 −301 −245 0.13 31.6 4.4 0.7 0.4 80 W555 29 HVC 119−31−381 LD/D 119.17 −30.92 00 36.2 31 50 −381 −216 0.29 24.6 7.5 0.9 0.8 100 Wr79,W444,H92 30 HVC 123−32−324 W/LD 122.90 −32.20 00 51.3 30 40 −324 −168 0.16 32.7 5.4 0.7 0.4 30 W446 31 HVC 125+41−207 W/LD 125.20 +41.40 12 24.0 75 36 −207 −72 2.10 5.9 13.2 1.3 0.7 120 W84 32 HVC 129+15−295 LD/Dm 128.82 +14.97 02 33.2 76 40 −306 −140 0.44 18.1 8.5 0.0 0.0 0 W231 33 HVC 133−76−285 LD/Dm 132.80 −75.87 01 01.3 −13 11 −296 −257 0.16 37.9 6.3 0.6 0.1 90 W557 34 HVC 146−78−275 LD/D 146.01 −77.65 01 11.4 −15 41 −275 −249 0.16 23.9 4.1 0.9 0.9 110 W560 35 HVC 148−32−144 LD/Dm 147.89 −31.92 02 25.7 26 21 −146 −47 0.18 35.2 6.8 0.5 0.3 80 36 HVC 148−82−258 LD/Dm 148.04 −82.46 01 05.0 −20 16 −267 −252 0.47 20.2 10.1 0.0 0.0 0 37 HVC 149−38−140 LD/D 149.24 −37.92 02 19.1 20 26 −140 −51 0.27 29.3 8.3 1.0 0.7 100 38 HVC 157+03−185 LD/D 156.63 +2.73 04 46.4 49 35 −185 −98 0.18 20.3 3.8 1.5 1.1 90 W275 39 HVC 158−39−285 W/LD 157.80 −39.20 02 41.3 16 07 −285 −221 0.16 37.9 6.4 1.3 0.8 150 W486 40 HVC 162+02−170 LD/Dm 161.87 +2.46 05 04.5 45 20 −181 −113 0.59 27.9 17.5 0.8 0.7 55 W277 41 HVC 171−54−229 LD/Dm 170.97 −53.77 02 35.7 00 55 −235 −215 0.49 23.7 12.4 1.0 0.4 80 H78,W525 42 HVC 172+51−114 W/LD 171.60 +51.40 10 00.6 46 18 −114 −94 0.27 38.6 11.0 3.0 1.2 150 W39 43 HVC 173−60−236 W/LD 172.70 −59.50 02 23.1 −05 48 −236 −222 0.22 17.6 4.1 0.7 0.5 90 W536 44 HVC 186+19−114 W/LD 186.20 +18.90 07 16.9 31 46 −114 −136 1.03 20.4 22.4 1.0 0.8 140 W215 45 HVC 191+60+093 LD/GB 190.86 +60.36 10 36.9 34 10 +93 73 0.38 29.6 12.0 1.0 0.9 75 46 HVC 198−12−103 W/LD 197.70 −11.60 05 41.8 07 54 −103 −169 0.48 23.9 12.2 1.0 0.8 110 W343 47 HVC 200+30+080 LD/Dm 200.22 +29.72 08 22.2 23 20 +75 +9 0.50 28.9 15.3 0.0 0.0 0 48 HVC 200−16−091 W/LD 200.50 −15.70 05 32.9 03 30 −91 −165 0.56 27.1 16.0 1.1 0.9 150 W362 49 HVC 202+30+057 LD/D 202.23 +30.38 08 27.4 21 55 +57 −15 1.12 26.0 30.9 1.8 1.3 35 50 HVC 204+30+075 LD/Dm 204.15 +29.80 08 27.5 20 09 +61 −17 1.19 33.9 42.8 0.8 0.6 145 51 HVC 220−88−265 LD/D 219.75 −88.06 01 00.1 −27 21 −265 −270 0.30 12.8 4.2 1.5 1.3 90 52 HVC 224−08+192 W/LD 224.20 −8.00 06 43.0 −13 38 +192 +40 0.24 26.3 6.8 1.2 0.9 90 W325 53 HVC 225+36+082 W/LD 224.60 +35.90 09 19.2 06 59 +82 −43 0.22 36.3 8.6 1.3 1.0 80 W115 54 HVC 225−42+190 LD/Dm 224.87 −41.60 04 29.8 −26 08 +184 +68 0.22 35.8 8.2 0.8 0.5 95 55 HVC 227−34+114 LD/Dm 226.84 −33.57 05 06.0 −25 30 +115 −19 0.60 32.3 20.7 0.8 0.4 90 56 HVC 229−74−168 LD/Dm 228.93 −74.22 02 02.0 −30 22 −174 −219 0.25 33.4 8.8 0.7 0.5 120 57 HVC 230+61+165 LD/GB 230.36 +60.62 10 55.2 15 28 +155 +72 0.23 29.3 7.1 1.4 0.7 120 58 HVC 235−74−150 LD/Dm 235.26 −73.74 02 02.7 −32 10 −157 −208 0.27 23.1 6.6 0.7 0.5 80 59 HVC 237+50+078 W/LD 236.70 +49.80 10 25.4 06 42 +78 −41 0.19 36.8 7.6 1.2 1.2 0 W47 60 HVC 241+53+089 W/LD 241.00 +53.40 10 43.5 06 41 +89 −26 0.15 59.7 9.8 1.2 0.8 50 W34 61 HVC 263+27+153 W/LD 263.00 +26.90 10 16.6 −23 43 +153 −42 1.10 22.2 26.4 1.3 0.8 40 W162 62 HVC 267+26+216 W/LD 267.30 +26.10 10 28.1 −26 41 +216 +19 2.61 19.0 52.8 1.6 1.0 10 GH77,W176 63 HVC 271+29+181 W/LD 271.50 +28.90 10 48.9 −26 23 +181 −12 0.92 24.1 23.6 1.3 0.8 110 W163 64 HVC 284−84−174 W/LD 284.00 −84.00 01 00.7 −32 47 −174 −196 0.35 28.6 10.5 1.2 1.0 0 W561 65 HVC 340+23−108 LD/D 340.12 +22.51 15 29.6 −28 43 −108 −177 0.36 32.4 12.5 1.2 0.5 90 66 HVC 358+12−137 LD/D 358.11 +12.29 16 55.6 −23 33 −137 −144 0.56 19.4 11.5 1.1 0.7 120
of the LDS data (Hartmann & Burton 1997), centered near the mean velocity of the feature. (In a few cases, the relatively small deviation velocity of the feature required a different setting of
2 3 7 4 8 5 6 2 4 3 18 16 -23 -24 -25 -26 -27 HVC 017-25-218 b l
-500 0 500
0.5 0.0 v(km/s) T 2 3 4 5 2
20 18 16
49 48 47 46 45 HVC 018+47-145 b l
-500 0 500
0.5 0.0 v(km/s) T 2 3 4 5 8 6 7 2 3 26 24 0 -1 -2 -3 -4 HVC 024-02-285 b l
-500 0 500
0.5 0.0 v(km/s) T 4 6 8 10 14 16 12 22 18 24 20 4 8 6
32 30 28 -49 -50 -51 -52 -53 HVC 030-51-119 b l
-500 0 500
0.5 0.0 v(km/s) T 2 4 6 12 8 10 14 2 8 4 6 32 30 -18 -19 -20 -21 -22 HVC 031-20-287 b l
-500 0 500
0.5
0.0
v(km/s) T
3 4
57 6
8
3 6 4
5
34 32 30
-29 -30 -31 -32 HVC 032-31-299 l b
-500 0 500
0.5 0.0 v(km/s) T 3 5 7 9 11 3 5 7 9 40 35 -25 -30 -35 -40 b l HVC 039-37-231 HVC 039-33-260 HVC 039-31-265
-500 0 500
0.5
0.0
v(km/s) T HVC 039-31-265
-500 0 500
0.5
0.0
v(km/s) T HVC 039-33-260
-500 0 500
0.5
0.0
v(km/s) T HVC 039-37-231
1
2
3 4
1
42 40 38
2 1 0 -1 HVC 040+01-282 l b
-500 0 500
0.5 0.0 T v(km/s) 3 6 9 12 21 15 24 18 3 6 44 42 -11 -12 -13 -14 -15 HVC 043-13-302 b l
-500 0 500
0.5 0.0 v(km/s) T 2 4 6 7 9 8 4 6 7 8 2
50 48 46 44 -50 -51 -52 -53 HVC 047-52-129 l b
-500 0 500
0.5 0.0 v(km/s) T 2 3 4 5 6 7 2
55 50 45
-67 -68 -69 -70 HVC 050-68-187 l b
-500 0 500
0.5 0.0 v(km/s) T 2 3 4 5 6 2
65 60 55 50 -63 -64 -65 -66 -67 HVC 060-65-206 l b
-500 0 500
0.5 0.0 T v(km/s) 2 3 4
5 76
2 70 68 5 4 3 2 HVC 069+04-223 b l
-500 0 500
0.5
0.0
v(km/s) T
2 3
46 5
2 3
72 70 68 53 52 51 50 49 HVC 070+51-146 b l
-500 0 500
0.5 0.0 T v(km/s) 2 3 4 5 6 2 3 4 5 88 86 5 4 3 2 1 0 b HVC 087+03-289 l
-500 0 500
0.5
0.0
v(km/s) T
2 3
456
2 94 92 -38 -39 -40 -41 -42 HVC 092-39-367 l b
-500 0 500
0.5 0.0 v(km/s) T 2 4 6 8 14 10 16 2 4 96 94 10 9 8 7 6 HVC 094+08+080 l b
-500 0 500
0.5 0.0 v(km/s) T 2 6 3 7 4 5 8 9 10 2 3 6
4 7
100 95 90
-61 -62 -63 -64 -65 HVC 095-63-314 b l
-500 0 500
0.5 0.0 T v(km/s) 2 410 6 8 2 8 4 6
102 100 98 -47 -48 -49 -50 HVC 100-49-383 b l
-500 0 500
0.5
0.0
v(km/s) T
2
3 4 5
6 2 3 4 108 106 -28 -29 -30 -31 -32 HVC 107-30-421 l b -500 0 0.5 0.0 T v(km/s) 1 1.5 2 2.5 3 1
110 108 106
-20 -21 -22 -23 HVC 108-21-388 b l -500 0 0.5 0.0 T v(km/s) 2 3 4 5 2 4 3 112 110 -5 -6 -7 -8 -9 HVC 111-07-466 l b -500 0 0.5 0.0 T v(km/s) 2 4 6 8 12 10 2 114 112 -9 -10 -11 -12 HVC 114-10-430 b l -500 0 0.5 0.0 T v(km/s)
Fig. 1. Images of integrated Hiemission, paired with a representative spectrum, for each of the 66 compact, isolated HVCs tabulated in our sample. Hiemission is integrated over a velocity extent of 200 km s−1, centered approximately on the mean velocity of the CHVC. The data were extracted from the Leiden/Dwingeloo survey CD–ROM. The associated spectrum refers to the direction in the0.◦5×0.◦5grid nearest to the peak of the integrated emission. For those compact HVCs confirmed with new Green Bank data (as indicated in column 3 of the table), the spectrum displayed was obtained on the 140–foot telescope; for all other entries, the spectrum displayed is from the Leiden/Dwingeloo survey.
represent integrated intensities labelled in units of K km s−1,
which can be converted to column depth in units of Hiatoms
cm−2by multiplying by1.8×1018, under the usual assumption
of negligible optical depth. The representative spectrum refers
to the direction in the0.◦5×0.◦5grid nearest to the peak of
the integrated emission. For those compact HVCs whose real-ity was confirmed in Green Bank (as indicated in column 3 of the table), the spectrum displayed was obtained on the 140–foot telescope; for all other entries, the spectrum displayed is from the Leiden/Dwingeloo survey after a single pass of Hanning smoothing.
4.1. Comments on a few individual CHVCs
The entries in Table 1 represent a range of profile shapes. The
fwhm values, for example, range from 5.9 km s−1,
charac-teristic of a very narrow, cold Hifeature in the conventional
gaseous disk, to 95.4 km s−1, characteristic of some
moder-ately massive external galaxies. We remark here on some of the individual members of the ensemble. It is an important question, of course, whether the tabulation of compact HVCs represents a single physical phenomenon, or whether it contains interlopers from other classes of objects.
One of the objects listed in the table has, in fact,
2 4 6 14 8 116 114 15 14 13 12 HVC 115+13-275 b l
-500 0 500
0.5 0.0 v(km/s) T 3 6 9 12 15 21 18 3 6 12 9 18
122 120 118 116 114 -56 -57 -58 -59 -60 HVC 118-58-373 b l
-500 0 500
0.5 0.0 T v(km/s) 2 3 4 7 2
120 115 110 -71 -72 -73 -74 -75 HVC 119-73-301 b l
-500 0 500
0.5 0.0 T v(km/s) 2 3 4 7 5 6 2 3 120 118 -29 -30 -31 -32 -33 HVC 119-31-381 b l
-500 0 500
0.5 0.0 v(km/s) T 2 3 4 2 3 124 122 -30 -31 -32 -33 -34 HVC 123-32-324 l b
-500 0 500
0.5 0.0 T v(km/s) 2 4 6 14 8 16 10 12 2
128 126 124 43 42 41 40 39 HVC 125+41-207 l b
-500 0 500
0.5 0.0 T v(km/s) 2 4 6 8 2 4 130 128 17 16 15 14 13 HVC 129+15-295 b l
-500 0 500
0.5 0.0 v(km/s) T 2 3 4 5 2 3 4
140 135 130 125 -74 -75 -76 -77 HVC 133-76-285 b l
-500 0 500
0.5 0.0 v(km/s) T 2 3 4 5 2
3 4 5 6 7
155 150 145 140 -76 -77 -78 -79 HVC 146-78-275 b l
-500 0 500
0.5 0.0 v(km/s) T 2 3 4 7 5 6 2 3
150 148 146
-30 -31 -32 -33 -34 HVC 148-32-144 l b
-500 0 500
0.5 0.0 v(km/s) T 2 3 4 5 6 8 7 9 2 3
160 150 140 -81 -82 -83 -84 HVC 148-82-258 b l
-500 0 500
0.5 0.0 v(km/s) T 2 3 5 4 6 7 8 9 10
2 3 4 5
150 148 -36 -37 -38 -39 -40 HVC 149-38-140 l b
-500 0 500
0.5 0.0 v(km/s) T 1 2 5 3 4 1 158 156 4 3 2 1 HVC 157+03-185 l b
-500 0 500
0.5 0.0 v(km/s) T 1 1.5 23.5 2.5 3 1 2.5 1.5
160 158 156
-37 -38 -39 -40 -41 HVC 158-39-285 b l
-500 0 500
0.5 0.0 T v(km/s) 2 4 6 8 12 10 14 2
164 162 160
4 3 2 1 HVC 162+02-170 b l
-500 0 500
0.5 0.0 v(km/s) T 2 4 6 8 12 10 2 4 8 6
174 172 170 168 -52 -53 -54 -55 HVC 171-54-229 b l
-500 0 500
0.5 0.0 v(km/s) T 3 5 7 9 11 3 5 7 11 9
174 172 170 168 53 52 51 50 HVC 172+51-114 l b
-500 0 500
0.5 0.0 T v(km/s) 2 3 6 4 2 3
176 174 172 170 168 -58 -59 -60 -61 HVC 173-60-236 b l
-500 0 500
0.5 0.0 T v(km/s) 3 6 918 12 15 3 6 9
188 186 184
21 20 19 18 17 HVC 186+19-114 l b
-500 0 500
0.5 0.0 T v(km/s) 3 513 7 11 9 3 5 7
194 192 190 188 62 61 60 59 HVC 191+60+093 b l 0 500 0.5 0.0 T v(km/s) 4 10 6 12 8 4
200 198 196
-10 -11 -12 -13 -14 HVC 198-12-103 l b
-500 0 500
0.5
0.0 T
v(km/s)
-500 0 500
0.5
0.0
v(km/s) T HVC 200+30+080
-500 0 500
0.5
0.0
v(km/s) T HVC 202+30+057
-500 0 500
0.5
0.0
v(km/s) T HVC 204+30+075 4
6
8 1012
14 16 18 20 4 6 8 205 200 33 32 31 30 29 28 27 26 b l HVC 200+30+080 HVC 202+30+057 HVC 204+30+075
Fig. 1. (continued)
hvc094+08+080, is a large, nearby, low–surface–brightness
galaxy, Cepheus 1, discovered during the course of this inves-tigation. Deep multicolor and spectroscopic optical follow–up
observations showed the presence of stars and Hiiregions, and
radio synthesis interferometry confirmed that the galaxy has the
optical properties and Hirotation signature of a low–surface–
brightness spiral galaxy (Burton et al. 1999). We have retained this object in our tabulation, and in the various plots. It is
in-structive to see how the Hiproperties of this interloper galaxy
might differ from those of the CHVCs, and how its spatial and kinematic deployment on the sky might resemble that of the ensemble of CHVCs. Warned by the the presence of Cepheus 1 in our compilation, we searched the Digital Sky Survey CD– ROM in the direction of each of the sources listed in the table, but found a clear optical counterpart for no entry other than
hvc094+08+080. We can not rule out that other entries would
reveal an optical counterpart in deeper optical data; indeed, very deep optical searches are called for. Even if no further large galaxy lurks in the tabulation, the distinction between CHVCs and dwarf galaxies with very weak star formation remains to be made. We view establishing the nature of such a distinction as an important challenge.
We note a few of the entries individually:
4.1.1. CHVCs with exceptionally broad,
or exceptionally narrow, Hilines
kine-5 7 9 13 11 17 15 19 21 5 7 15 9
202 200 198 -14 -15 -16 -17 HVC 200-16-91 l b
-500 0 500
0.5 0.0 T v(km/s) 2 4 6 8 2 4 6
240 220 200 180 -86 -87 -88 -89 -90 HVC 220-88-265 b l
-500 0 500
0.5
0.0
v(km/s) T
4 5
6 78
4
226 224 222
-6 -7 -8 -9 -10 HVC 224-08+192 l b
-500 0 500
0.5 0.0 T v(km/s) 4 5 6 7 8 9 4 5 6
226 224 222 38 37 36 35 34 HVC 225+36+82 l b
-500 0 500
0.5 0.0 T v(km/s) 3 5 7 9 11 13 15 3 515 7 13 226 224 -40 -41 -42 -43 HVC 225-42+190 b l
-500 0 500
0.5 0.0 v(km/s) T 4 6 816 10 18 1220 14
4
6 8 10
228 226 -32 -33 -34 -35 HVC 227-34+114 b l
-500 0 500
0.5
0.0
v(km/s) T
-500 0 500
0.5
0.0
v(km/s) T HVC 229-74-168
1.5 2 2.53
3.5 4
1.5 2
234 232 230 228 226 62 61 60 59 HVC 230+61+165 l b 0 500 0.5 0.0 T v(km/s) 4 5
6 87 9 4
5 6
238 236 234 52 51 50 49 48 HVC 237+50+78 l b
-500 0 500
0.5 0.0 T v(km/s) 3 4 5 8 6 9 7 3 4
242 240 238 55 54 53 52 51 HVC 241+53+89 l b
-500 0 500
0.5 0.0 T v(km/s) 5 8 11 14 17 23 5 8 11 14 17 23
264 262 260 29 28 27 26 HVC 263+27+153 b l
-500 0 500
0.5 0.0 T v(km/s) 2 3
46 5
2 3 4 235 230 -71 -72 -73 -74 -75 -76 -77 b HVC 235-74-150 HVC 229-74-168 l
-500 0 500
0.5
0.0
v(km/s) T HVC 235-74-150
5
10
15 2025 5 10 20
15 25 30
342 340 338
25 24 23 22 21 HVC 340+23-108 b l
-500 0 500
0.5 0.0 v(km/s) T 3 5 71113 9 3
5 9 7
360 358 356
14 13 12 11 HVC 358+12-137 l b
-500 0 500
0.5 0.0 v(km/s) T 10 15 20 352540 30 45 50 10 1525 20 30
270 268 266
28 27 26 25 24 HVC 267+26+216 b l
-500 0 500
0.5 0.0 T v(km/s) 6 12 9 15 24 18 27 21 6
274 272 270
30 29 28 27 26 HVC 271+29+181 b l
-500 0 500
0.5 0.0 T v(km/s) 4 6 8 121014
4 6 8
300 280 -82 -83 -84 -85 -86 HVC 284-84-174 l b
-500 0 500
0.5 0.0 T
v(km/s)
Fig. 1. (continued)
matic information is largely unresolved, kinematic consider-ations in addition to the systemic velocity remain relevant.
hvc115+13−275 has a fwhmof 95.4 km s−1; the
excep-tional width of the feature and its location at low b suggests
that a deeper optical look than that afforded by the POSS would
be appropriate, as would an Hisynthesis observation looking
for kinematic structure contributed either by rotation of a single entity or by blending of subunits, each moving with a
differ-ent velocity. hvc114−10−430 and hvc125+41−207 have,
on the other hand, Hisignatures which are exceptionally
nar-row not only for HVCs, but for any Hiemission lines. The line
width ofhvc125+41−207,fwhm= 5.9±1.6km s−1,
corre-sponding toσv = 2.5±0.7km s−1, is sufficiently small that it
may even be used to constrain the kinetic temperature of the gas,
Tk<750K. It also constrains the line–of–sight component of
any rotation or shear in a single object, as well as the range of kinematics if the object should be an unresolved collection of subunits.
4.1.2. CHVCs near the galactic equator
HVCs located on lines of sight traversing the gaseous disk of the Milky Way display the horizontal component of their space motion. Large horizontal motions are difficult to account for
in terms of a galactic fountain model (Shapiro & Field 1976, Bregman 1980). Burton (1997) has noted that HVCs do not
con-taminate the Hiterminal–velocity locus in ways which would
be expected if they pervaded the galactic disk, and that this observation constrains HVCs either to be an uncommon com-ponent of the Milky Way disk, confined to the immediate vicin-ity of the Sun, or else to be typically at large distances
be-yond the Milky Way disk. In our tabulation,hvc024−02−285,
hvc040+01−282, andhvc111−07−466 are examples of low
|b|CHVCs at velocities unambiguously forbidden in terms of
normal galactic rotation. The lines of sight in the directions of each of these features traverse some tens of kpc of the disk be-fore exiting the Milky Way: unless one is prepared to accept these HVCs as boring through the conventional disk (for which there is no evidence), and atypical in view of the cleanliness of the terminal–velocity locus, then their distance is constrained to be large.
4.1.3. CHVCs near the galactic poles
Similarly, HVCs located near the galactic poles offer
unam-biguous information on the vertical, z, component of their
space motion. Burton (1997) noted that the vertical thickness
ofhz ∼100pc, and so consequently the HVCs either do not commonly populate the lower galactic disk/halo transition
re-gion or else thezcomponent dominates the total space motion,
which seems unlikely and is contradicted by the examples in the preceding paragraph. Examples of high vertical velocities from
our tabulation includehvc119−73−301,hvc148−82−258,
andhvc220−88−265. These examples are from the southern
galactic hemisphere, with negative velocities. The distribution
ofzmotions over the entries in the tabulation are clearly skewed
to negative velocities.
4.1.4. CHVCs in the Milky Way cardinal directions
HVCs in the cardinal directions are interesting because some ambiguities are removed in these special cases. For example,
hvc087+03−289, located in the direction of the solar motion
partaking in galactic rotation, has a velocity unambiguously for-bidden for any object within the Milky Way. The substantial
ve-locities ofhvc173−60−236, andhvc358+12−137, located
(albeit at substantial latitudes) in directions perpendicular to the vector of galactic rotation, are also unambiguously forbidden.
4.2. Completeness and homogeneity of the sample
It is appropriate to consider what selection effects might play a role in the statistics derived from the material in Table 1. We comment below on the relevance of the observational parame-ters of sensitivity, velocity coverage, and spatial coverage.
The most stringent of our criteria was the requirement of independent confirmation. The Leiden/Dwingeloo survey does,
however, involve so much data that confirming every 5–σspike
would have taken an investment of telescope time which we were not able to make. There are features, even in the integrated
Hiimages shown here, which we have no reason to consider
spurious, but which we simply have not yet confirmed: in Fig. 1
examples are seen nearl, b=86.◦5,+1.◦0in the moment map of
hvc087+03−289; and nearl, b=43.◦0,−30.◦0in the moment
map ofhvc039−31−265; both of these examples of not–yet–
confirmed features are unambiguously in the HVC regime, and stem from spectra not observed contiguously. (The observing
strategy involved stepping0.◦5 inl, at a constantb, over a5◦
interval of longitude.) We see no reason to expect that these features, and many others, could not be confirmed.
Our use of the terms ‘compact’ and ‘isolated’ is somewhat
subjective, as can be gauged by inspection of the integrated Hi
images. ‘Compact’ is the simpler concept since we have used the somewhat arbitrary definition of a maximum mean angular size (averaged over the major and minor axis of elongated features)
of 2◦ fwhm. The choice of a 2◦limit was motivated by what
appeared to be a natural break point in the size distribution of HVC features cataloged by WW91. ‘Isolated’ refers, of course, to the sensitivity level of the currently available data. It is not ruled out that some of the features which we tabulate as
iso-lated in(l, b, v)space would be shown under scrutiny of more
sensitive data to be embedded in a weaker envelope, or even to be part of a large, but relatively weak, complex or stream. For
example, entries 47, 49, and 50 in our table, adjacent on the sky and at comparable velocities, might prove blended under deeper scrutiny.
The well–known HVC complexes show a range of struc-tures, and within a complex there are certainly knots of enhanced emission (see Wakker & Schwarz 1991). We did not accept such knots, and so could plausibly have discriminated against a com-pact, isolated HVC which happens to lie in projection against an unrelated extended HVC stream.
Although the Leiden/Dwingeloo survey had been corrected for stray radiation (Hartmann et al. 1995), neither the new Dwingeloo nor the new Green Bank data were so corrected. Emission entering the far–sidelobe pattern is largely contributed
by Hilying, at relatively modest velocities, in the conventional
gaseous disk of the Milky Way: stray–radiation is not expected over most of the HVC velocity regime. Furthermore, stray ra-diation is contributed from large solid angles, and thus is dif-fusely distributed, not concentrated into point, or very compact, sources like those entering this discussion. Therefore we view our results as uncontaminated by stray radiation.
Selection of candidate CHVCs from the Leiden/Dwingeloo survey was primarily determined from a significant intensity
after smoothing to 32 km s−1 velocity resolution, and a lack
of blending. On the0.◦5×0.◦5 grid atδ ≥ −30◦, unblended
clouds (i.e. generally those with a deviation velocity greater
than 50 km s−1) emitting with a 5–σ peak intensity greater
thanTB ∼ 0.1K, and with afwhmvelocity extent broader
than 20 km s−1, are unlikely to have been missed. Narrow
clouds (<10 km s−1) weaker than about 0.2 K peak temperature
will be underrepresented in the list drawn from the smoothed
Leiden/Dwingeloo data. Although the fwhmof most of the
CHVCs tabulated here is greater than 20 km s−1, a few are
considerable narrower, and it is not unexpected that some faint sources would be missing from our compilation because they were diluted by a coarse channel spacing. An overall complete-ness level of 0.2 K in peak brightcomplete-ness is indicated.
The total range of the velocity coverage of the
Lei-den/Dwingeloo survey is conservatively quoted as −450 <
vLSR<+400km s−1, but in almost all cases it extends usefully
ten or more km s−1further on both extremes; the total range of
the Wakker & van Woerden material is larger, extending from
−900to+750km s−1. The HVC with the most extreme
ve-locity known is that detected by Hulsbosch (1978), and further observed by Cohen & Mirabel (1979) and by Wright (1979),
tabulated here ashvc111−07−466: itsvLSRis−466km s−1.
Although a few other HVCs are known with velocities less than
−400km s−1, none is known with comparably extreme
posi-tive velocities. Therefore it seems reasonable to expect that the tabulation is not incomplete as a consequence of the velocity range of the observational material.
In the second stage of preparing our list of CHVC candi-dates, we used the Wakker & van Woerden compilation as in-put. The angular lattice size of that material is larger than that of
the Leiden/Dwingeloo survey. Atδ <−18◦, the angular
spac-ing of the Bajaja et al. (1985) data is2◦×2◦. Atδ >−18◦,
is1◦ throughout, but the longitude interval varies from1◦ at
|b| <45◦ to larger values at larger|b|, while maintaining
ap-proximately∆l = 1◦ in true–angle spacing. Even though the
Leiden/Dwingeloo survey is not fully sampled to the Nyquist
level, the0.◦5sampling interval with a360beam renders it
un-likely that a compact HVC, at the intensity level being con-sidered here (0.2 K peak brightness temperature), would have escaped notice in that data because of undersampling. On the other hand, a compact HVC in our tabulation could well remain undetected in the Hulsbosch & Wakker and Bajaja et al. data as a consequence of the relatively coarse grid spacing. Hulsbosch & Wakker (1988) estimate that their material is essentially com-plete for point–source clouds with a central brightness
tempera-ture greater than0.05K which lie on an observational grid point,
but only about 57% complete for point–source clouds with a
cen-tral brightness temperature of0.2K which might not lie on an
observational grid point. Insofar as the WW91N ≤3sources
served as input for subsequent confirmation, there may be some
additional incompleteness in the strip betweenδ =−30◦ and
−18◦, where the Bajaja et al. data represent a coarser (2◦×2◦)
sampling and a somewhat less sensitive detection limit than that of Hulsbosch & Wakker.
The above considerations indicate why some CHVCs (23 of the 66) were found in the Leiden/Dwingeloo data but not in the data used by Wakker & van Woerden. It is also possible that a weak CHVC, fortuitously located in the relevant parame-ter space of the observations, would be detected in the Wakker & van Woerden data but not in the Leiden/Dwingeloo. How-ever, any incompleteness due either to sensitivity, or to lattice size, or to velocity increment, would be approximately the same everywhere on the observed sky, and so would not render the tabulation made here unrepresentative of the compact HVCs.
Other selection effects are plausibly more systematic in spe-cific velocity ranges and in location. Because the compilation involved Dwingeloo data in all cases, either for the initial iden-tification or for the confirmation, or for both, material is miss-ing where the sky is not accessible from the Netherlands. The
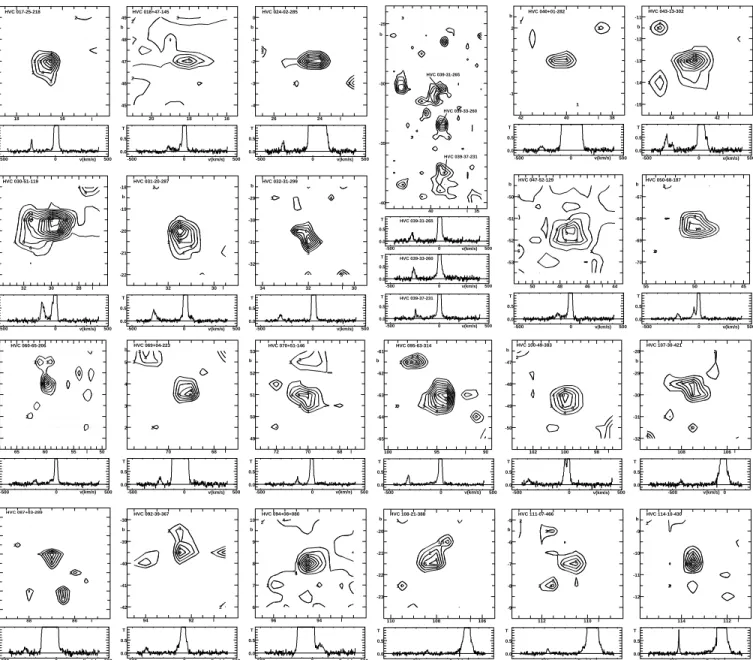
boundary atδ≤ −30◦is indicated by the distorted oval drawn
in Fig. 2. In view of what is known about the distribution of high–velocity clouds in the deep southern hemisphere, it seems reasonable to expect that the southern CHVCs which have been missed would likely be predominantly at positive radial veloc-ities. We note that all 6 of the Local Group galaxies known in
the zoneδ≤ −30◦have positivevLSR.
Members of the ensemble of compact, isolated HVCs will also be missed in spectral regions where substantial blending oc-curs due to foreground or background emission. Thus a CHVC
with Hiproperties similar to those typical of the average listing
in the table would remain undetected if the emission occurred blended with one of the major HVC complexes. Murphy, Lock-man, & Savage (1995) estimate that some 18% of the sky is covered, at some velocities, by HVCs to the limit of the Huls-bosch & Wakker (1988) data. The major HVC complexes are responsible for such a high areal filling factor; the areal filling factor for the CHVCs tabulated here is very small.
Fig. 2. Distribution on the sky of the compact, isolated HVCs, plotted
as filled circles. The sample of CHVCs is unlikely to be complete, but it is, as discussed in the text, homogeneous and probably representative of this class of object. Unlike the major HVC complexes, the CHVCs are distributed rather uniformly over the sky. The sky distribution of Local Group galaxies (from Grebel 1997) is shown by open circles.
The matter of blending becomes more serious at the veloci-ties spanned by the conventional gaseous disk of the Milky Way, because there the areal filling factor reaches 100%. Although all high–velocity clouds will have large space velocities, only the line–of–sight component of the motion is observed. An HVC could have a space velocity characteristic of the phenomenon,
but an observedvLSRof zero. Some known HVCs trespass on
the kinematic regime of IVCs: for example, Complex C can be traced from the HVC regime into the kinematic regime asso-ciated with IVCs. The impressive spatial and kinematic conti-nuities of the Magellanic Stream allow it to be followed as it traverses from highly deviant positive velocities to emerge at deviant negative velocities, even though it is lost due to blend-ing as it crosses the kinematic regime of the conventional Milky Way gaseous disk, with radial velocities near zero.
But the additional information given by the spatial and kine-matic continuities of a major HVC complex do not pertain for a
compact HVC. If a CHVC were to emit nearvLSR= 0km s−1
(and if its total velocity width were not exceptionally large) then it will have gone unnoticed and will likely remain so. Thus de-viation velocity is an incomplete discriminant, although a large deviation velocity is sufficient cause for considering an emission packet as an HVC, unless it can be separately demonstrated that emission is contributed from something else, e.g. from a galaxy. Blending thus limits the detection of compact HVCs to those with substantial deviation velocities. We comment further below on the possible consequences of this limitation.
We conclude that the principal causes for incompleteness of our sample are not systematic in the sense of discriminating against a particular portion of the sky, except for declinations
less than−30◦ and, to a much lesser extent,δ < −18◦, or in
the sense of being kinematically incomplete, except for CHVCs which might have trespassed into the low–deviation regime at
|vLSR| <50km/s. With these caveats, we view the sample as
5. Discussion
We compare below the spatial and kinematic deployment of our CHVC sample with that of the galaxy members of the Local Group as compiled by Grebel (1997). The Local Group mem-bership, as currently estimated, is certainly representative, even if there may be concerns with the completeness of the Local Group galaxy compilation somewhat analogous to those per-taining for the CHVC ensemble. It is not implausible that ad-ditional small galaxies of very low optical surface brightness will be found in the future; it is also not implausible that some Local Group galaxy, with brightness comparable to those al-ready known, remains obscured by the Milky Way, either by dust extinction or by a high density of foreground stars. An-other analogy may be drawn between the Local Group galaxy situation and the situation pertaining to the CHVCs, namely re-garding the influence of the massive Local Group galaxies on the kinematics of objects lying near M31 or the Milky Way. The LMC, SMC, and the Sagittarius dwarf spheroidal, are in orbits dominated by the Milky Way, and M32 and other systems are in orbits dominated by M31, while other Local Group galax-ies may be relatively isolated and distant from either M31 or the Milky Way, and may have experienced different evolution-ary histories. If the CHVCs pervade the Local Group, a similar discrimination may pertain.
Fig. 2 shows the distribution on the sky of the compact, iso-lated HVCs, plotted as filled circles. The locations of galaxies comprising the Local Group (Grebel 1997) are plotted as open circles. The sky distribution of CHVCs shows a rather uniform deployment; in particular, CHVCs do not show the preference for the northern galactic hemisphere which the total–flux HVC distribution does, nor do the CHVCs show any tendency to clus-ter in streams or complexes.
Our primary concern, of course, is to seek information on the characteristic distance of the class of compact high–velocity clouds, as the values of most of the principal physical parameters depend on distance. The additional information which is avail-able for a spatially resolved sample is not availavail-able here. Thus, Blitz et al. (1998) were able to use the angular size of extended, quite well resolved HVCs and HVC complexes to estimate dis-tances in a statistical manner: nearer clouds would, on average, have a larger angular extent than more distant ones. Certain other important kinematic information is also lacking for our sample of generally unresolved sources, such as that pertaining to kinematic gradients across an extended feature due, for ex-ample, to rotation or to shearing. Little information is yet avail-able which might reveal relevant details of the spatial structure
of the CHVCs, except for the two entries,hvc111−07−466
andhvc114−10−430, for which Wakker & Schwarz (1991)
obtained WSRT Hiobservations. It is striking that in both of
those cases, the CHVCs are resolved into elliptical distributions of moderate column density embedded in diffuse envelopes of low column density. Each elliptical concentration shows a veloc-ity gradient along the direction of maximum elongation, rather
suggestive of rotation in a flattened disk system. Further Hi
interferometric observations of the CHVC phenomenon which
might, for example, reveal a head–tail structure suggestive of passage through the halo of the Milky Way or through an inter-galactic medium have not yet been obtained.
We note that because the CHVCs subtend such small angles it will be particularly difficult to find suitable probes for optical or UV absorption–line searches toward sources at known dis-tances, thus possibly, in the most direct way, constraining, or even determining, the distance to a CHVC. It will similarly be particularly difficult to establish the metallicity of a CHVC.
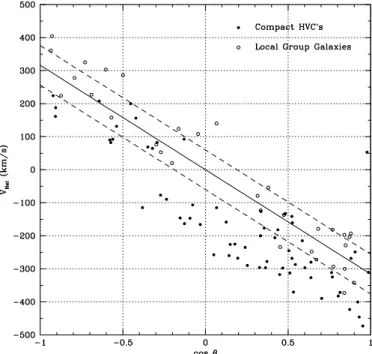
As often done in astronomy, and certainly in Hiwork, we
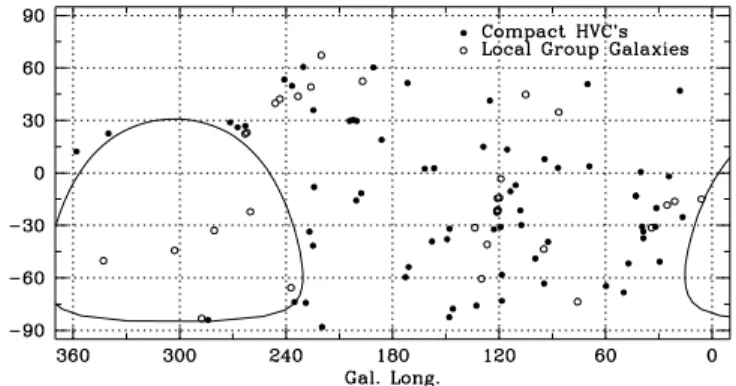
resort to the systemic velocities to support discussion of dis-tances characteristic of the CHVC ensemble. Fig. 3 shows the kinematics of the ensemble of compact, isolated HVCs and of the ensemble of Local Group galaxies, plotted against galactic longitude for four different reference frames.
In the upper panel of Fig. 3, the longitude distribution of the motions of the CHVCs is shown, as filled circles, measured with respect to the Local Standard of Rest, as listed in column 8 of the table. Also plotted, as open circles, is the velocity/longitude distribution of the galaxies in the Local Group, from Grebel’s (1997) catalog. It is appropriate to comment here on possible se-lection effects which might cause systematic distortions to the
true distribution of CHVCs. Theδ = −30◦ declination limit
of the LDS Hiobservations, as indicated in Fig. 2, is likely
to have discriminated against some CHVCs at positivevLSR.
This discrimination will remain in the other panels in Fig. 3, representing velocities in different reference frames. We might take the Small Magellanic Cloud as a test particle illustrative of the missing CHVCs, since it lies most central, of the Local
Group galaxies, in the δ = −30◦ oval plotted in Fig. 2. The
SMC may be followed in the Fig. 3 panels, as the open circle nearl = 303◦. Its velocity drops from+149 km/s in thevLSR
frame, to near zero velocity in thevGSRandvLGSRframes, and
it is plausible to predict that not–yet–detected CHVCs would follow the same general tendency. There may further be a mild discrimination against detecting CHVCs due to their
submer-sion in the “Hizone of avoidance”, i.e. nearvLSR= 0km s−1,
with the velocity distribution slightly skewed to negativevLSR
in galactic quadrant II, and slightly skewed to positive velocities in quadrant III.
In the second panel from the top of Fig. 3, the motions of the CHVC ensemble and of the Local Group galaxies are plotted with respect to the Galactic Standard of Rest; and in the third panel, with respect to the Local Group Standard of Rest. The adopted definitions of the various velocity systems with units
of km s−1are:
vLSR = vHEL+ 9 cos(l) cos(b)
+12 sin(l) cos(b)−7 sin(b) (1)
vGSR = vLSR+ 0 cos(l) cos(b)
+220 sin(l) cos(b) + 0 sin(b) (2)
vLGSR = vGSR−62 cos(l) cos(b)
progres-Fig. 3. Velocities of the ensemble of compact, isolated HVCs and of the
ensemble of Local Group galaxies, plotted against galactic longitude for four different kinematic reference frames. The CHVCs are shown as filled circles; the members of the Local Group, as open circles. In the upper panel, the motions of the CHVCs are shown measured with respect to the Local Standard of Rest; in the second panel from the top, with respect to the Galactic Standard of Rest; and in the third panel, with respect to the Local Group Standard of Rest. Fig. 4 shows histograms of the velocities in these reference frames; the dispersion of the velocities decreases in a progression from thevLSRreference frame, via thevGSRone, to thevLGSRframe. The bottom panel here shows the CHVC motions measured with respect to a reference frame, labeled XSR, which minimizes the dispersion of the motions.
sion from the vLSR reference frame, for whichσLSR = 175
km s−1, via thevGSRone (σGSR= 95km s−1), to thevLGSR
frame, for whichσLGSR= 88km s−1. As noted by Blitz et al.
(1998) a decreasing velocity dispersion for a population gives a good indication that a more appropriate reference frame is be-ing approached. They cite the example of the globular cluster system of the Galaxy, for which the velocity dispersion drops
from 134 to 119 km s−1in going from the LSR to the more
relevant GSR frame.
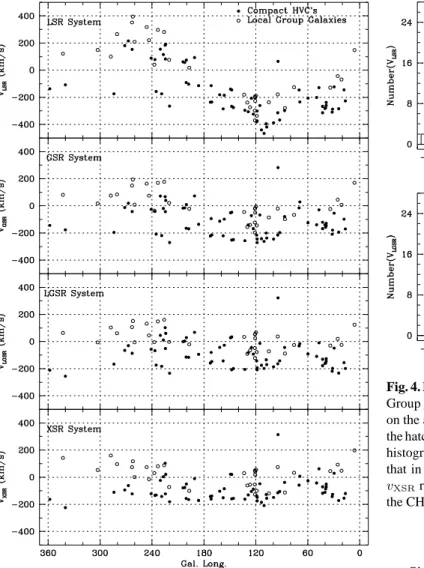
Fig. 4. Histograms of distributions of the CHVC velocities, and of Local
Group galaxy velocities, as measured in the reference frames indicated on the abscissæ. The open histograms represent the CHVC ensemble; the hatched histograms, the Local Group galaxies. The dispersion of the histogram representing thevLGSRframe is significantly smaller than that in thevLSRandvGSR reference frames. The velocities labelled vXSRrefer to a frame which was found to minimize the dispersion of the CHVC velocity distribution.
Since our CHVC sample has both a substantial size and an essentially uniform distribution on the sky (Fig. 2) it is appro-priate to use the sample itself to define a best-fitting velocity reference system. We have determined the direction cosine co-efficients that provide a minimum velocity dispersion of the measured radial velocities. The result of this optimization has been labeled the “XSR system” and is defined by:
vXSR = vGSR+ 0 cos(l) cos(b)
+45 sin(l) cos(b)−90 sin(b) (4)
The velocity dispersion of the CHVC sample in the XSR
system is only σXSR = 69 km s−1. The accuracy of the
co-efficients of the direction cosines, and therefore the implied
solar apex(l, b, v) = (88◦,−19◦,+293km s−1), is,
how-ever, not very high. Varying each coefficient by plus and minus
50 km s−1increases the dispersion of the distribution from its
minimum value to about 75 km s−1. Comparable uncertainties
of perhaps 50 km s−1also apply to the coefficients which
de-fine the LGSR frame,(l, b, v) = (93◦,−4◦,+316km s−1)