Association of Body Mass Index with DNA
Methylation and Gene Expression in Blood
Cells and Relations to Cardiometabolic
Disease: A Mendelian Randomization
Approach
Michael M. Mendelson1,2,3,4☯, Riccardo E. Marioni5,6,7☯, Roby Joehanes1,4,8, Chunyu Liu1,4,9,Åsa K. Hedman10, Stella Aslibekyan11, Ellen W. Demerath12, Weihua Guan13, Degui Zhi14, Chen Yao1,4, Tianxiao Huan1,4, Christine Willinger1,4, Brian Chen4, Paul Courchesne1,4, Michael Multhaup15, Marguerite R. Irvin11, Ariella Cohain16, Eric E. Schadt16, Megan L. Grove17, Jan Bressler17, Kari North18, Johan Sundstro¨ m19, Stefan Gustafsson10, Sonia Shah7,20, Allan F. McRae7,20, Sarah E. Harris5,6, Jude Gibson21, Paul Redmond22, Janie Corley22, Lee Murphy21, John M. Starr5,23, Erica Kleinbrink24, Leonard Lipovich24, Peter M. Visscher5,7,20, Naomi R. Wray7,20, Ronald M. Krauss25, Daniele Fallin15, Andrew Feinberg15, Devin M. Absher26, Myriam Fornage17,30, James S. Pankow12, Lars Lind19, Caroline Fox1,4, Erik Ingelsson10,28, Donna K. Arnett31, Eric Boerwinkle17,27, Liming Liang29‡, Daniel Levy1,4‡*, Ian J. Deary5,22‡ 1 Framingham Heart Study, Framingham, Massachusetts, United States of America, 2 Boston University School of Medicine, Boston, Massachusetts, United States of America, 3 Department of Cardiology, Boston Children’s Hospital, Boston, Massachusetts, United States of America, 4 Population Sciences Branch, National Heart, Lung, and Blood Institute, National Institutes of Health, Bethesda, Maryland, United States of America, 5 Centre for Cognitive Ageing and Cognitive Epidemiology, University of Edinburgh, Edinburgh, United Kingdom, 6 Medical Genetics Section, Centre for Genomic and Experimental Medicine, Institute of Genetics and Molecular Medicine, University of Edinburgh, Edinburgh, United Kingdom, 7 Queensland Brain Institute, University of Queensland, Brisbane, Queensland, Australia, 8 Hebrew SeniorLife, Harvard Medical School, Boston, Massachusetts, United States of America, 9 Department of Biostatistics, Boston University, Boston, Massachusetts, United States of America, 10 Molecular Epidemiology and Science for Life Laboratory, Department of Medical Sciences, Uppsala University, Uppsala, Sweden, 11 Department of Epidemiology, School of Public Health, University of Alabama at Birmingham, Birmingham, Alabama, United States of America, 12 Division of Epidemiology and Community Health, School of Public Health, University of Minnesota, Minneapolis, Minnesota, United States of America, 13 Division of Biostatistics, School of Public Health, University of Minnesota, Minneapolis, Minnesota, United States of America, 14 Department of Biostatistics, School of Public Health, University of Alabama at Birmingham, Birmingham, Alabama, United States of America, 15 Center for Epigenetics, Johns Hopkins University School of Medicine, Baltimore, Maryland, United States of America, 16 Icahn Institute for Genomics and Multiscale Biology and Department of Genetics and Genomic Sciences, Icahn School of Medicine at Mount Sinai, New York, New York, United States of America, 17 Human Genetics Center, School of Public Health, University of Texas Health Science Center at Houston, Houston, Texas, United States of America, 18 Department of Epidemiology, University of North Carolina at Chapel Hill, Chapel Hill, North Carolina, United States of America, 19 Cardiovascular Epidemiology, Department of Medical Sciences, Uppsala University, Uppsala, Sweden, 20 Institute for Molecular Bioscience, University of Queensland, Brisbane, Queensland, Australia, 21 Wellcome Trust Clinical Research Facility, Western General Hospital, University of Edinburgh, Edinburgh, United Kingdom, 22 Department of Psychology, University of Edinburgh, Edinburgh, United Kingdom, 23 Alzheimer Scotland Dementia Research Centre, University of Edinburgh, Edinburgh, United Kingdom, 24 Center for Molecular Medicine and Genetics and Department of Neurology, Wayne State University, Detroit, Michigan, United States of America, 25 Children’s Hospital Oakland Research Institute, Oakland, California, United States of America, 26 HudsonAlpha Institute for Biotechnology, Huntsville, Alabama, United States of America, 27 Human Genome Sequencing Center, Baylor College of Medicine, Houston, Texas, United States of America, 28 Department of Medicine, Division of Cardiovascular Medicine, Stanford University School of Medicine, Stanford, California, United States of America, 29 Departments of Epidemiology and Biostatistics, School of Public Health, Harvard University, Boston, Massachusetts, United States of America, 30 Brown Foundation Institute of Molecular Medicine, University of Texas, Houston, Texas, United States of America, a1111111111 a1111111111 a1111111111 a1111111111 a1111111111 OPEN ACCESS
Citation: Mendelson MM, Marioni RE, Joehanes R, Liu C, HedmanÅK, Aslibekyan S, et al. (2017) Association of Body Mass Index with DNA Methylation and Gene Expression in Blood Cells and Relations to Cardiometabolic Disease: A Mendelian Randomization Approach. PLoS Med 14(1): e1002215. doi:10.1371/journal. pmed.1002215
Academic Editor: Cathryn Lewis, Kings College London, UNITED KINGDOM
Received: January 17, 2016
Accepted: December 8, 2016
Published: January 17, 2017
Copyright: This is an open access article, free of all copyright, and may be freely reproduced, distributed, transmitted, modified, built upon, or otherwise used by anyone for any lawful purpose. The work is made available under theCreative Commons CC0public domain dedication.
31 College of Public Health, University of Kentucky, Lexington, Kentucky, United States of America
☯These authors contributed equally to this work. ‡ These authors are joint senior authors on this work. *[email protected]
Abstract
Background
The link between DNA methylation, obesity, and adiposity-related diseases in the general population remains uncertain.
Methods and Findings
We conducted an association study of body mass index (BMI) and differential methylation for over 400,000 CpGs assayed by microarray in whole-blood-derived DNA from 3,743 par-ticipants in the Framingham Heart Study and the Lothian Birth Cohorts, with independent replication in three external cohorts of 4,055 participants. We examined variations in whole blood gene expression and conducted Mendelian randomization analyses to investigate the functional and clinical relevance of the findings. We identified novel and previously reported BMI-related differential methylation at 83 CpGs that replicated across cohorts; BMI-related differential methylation was associated with concurrent changes in the expression of genes in lipid metabolism pathways. Genetic instrumental variable analysis of alterations in methyl-ation at one of the 83 replicated CpGs, cg11024682 (intronic to sterol regulatory element
binding transcription factor 1 [SREBF1]), demonstrated links to BMI, adiposity-related traits,
and coronary artery disease. Independent genetic instruments for expression of SREBF1 supported the findings linking methylation to adiposity and cardiometabolic disease. Methyl-ation at a substantial proportion (16 of 83) of the identified loci was found to be secondary to differences in BMI. However, the cross-sectional nature of the data limits definitive causal determination.
Conclusions
We present robust associations of BMI with differential DNA methylation at numerous loci in blood cells. BMI-related DNA methylation and gene expression provide mechanistic insights into the relationship between DNA methylation, obesity, and adiposity-related diseases.
Author Summary
Why Was This Study Done?
• Genetic sequence variants explain only a modest proportion of the variation in body mass index (BMI) and cardiometabolic disease in the general population.
• There is limited understanding of the link of DNA methylation—a well-characterized epi-genetic modification—with BMI and cardiometabolic disease in the general population.
are available at dbGaP under the accession number phs000724.v2.p9 and gene expression data at accession number phs000363.v3.p6. Lothian Birth Cohorts’ methylation data have been submitted to the European Genome-phenome Archive under accession number EGAS00001000910; phenotypic data are available at dbGaP under the accession number phs000821.v1.p1.
Funding: The Framingham Heart Study is funded by National Institutes of Health contract N01-HC-25195 and HHSN268201500001I. The Genetics of Lipid Lowering Drugs and Diet Network (GOLDN) epigenetics study is funded by the NIH National Heart, Lung, and Blood Institute grant R01 HL 104135-01. The Atherosclerosis Risk in Communities (ARIC) study is carried out as a collaborative study supported by the National Heart, Lung, and Blood Institute (NHLBI) contracts (HHSN268201100005C, HHSN268201100006C, HHSN268201100007C, HHSN268201100008C, HHSN268201100009C, HHSN2682011000010C, HHSN2682011000011C, HHSN2682011000012C). Funding support for “Building on GWAS for NHLBI-diseases: the U.S. CHARGE consortium” was provided by the NIH through the American Recovery and Reinvestment Act of 2009 (ARRA) (5RC2HL102419). The laboratory work for this investigation was funded by the Division of Intramural Research, National Heart, Lung, and Blood Institute, National Institutes of Health, and by a Director’s Challenge Award, National Institutes of Health (DL, PI). The analytical component of this project was funded by the Division of Intramural Research, National Heart, Lung, and Blood Institute, and the Center for Information Technology, National Institutes of Health, Bethesda, MD. This study utilized the
What Did the Researchers Do and Find?
• We conducted a cross-sectional analysis of the association of BMI with leukocyte DNA methylation at over 400,000 sites in the genome among 7,798 community-dwelling adults.
• We identified associations between BMI and methylation at 83 replicated sites (includ-ing 50 novel sites) and concurrent differences in expression in whole blood of genes overrepresented in lipid metabolism pathways.
• Using genetic sequence variants to model exposure to differential DNA methylation and tissue-specific gene expression, we found differential methylation and expression of SREBF1to be implicated in BMI, adiposity-related traits, and coronary artery disease.
• Using genetic sequence variants to model exposure to differences in BMI, we found a substantial proportion of the differentially methylated sites (16 of 83) to be downstream of BMI.
What Do These Findings Mean?
• Evidence is accumulating that epigenetic modifications, such as DNA methylation, are related to obesity-related diseases in the general population.
• We provide support for a role of genomic regulation of a lipid metabolism transcription factor,SREBF1, in adiposity and coronary artery disease.
• Mendelian randomization approaches can help prioritize relevant loci for future func-tional studies, but the cross-secfunc-tional observafunc-tional nature of our study limits definitive causal inference.
Introduction
Obesity is highly prevalent in developed nations [1] and contributes to a substantial burden of morbidity and mortality [2,3]. Despite advances in the understanding of genetic variants, life-style factors, and gene–environment interactions associated with obesity [4–7], much of the interindividual variation in body weight remains unexplained by measurable lifestyle and genetic factors. DNA methylation, one of the most frequent and well-characterized epigenetic modifications, reflects at the molecular level a wide range of environmental exposures and genetic influences [8]. By stabilizing chromatin structure and altering gene expression, DNA methylation has the potential to affect an individual’s susceptibility to obesity (see review in [9]). Further, changes in the methylation of DNA may occur secondarily to obesity and may consequently influence the development of adiposity-related diseases such as diabetes, dyslipi-demia, hypertension, and cardiovascular disease. Large gaps in knowledge remain as to how human epigenetic modifications relate to obesity and its sequelae.
Epigenetic biomarkers represent a largely untapped precision medicine resource to guide therapy decisions using an individual’s epigenetic profile obtained from blood samples [10].
Cognitive Epidemiology (CCACE). CCACE is supported by funding from the BBSRC, the Economic and Social Research Council (ESRC), the Medical Research Council (MRC), and the University of Edinburgh as part of the cross-council Lifelong Health and Wellbeing initiative (MR/ K026992/1). Research reported in this publication was supported by National Health and Medical Research Council (NHMRC) project grants 613608, APP496667, APP1010374 and APP1046880. NHMRC Fellowships to PMV, and NRW (613602) and Australian Research Council (ARC) Future Fellowship to NRW (FT0991360). AFM is supported by the NHMRC fellowship scheme (1083656). The funders had no role in study design, data collection and analysis, decision to publish, or preparation of the manuscript.
Competing Interests: JS is an advisory board member for Itrim. CF is now an employee of Merck, but was not an employee when the work was conducted. EI is a scientific advisor and consultant for Precision Wellness, Inc. and scientific advisor for Cellink for work unrelated to this paper. IJD has research grants from Age UK and the UK Medical Research Council.
Abbreviations: ARIC, Atherosclerosis Risk in Communities; BMI, body mass index; DHS, DNase I hypersensitive site; eQTL, expression quantitative trait locus; EWAS, epigenome-wide association study; FHS, Framingham Heart Study; GIANT, Genetic Investigation of ANthropometric Traits; GO, Gene Ontology; GOLDN, Genetics of Lipid Lowering Drugs and Diet Network; GTEx, Genotype-Tissue Expression; GWAS, genome-wide association study; IV, instrumental variable; LBC, Lothian Birth Cohort; meQTL, methylation quantitative trait locus; MR, Mendelian
Identification of clinically relevant epigenetic loci in blood holds the potential to create a foun-dation upon which to base future functional studies and trials to test epigenetically guided clin-ical decision making for cardiometabolic diseases. In addition, we may gain novel insights into the molecular underpinnings of obesity and adiposity-related diseases through the study of dif-ferentially methylated DNA loci in blood. Doing so may lead to the identification of biologi-cally relevant therapeutic targets.
The present study provides results of an epigenome-wide association study (EWAS) of body mass index (BMI) in over 3,700 participants from the Framingham Heart Study (FHS) and the Lothian Birth Cohorts (LBCs) of 1921 and 1936 (LBC1921 and LBC1936). We con-ducted independent external replication in over 4,000 individuals from the Atherosclerosis Risk in Communities (ARIC), Genetics of Lipid Lowering Drugs and Diet Network (GOLDN), and Prospective Investigation of the Vasculature in Uppsala Seniors (PIVUS) cohort studies. We examined the functional relevance of the identified loci by interrogating the known trans-tissue regulatory functions and concomitant changes in gene expression in blood. In addition, we explored the clinical relevance of the findings for adiposity-related dis-eases with genetic instrumental variable (IV) analyses using bidirectional and two-step trans-tissue Mendelian randomization (MR) approaches [11–13].
Methods
Study Design
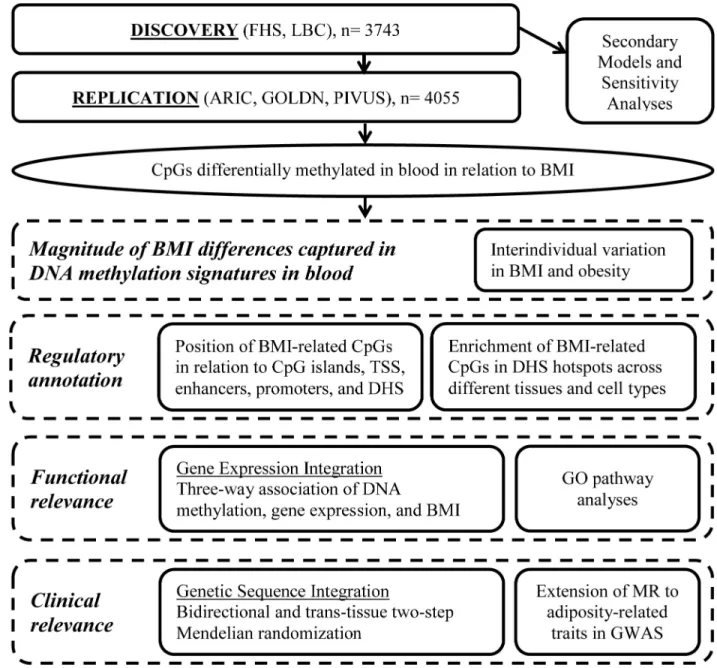
The study includes two major components. First, we conducted an EWAS of BMI. Second, BMI-related differentially methylated loci were taken forward for further analyses to better understand the magnitude of association, regulatory annotation, functional implications, and clinical relevance (Fig 1). The discovery/replication design and secondary models for the BMI EWAS were defined a priori (S1 Text). Downstream analyses to characterize the discovered loci were outlined a priori, but the final approach was primarily driven by the findings and concurrent advancements in the field.
Ethics
The FHS protocols and participant consent forms were approved by the institutional
review board of Boston University School of Medicine. Ethics permission for the LBC1921 was obtained from the Lothian Research Ethics Committee (Wave 1: LREC/1998/4/183). Ethics permission for the LBC1936 was obtained from the Multi-Centre Research Ethics Committee for Scotland (Wave 1: MREC/01/0/56) and the Lothian Research Ethics Committee (Wave 1: LREC/2003/2/29). Written informed consent was obtained from all discovery cohort (FHS and LBC) and replication cohort (ARIC, GOLDN, and PIVUS) participants.
Study Participants
of Scotland. The current study draws upon the older-age baseline examinations of 551 par-ticipants in LBC1921 recruited in 1999–2001 and 1,091 parpar-ticipants in LBC1936 recruited in 2004–2007.
Anthropometric Measurements
Height and weight were measured in each study using established protocols as described in detail in theS1 Methods. BMI was calculated as weight (in kilograms) divided by height (in meters) squared.
Fig 1. Series of analyses conducted for the epigenome-wide association study of body mass index. ARIC, Atherosclerosis Risk in Communities; BMI, body mass index; DHS, DNase I hypersensitive site; FHS, Framingham Heart Study; GO, Gene Ontology; GOLDN, Genetics of Lipid Lowering Drugs and Diet Network; GWAS, genome-wide association study; LBC, Lothian Birth Cohorts; MR, Mendelian randomization; PIVUS, Prospective Investigation of the Vasculature in Uppsala Seniors; TSS, transcription start site.
Molecular Genomics
DNA from whole blood samples was collected at the same examination assessment as the anthropometric and covariate measurements in both studies. DNA methylation, assayed with the Infinium HumanMethylation450 BeadChip [19] (Illumina), was available for 2,846 FHS participants and 1,518 LBC participants (514 from LBC1921 and 1,004 from LBC1936). Details of rigorous quality control, normalization procedures, and exclusions of non-autosomal probes, cross-hybridizing probes, and probes with underlying single nucleotide polymor-phisms (SNPs) are described inS1 Methods. Each discovery and replication cohort conducted cohort-specific preprocessing pipelines that allowed each cohort to address study-specific tech-nical and batch effects. This design allowed for the selection of true biological signals indepen-dent of bias introduced from uniform processing methods. After quality control in the discovery cohorts, there were 402,358 shared CpG (cytosine-phosphate-guanine) methylation probes available for analyses in 2,377 FHS and 1,366 LBC participants (446 from LBC1921 and 920 from LBC1936). Final sample size was determined by the number of community-based participants in the discovery cohorts who consented to genomic studies and who had available DNA and methylation assays passing quality control measures. In the FHS, SNP data were obtained from the Affymetrix 550K Array imputed to the 1000 Genomes Project reference panel, as previously reported [20]. The LBC samples were genotyped using the Illumina Human610-Quad v1.0 genotyping platform and imputed to the 1000 Genomes Project refer-ence panel as well. Gene expression in blood was available in the FHS and was measured using the Affymetrix Human Exon 1.0 ST GeneChip as described inS1 Methods.
Epigenome-Wide Association Study of BMI
In the FHS, linear mixed effects regression models were conducted to test the association between site-specific DNA methylation and BMI. The primary model was adjusted for age, sex, family relatedness (random effect), and surrogate variables (to account for differential cell proportions and technical effects) [21], with BMI as the independent variable of interest and DNA methylation (inverse-normal transformed) as the dependent variable. In the LBC, linear regression models were conducted adjusting for age, sex, and white blood cell counts, with each DNA methylation probe (residual taken forward from a generalized linear model with a logistic link function adjusting for technical and batch effects) as the dependent variable and BMI as the independent variable of interest. Further analytical details for the discovery cohorts are described inS1 Methods. In both cohorts, secondary models were conducted: (1) addition-ally adjusting for smoking status, (2) restricted to participants with BMI 18–35 kg/m2in order to avoid confounding due to frailty or morbid obesity and obesity-related diseases, and (3) testing for age and sex interactions. Results from the FHS and LBCs were meta-analyzed using methods that weighted thep-value by sample size [22]. Directional consistency of statistically significant cohort-specific effects was confirmed for all methylome-wide significant findings from the discovery meta-analysis. We focused our analyses on the resultant test statistic and direction of effect from the independent variable of interest (BMI) as the cohort-specific linear regression coefficients were not directly comparable due to the differences in the preprocessing approach between cohorts. The threshold for statistical significance in the discovery phase was defined by Bonferroni correction for multiple testing to be 0.05/405,000 (p-value<1.2×10⁻⁷). A flowchart of analyses conducted is presented inFig 1.
External Replication of EWAS Findings
microarray: the ARIC study, using whole-blood-derived DNA from 2,096 participants of Afri-can ancestry; the GOLDN study, using DNA derived from CD4+ cells from 992 participants of European ancestry; and the PIVUS study, using whole blood-derived DNA from 967 partici-pants of Swedish ancestry. Description and analytical methods of the replication cohorts are supplied inS1 Methods. Replication cohorts also conducted cohort-specific preprocessing. Replication was examined within each cohort individually and then in a meta-analysis of all three replication cohorts (usingp-value-weighted methods and ensuring directional consis-tency as described above). The threshold for statistically significant replication was determined by Bonferroni correction to be 0.05 divided by the number of CpGs taken forward from discovery.
Sensitivity Models Adjusting EWAS Findings for Potential Confounding
by Genetic Variation
In order to demonstrate whether the DNA methylation and BMI association results were inde-pendent of genetic variants influencing methylation (methylation quantitative trait loci [meQTLs]), we conducted sensitivity models in the FHS for the replicated BMI-related CpGs conditional on the top cis-meQTL (selected by lowestp-value;±500 kb from the CpG) for each replicated CpG. The approach to identify cis-meQTLs for the BMI-related CpGs is described inS1 Methods.
Interindividual Variation in BMI and Distribution of Obesity in Relation to
EWAS Findings
methylation changes are causally influencing BMI, which are secondary to BMI differences, and which have relevance for clinical disease outcomes.
Gene Expression Analyses
We analyzed whole blood gene expression data in the FHS to identify which BMI-related dif-ferentially methylated CpGs demonstrated association with altered gene expression. The repli-cated CpGs were tested using linear mixed effects models for association, with the expression level of the corresponding gene in whole blood (based on annotation by the manufacturer) as the dependent variable and DNA methylation as the independent variable, adjusted for age, sex, and technical and batch effects (further details inS1 Methods).
Functional and Regulatory Annotation
We studied the Gene Ontology (GO) biological process, molecular function, and cellular com-ponent pathways (release 2016-08-22) of the genes identified in the BMI EWAS using the PANTHER (protein annotation through evolutionary relationship) overrepresentation test [23]. Secondarily, we restricted analysis to the higher certainty genes shown to have altered whole blood gene expression in association with BMI-related differential methylation, as described in the previous section. If multiple probes were annotated to the same gene, then the gene was included only once (unweighted). As the methylation array covers 99% of RefSeq genes, the background universe of genes tested was not restricted. Results were corrected for multiple testing within each category.
In addition, we used eFORGE v1.2 (http://eforge.cs.ucl.ac.uk/) [24] to identify if the repli-cated CpGs were enriched in DNase I hypersensitive sites (DHSs) (markers of active regulatory regions) and loci with overlapping histone modifications (H3Kme1, H3Kme4, H3K9me3, H3K27me3, and H3K36me3) across available cell lines and tissues from Roadmap Epige-nomics Project, BLUEPRINT Epigenome, and ENCODE (Encyclopedia of DNA Elements) consortia data [25–27].
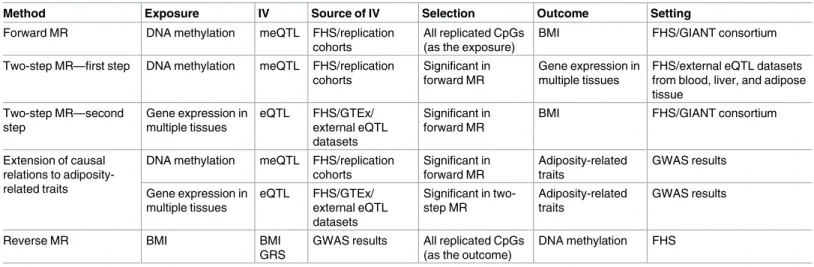
Bidirectional and Two-Step Trans-tissue Mendelian Randomization
IV analyses using SNPs as IVs for (1) DNA methylation, (2) gene expression, and (3) BMI were conducted in order to infer potential causal relationships between EWAS findings, BMI, and adiposity-related diseases (the series of analyses conducted is outlined inTable 1). The detailed approach is provided inS1 Methods. In brief, differences in methylation and expres-sion were modeled using quantitative trait loci (QTLs), thus leveraging the contribution of genetic variation to epigenetic traits to infer causal relations. Blood QTL IVs were selected as the single top SNP methylation or expression association (by lowestp-value) in the FHS with replication in the external cohorts or public datasets. As QTLs vary in effect in different tissue types, we selected tissue-specific methylation and expression QTLs to examine tissue-specific effects (details inS1 Methods). To model the effect of BMI on methylation (reverse causation), the IV for BMI was assembled as an additive weighted genetic risk score from the 97 genome-wide significant SNPs from the Genetic Investigation of ANthropometric Traits (GIANT) con-sortium 2015 genome-wide association study (GWAS) results [7]. A sensitivity analysis utiliz-ing a sutiliz-ingle SNP in theFTO(fat mass and obesity associated) locus as the IV for BMI was conducted to examine an IV less prone to pleiotropy bias but also less powerful to detect potential causal relations.
p-value<0.05) were tested in the trans-tissue two-step MR. The trans-tissue two-step MR was implemented to further break down the relationship between DNA methylation and BMI and to infer whether the hypothesized mediator (gene expression in multiple tissues) is influenced by the exposure (DNA methylation) and, second, whether the mediator (gene expression in multiple tissues) affects the outcome (BMI). SNP IVs that implicated a causal effect of differen-tial methylation and expression on BMI were tested for associations with adiposity-related phenotypes from published GWAS results. Finally, the reverse MR was conducted to test the causal relation of BMI with downstream changes in DNA methylation.
Results
Discovery Cohort Characteristics
The discovery sample included 3,743 individuals: 2,377 from the FHS and 1,366 from the LBCs (n =446 from LBC1921 andn =920 from LBC1936). The FHS, LBC1921, and LBC1936 cohorts were older adults (mean [SD] age 67 [9], 79 [1], and 70 [1] y, respectively) and had similar sex distribution (50%–60% female) and proportion of current smokers (8%–11%) (Table 2).
Epigenome-Wide Association Study of BMI
Discovery. In the FHS-LBC EWAS meta-analysis, 135 CpGs were significantly associated with BMI after correction for multiple testing in the primary age- and sex-adjusted model (p<1.2×10⁻⁷; full list and regression coefficients are provided inS1 Table; Q-Q plots inS1
andS2Figs; Manhattan plot inS3 Fig; genomic inflation factor of discovery meta-analysis,
λ= 1.14). Similar results were observed following additional adjustment for smoking status and after excluding 313 individuals with BMI outside of 18–35 kg/m2(Models 2–3 inS2 Table;
S4 Fig).
External replication. The 135 statistically significant CpGs from the discovery BMI EWAS meta-analysis (primary model) were tested for external replication in the ARIC (n =2,096),
Table 1. Schema of instrumental variable analyses conducted in order to infer the potential causal relations between DNA methylation, gene expression, BMI, and adiposity-related disease.
Method Exposure IV Source of IV Selection Outcome Setting
Forward MR DNA methylation meQTL FHS/replication cohorts
All replicated CpGs (as the exposure)
BMI FHS/GIANT consortium
Two-step MR—first step DNA methylation meQTL FHS/replication cohorts
Significant in forward MR
Gene expression in multiple tissues
FHS/external eQTL datasets from blood, liver, and adipose tissue
Two-step MR—second step
Gene expression in multiple tissues eQTL FHS/GTEx/ external eQTL datasets Significant in forward MR
BMI FHS/GIANT consortium
Extension of causal relations to adiposity-related traits
DNA methylation meQTL FHS/replication cohorts Significant in forward MR Adiposity-related traits GWAS results
Gene expression in multiple tissues
eQTL FHS/GTEx/ external eQTL datasets
Significant in two-step MR
Adiposity-related traits
GWAS results
Reverse MR BMI BMI
GRS
GWAS results All replicated CpGs (as the outcome)
DNA methylation FHS
BMI, body mass index; eQTL, expression quantitative trait locus; FHS, Framingham Heart Study; GIANT, Genetic Investigation of ANthropometric Traits; GRS, genetic risk score; GTEx, Genotype-Tissue Expression Project; GWAS, genome-wide association study; IV, instrumental variable; meQTL, methylation quantitative trait locus; MR, Mendelian randomization.
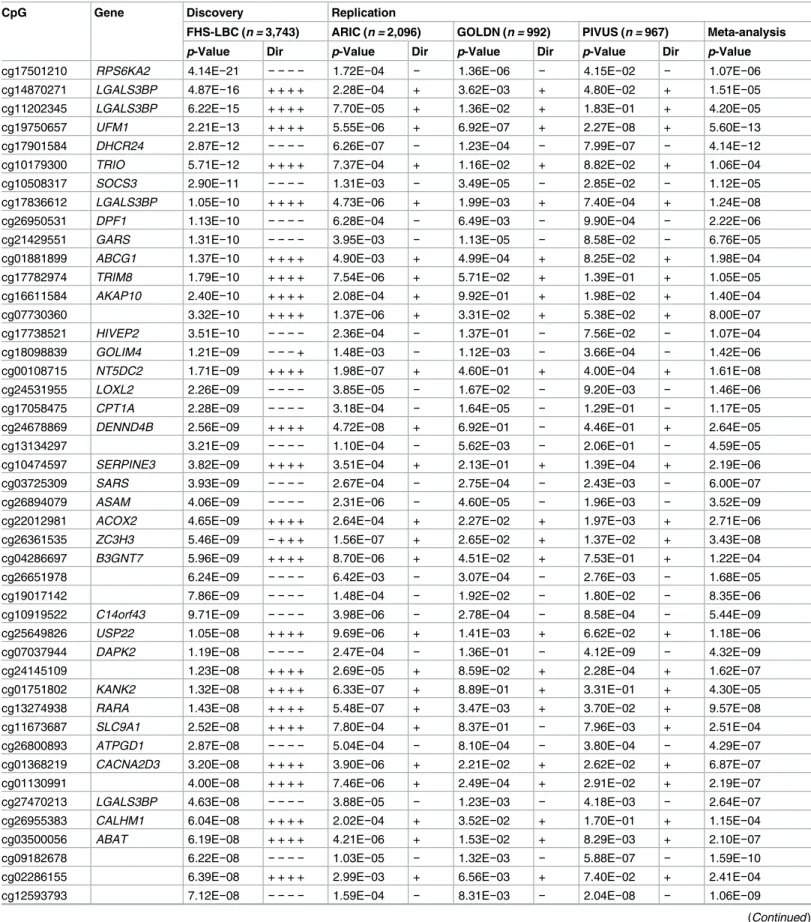
GOLDN (n =992), and PIVUS (n =967) cohorts. There was external replication of 83 of 135 CpGs in at least one cohort (73 in ARIC, 22 in GOLDN, and 19 in PIVUS;S5 Fig) at p-value<3.7×10⁻⁴(Bonferroni-correctedp-value for 135 tests), and 83 of 135 CpGs replicated in the meta-analyses of the three replication cohorts and were taken forward for subsequent analyses (S3 Table). Greater methylation was associated with higher BMI at 49 (59%) of the 83 replicated CpGs. The majority of BMI-related CpGs (65%–85% of CpGs depending on the cohort) had mean sample CpG methylation levels between 20% and 80% (S4 Table). Fifty of the 83 replicated differentially methylated CpGs have not been previously reported in microarray-based EWASs of BMI [28–36] (Table 3).
Age and sex interactions among the BMI EWAS findings. Among the 135 discovery CpGs, a significant sex interaction was demonstrated in the discovery cohorts for one unanno-tated CpG (cg26651978 on Chromosome 17q25.3;<3 kbp from the 30end ofLGALS3BP[ lec-tin galactoside-binding soluble 3-binding protein]), and a significant age interaction for one CpG (cg24678869;DENND4B[DENN domain 4B Rab GDP-GTP exchange factor]) at p-value<3.7×10⁻⁴(Bonferroni-correctedp-value for 135 tests) (S4 Table). The sex interaction identified at cg26651978 (LGALS3BP) modestly replicated in the external cohorts (replication meta-analysesp =0.02), with larger regression coefficients and lowerp-values in stratified models among men than among women (replication meta-analysesp =1.73×10⁻⁶and 0.002 in men and women, respectively; overall and sex-stratified regression coefficients for each cohort inS5 Table). The age interaction at cg24678869 (DENND4B) did not replicate in the external cohorts (replication meta-analysesp =0.9). Due to the narrow age range in PIVUS, however, this interaction was tested only in ARIC and GOLDN (n =3,079).
HIF3A locus methylation. Examining a previously identified BMI-related differential methylation at theHIF3Alocus [28], we demonstrated modest associations with BMI in the FHS-LBC discovery cohorts for the three reported CpGs (p =0.02 for cg22891070,p =0.03 for cg16672562, andp =0.04 for cg27146050; no significant sex interactions). Stratifying models at the median age of 66 y in the FHS (age range too narrow in LBC for stratification) revealed stronger associations in the younger subset and null associations in the older subset (for cg22891070, cg16672562, and cg27146050,p =0.003,p =0.008, andp =0.046, respectively, among participants66 y of age, andp =0.9,p =0.6, andp =0.4, respectively, among partici-pants>66 y of age).
Sensitivity models conditioning on cis methylation quantitative trait loci. Sensitivity models conditioning on the top cis-meQTL (selected by lowestp-value;±500 kb from the CpG) in the FHS demonstrated minimal attenuation of the test statistic for the association of BMI, with differential methylation at the majority of CpGs (81/83 [98%]) attenuated by less than 20% (S6 Table).
Table 2. Study characteristics of the Framingham Heart Study and Lothian Birth Cohort participants (discovery cohorts) at the time of DNA meth-ylation assays.
Characteristic FHS LBC1936 LBC1921
N 2,377 920 446
Age (years) 67±9 70±1 79±1
Female 55% 40% 61%
BMI (kg/m2) 28.3±5.4 27.8±4.4 26.2±4.0
Current smoking 8% 11% 7%
Data are counts, means±standard deviation, and proportions as appropriate. BMI, body mass index; FHS, Framingham Heart Study; LBC, Lothian Birth Cohort.
Table 3. Fifty novel replicated differentially methylated CpGs associated with BMI sorted by p-value in the discovery cohorts.
CpG Gene Discovery Replication
FHS-LBC (n = 3,743) ARIC (n = 2,096) GOLDN (n = 992) PIVUS (n = 967) Meta-analysis p-Value Dir p-Value Dir p-Value Dir p-Value Dir p-Value
cg17501210 RPS6KA2 4.14E−21 − − − − 1.72E−04 − 1.36E−06 − 4.15E−02 − 1.07E−06
cg14870271 LGALS3BP 4.87E−16 + + + + 2.28E−04 + 3.62E−03 + 4.80E−02 + 1.51E−05
cg11202345 LGALS3BP 6.22E−15 + + + + 7.70E−05 + 1.36E−02 + 1.83E−01 + 4.20E−05
cg19750657 UFM1 2.21E−13 + + + + 5.55E−06 + 6.92E−07 + 2.27E−08 + 5.60E−13
cg17901584 DHCR24 2.87E−12 − − − − 6.26E−07 − 1.23E−04 − 7.99E−07 − 4.14E−12
cg10179300 TRIO 5.71E−12 + + + + 7.37E−04 + 1.16E−02 + 8.82E−02 + 1.06E−04
cg10508317 SOCS3 2.90E−11 − − − − 1.31E−03 − 3.49E−05 − 2.85E−02 − 1.12E−05
cg17836612 LGALS3BP 1.05E−10 + + + + 4.73E−06 + 1.99E−03 + 7.40E−04 + 1.24E−08
cg26950531 DPF1 1.13E−10 − − − − 6.28E−04 − 6.49E−03 − 9.90E−04 − 2.22E−06
cg21429551 GARS 1.31E−10 − − − − 3.95E−03 − 1.13E−05 − 8.58E−02 − 6.76E−05
cg01881899 ABCG1 1.37E−10 + + + + 4.90E−03 + 4.99E−04 + 8.25E−02 + 1.98E−04
cg17782974 TRIM8 1.79E−10 + + + + 7.54E−06 + 5.71E−02 + 1.39E−01 + 1.05E−05
cg16611584 AKAP10 2.40E−10 + + + + 2.08E−04 + 9.92E−01 + 1.98E−02 + 1.40E−04
cg07730360 3.32E−10 + + + + 1.37E−06 + 3.31E−02 + 5.38E−02 + 8.00E−07
cg17738521 HIVEP2 3.51E−10 − − − − 2.36E−04 − 1.37E−01 − 7.56E−02 − 1.07E−04
cg18098839 GOLIM4 1.21E−09 − − −+ 1.48E−03 − 1.12E−03 − 3.66E−04 − 1.42E−06
cg00108715 NT5DC2 1.71E−09 + + + + 1.98E−07 + 4.60E−01 + 4.00E−04 + 1.61E−08
cg24531955 LOXL2 2.26E−09 − − − − 3.85E−05 − 1.67E−02 − 9.20E−03 − 1.46E−06
cg17058475 CPT1A 2.28E−09 − − − − 3.18E−04 − 1.64E−05 − 1.29E−01 − 1.17E−05
cg24678869 DENND4B 2.56E−09 + + + + 4.72E−08 + 6.92E−01 − 4.46E−01 + 2.64E−05
cg13134297 3.21E−09 − − − − 1.10E−04 − 5.62E−03 − 2.06E−01 − 4.59E−05
cg10474597 SERPINE3 3.82E−09 + + + + 3.51E−04 + 2.13E−01 + 1.39E−04 + 2.19E−06
cg03725309 SARS 3.93E−09 − − − − 2.67E−04 − 2.75E−04 − 2.43E−03 − 6.00E−07
cg26894079 ASAM 4.06E−09 − − − − 2.31E−06 − 4.60E−05 − 1.96E−03 − 3.52E−09
cg22012981 ACOX2 4.65E−09 + + + + 2.64E−04 + 2.27E−02 + 1.97E−03 + 2.71E−06
cg26361535 ZC3H3 5.46E−09 −+ + + 1.56E−07 + 2.65E−02 + 1.37E−02 + 3.43E−08
cg04286697 B3GNT7 5.96E−09 + + + + 8.70E−06 + 4.51E−02 + 7.53E−01 + 1.22E−04
cg26651978 6.24E−09 − − − − 6.42E−03 − 3.07E−04 − 2.76E−03 − 1.68E−05
cg19017142 7.86E−09 − − − − 1.48E−04 − 1.92E−02 − 1.80E−02 − 8.35E−06
cg10919522 C14orf43 9.71E−09 − − − − 3.98E−06 − 2.78E−04 − 8.58E−04 − 5.44E−09
cg25649826 USP22 1.05E−08 + + + + 9.69E−06 + 1.41E−03 + 6.62E−02 + 1.18E−06
cg07037944 DAPK2 1.19E−08 − − − − 2.47E−04 − 1.36E−01 − 4.12E−09 − 4.32E−09
cg24145109 1.23E−08 + + + + 2.69E−05 + 8.59E−02 + 2.28E−04 + 1.62E−07
cg01751802 KANK2 1.32E−08 + + + + 6.33E−07 + 8.89E−01 + 3.31E−01 + 4.30E−05
cg13274938 RARA 1.43E−08 + + + + 5.48E−07 + 3.47E−03 + 3.70E−02 + 9.57E−08
cg11673687 SLC9A1 2.52E−08 + + + + 7.80E−04 + 8.37E−01 − 7.96E−03 + 2.51E−04
cg26800893 ATPGD1 2.87E−08 − − − − 5.04E−04 − 8.10E−04 − 3.80E−04 − 4.29E−07
cg01368219 CACNA2D3 3.20E−08 + + + + 3.90E−06 + 2.21E−02 + 2.62E−02 + 6.87E−07
cg01130991 4.00E−08 + + + + 7.46E−06 + 2.49E−04 + 2.91E−02 + 2.19E−07
cg27470213 LGALS3BP 4.63E−08 − − − − 3.88E−05 − 1.23E−03 − 4.18E−03 − 2.64E−07
cg26955383 CALHM1 6.04E−08 + + + + 2.02E−04 + 3.52E−02 + 1.70E−01 + 1.15E−04
cg03500056 ABAT 6.19E−08 + + + + 4.21E−06 + 1.53E−02 + 8.29E−03 + 2.10E−07
cg09182678 6.22E−08 − − − − 1.03E−05 − 1.32E−03 − 5.88E−07 − 1.59E−10
cg02286155 6.39E−08 + + + + 2.99E−03 + 6.56E−03 + 7.40E−02 + 2.41E−04
cg12593793 7.12E−08 − − − − 1.59E−04 − 8.31E−03 − 2.04E−08 − 1.06E−09
Interindividual Variation in BMI and Distribution of Obesity
The interindividual variation in BMI and distribution of obesity captured in the BMI EWAS findings was evaluated. Regressing BMI on the 77 nonredundant (inter-probe correlation |r|<0.7) CpGs from the 83 replicated CpGs identified in the BMI EWAS revealed that 18% of the interindividual variation (adjustedR2) in BMI is captured by differential methylation beyond age and sex in the external replication cohort PIVUS (S6 Fig). This proportion is simi-lar to that observed when examining a completely independent discovery test set using the 75 CpGs that were methylome-wide significant in the FHS discovery cohort (no replication), which accounted for 17.5% of the interindividual variation in BMI (adjustedR2) beyond age and sex in the LBCs. Creating an additive weighted composite measure of the 77 nonredun-dant replicated CpGs and examining the distribution of BMI and obesity (BMI30 kg/m2) across deciles of the measure demonstrated that the median BMI increased in a graded manner from 22 to 34 kg/m2and the prevalence of obesity rose from 0% to 50% (Figs2andS7). For each SD increase in the composite DNA methylation measure in the PIVUS replication cohort, BMI increased by 1.63 (standard error 0.13) kg/m2(p =3.7×10⁻³⁴). The odds ratios for obesity (BMI30 kg/m2) and overweight (BMI 25–29.9 kg/m2) compared to the reference group (BMI<25 kg/m2) were 2.8 (95% CI 2.3–3.5;p =1.6×10⁻²⁵) and 1.9 (95% CI 1.6–2.2; p =2.5×10⁻¹⁸), respectively, for each SD increase in methylation measure in age- and sex-adjusted models.
Three-Way Association of DNA Methylation, Gene Expression, and BMI
We examined the association of DNA methylation at the 83 replicated BMI-related CpGs with gene expression among 2,246 FHS participants, in order to determine which genes in blood may be influenced by differential methylation of the BMI EWAS CpGs. Of the 83 replicated CpGs, annotated gene expression from whole blood was available for 62 CpG–gene expression pairs (three transcript results were unavailable on the microarray, and 18 CpGs were inter-genic). There were significant associations (p-value<8×10⁻⁴; 0.05/62) between differential DNA methylation and gene expression in whole blood for 19 CpG–gene expression pairs, representing ten unique gene transcripts (ABCG1,CPT1A,SREBF1,LGALS3BP,DHCR24, PHGDH,SARS,NOD2,CACNA2D3, andSLC1A5), with almost all of the CpG–gene expression pairs (18/19; 95%) demonstrating an inverse association of methylation with expression
Table 3. (Continued)
CpG Gene Discovery Replication
FHS-LBC (n = 3,743) ARIC (n = 2,096) GOLDN (n = 992) PIVUS (n = 967) Meta-analysis p-Value Dir p-Value Dir p-Value Dir p-Value Dir p-Value
cg23172671 7.47E−08 + + + + 1.22E−04 + 7.70E−02 + 1.25E−01 + 8.01E−05
cg13139542 7.93E−08 −+ + + 1.23E−05 + 1.05E−02 + 3.78E−01 + 2.67E−05
cg02571142 DKK4 9.91E−08 + + + + 6.33E−04 + 4.34E−03 + 6.97E−02 + 5.34E−05
cg21766592 SLC1A5 1.07E−07 − − − − 7.69E−03 − 5.41E−01 − 3.33E−04 − 1.34E−04
cg01526748 FGF12 1.18E−07 + + + + 5.32E−04 + 4.17E−04 + 3.32E−02 + 1.11E−05
The full list of the 83 replicated BMI-related differentially methylated CpGs is presented inS3 Table. The four directions of association with BMI for the FHS-LBC cohorts indicate, in order, the two lab batches in the FHS and the LBC1936 and LBC1921 cohorts individually.
ARIC, Atherosclerosis Risk in Communities; BMI, body mass index; Dir, direction of association with body mass index; FHS, Framingham Heart Study; GOLDN, Genetics of Lipid Lowering Drugs and Diet Network; LBC, Lothian Birth Cohort; PIVUS, Prospective Investigation of the Vasculature in Uppsala Seniors.
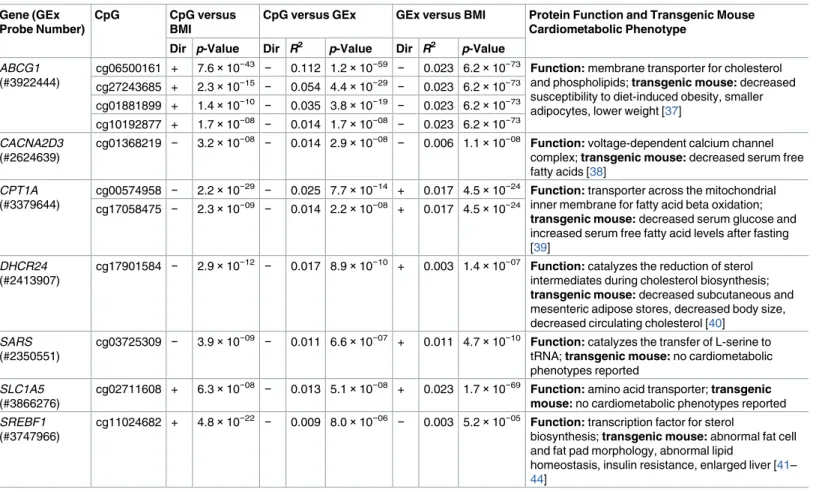
(S7 Table). There were significant three-way associations (CpG versus BMI; CpG versus gene expression; gene expression versus BMI) for 11 CpGs with seven unique annotated genes (Table 4). Five of the seven genes (71%) with significant three-way associations between CpG– gene expression–BMI are known to exhibit cardiometabolic phenotypes in murine gene knockout models [37–44].
Functional and Regulatory Annotation of the BMI EWAS Findings
Gene Ontology pathway analyses. GO analyses of biological process, molecular function, and cellular component pathways of the 55 unique genes annotated to the 83 replicated CpGs (ten CpGs were annotated to genes annotated to other replicated CpGs, and 18 CpGs were intergenic) did not identify any statistically significant pathways after adjustment for multiple testing. Secondarily, in order to further refine gene selection for GO analyses to the genes that demonstrated altered expression, we restricted the GO analyses to the ten unique genes for which variation in expression was associated with differential methylation, as described in the previous section. We identified significant overrepresentation of a biological process pathway
Fig 2. Histogram of the proportion of obese individuals (BMI30 kg/m2) in the PIVUS cohort across deciles of the additive weighted composite methylation measure of the 77 nonredundant replicated CpGs (|r|<0.7) from the BMI epigenome-wide association study. BMI, body mass index; PIVUS, Prospective Investigation of the Vasculature in Uppsala Seniors.
in the positive regulation of lipid metabolic processes (GO:0045834; adjustedp-value = 0.002; 64-fold enrichment; four overlapping genes [ABCG1,SREBF1,CPT1AandNOD2] of 130 total genes in pathway) and two related processes (positive regulation of the cholesterol biosynthetic [GO:0045542] and cholesterol metabolic [GO:0090205] processes; adjustedp-value = 0.02– 0.03).
Regulatory annotation of CpGs associated with gene expression in blood. Most BMI-related CpGs associated with altered gene expression were located within 50 kb of the transcrip-tion start site and were within known enhancer or DHSs (S8andS9Figs). CpGs associated with BMI were more likely to be in enhancers and DHSs (enrichmentp-value = 4.5×10⁻⁷and 9.4×10⁻⁴, respectively) and less likely to reside in CpG islands (depletionp-value = 3.2×10⁻¹¹) compared to the full set of measured CpGs on the microarray (S8 Table).
DNase I hypersensitive site testing of all identified CpGs. Tissue- and cell-type-specific DHS enrichment testing using the eFORGE v1.2 tool demonstrated that the BMI-related CpGs are enriched in DHSs across almost every tissue and cell type assayed in the included ENCODE, BLUEPRINT Epigenome, and Roadmap Epigenomics Project datasets (S10and
S11Figs), thus supporting the notion that the CpGs identified in blood are also situated in known active regulatory regions in not only blood, but also other metabolically active tissues.
Table 4. Association results from 11 replicated CpGs with significant three-way associations in whole blood between CpG methylation and BMI, CpG methylation and gene expression, and gene expression and BMI.
Gene (GEx Probe Number)
CpG CpG versus BMI
CpG versus GEx GEx versus BMI Protein Function and Transgenic Mouse Cardiometabolic Phenotype
Dir p-Value Dir R2 p-Value Dir R2 p-Value
ABCG1
(#3922444)
cg06500161 + 7.6×10−43 − 0.112 1.2×10−59 − 0.023 6.2×10−73 Function: membrane transporter for cholesterol
and phospholipids; transgenic mouse: decreased susceptibility to diet-induced obesity, smaller adipocytes, lower weight [37]
cg27243685 + 2.3×10⁻¹⁵ − 0.054 4.4×10⁻²⁹ − 0.023 6.2×10−73 cg01881899 + 1.4×10⁻¹⁰ − 0.035 3.8×10⁻¹⁹ − 0.023 6.2×10−73 cg10192877 + 1.7×10−08 − 0.014 1.7×10−08 − 0.023 6.2×10−73
CACNA2D3
(#2624639)
cg01368219 − 3.2×10−08 − 0.014 2.9×10−08 − 0.006 1.1×10−08 Function: voltage-dependent calcium channel
complex; transgenic mouse: decreased serum free fatty acids [38]
CPT1A
(#3379644)
cg00574958 − 2.2×10⁻²⁹ − 0.025 7.7×10⁻¹⁴ + 0.017 4.5×10⁻²⁴ Function: transporter across the mitochondrial
inner membrane for fatty acid beta oxidation; transgenic mouse: decreased serum glucose and increased serum free fatty acid levels after fasting [39]
cg17058475 − 2.3×10−09 − 0.014 2.2×10−08 + 0.017 4.5×10⁻²⁴
DHCR24
(#2413907)
cg17901584 − 2.9×10⁻¹² − 0.017 8.9×10⁻¹⁰ + 0.003 1.4×10−07 Function: catalyzes the reduction of sterol
intermediates during cholesterol biosynthesis; transgenic mouse: decreased subcutaneous and mesenteric adipose stores, decreased body size, decreased circulating cholesterol [40]
SARS
(#2350551)
cg03725309 − 3.9×10−09 − 0.011 6.6×10−07 + 0.011 4.7×10⁻¹⁰ Function: catalyzes the transfer of L-serine to tRNA; transgenic mouse: no cardiometabolic phenotypes reported
SLC1A5
(#3866276)
cg02711608 + 6.3×10−08 − 0.013 5.1×10−08 + 0.023 1.7×10−69 Function: amino acid transporter; transgenic mouse: no cardiometabolic phenotypes reported
SREBF1
(#3747966)
cg11024682 + 4.8×10⁻²² − 0.009 8.0×10−06 − 0.003 5.2×10−05 Function: transcription factor for sterol
biosynthesis; transgenic mouse: abnormal fat cell and fat pad morphology, abnormal lipid
homeostasis, insulin resistance, enlarged liver [41–
44] Complete list of results for all methylome-wide significant CpGs is available inS8 Table.
BMI, body mass index; Dir, direction of correlation; GEx, gene expression.
Further stratification by whether BMI-related CpGs had overlapping H3 histone methylation revealed that the BMI-related CpGs predominately overlapped regions with mono-methyla-tion and, to a lesser extent, tri-methylamono-methyla-tion of lysine 4 on histone H3K4 (H3K4me1 and H3K4me3) across numerous tissues from the consolidated Roadmap Epigenomics Project data (S12–S14Figs). H3K4me1 marks are indicative of enhancers, H3K4me3 marks are indica-tive of promoters, and both are known markers of transcriptional activation.
Genetic Instrumental Variable Analyses (Mendelian Randomization)
Successive genetic IV analyses were conducted to infer causal relations between differential methylation, gene expression, and BMI, followed by evaluation of the modeled epigenetic changes on adiposity-related traits using GWAS results (Table 1).
Forward Mendelian randomization. Testing the causal association of DNA methylation with BMI revealed that differential methylation at two CpGs had nominally significant causal associations (p-value<0.05) with BMI: (1) cg11024682 (SREBF1; cis-meQTL SNP IV rs752579) and (2) cg07730360 (a non-annotated CpG on Chromosome 3q21.3; trans-meQTL SNP IV rs13437553), with causalp-value = 0.02 and 0.04, respectively (S15 Fig;S9 Table). Tak-ing forward the two causal CpGs in discovery for external validation, we found that modeled differential methylation at one of the two CpGs (cis-meQTL SNP IV rs752579 for differential methylation at cg11024682 [SREBF1]) was associated with BMI in the 2015 GIANT consor-tium results (p =0.0003; all ancestries).
Two-step Mendelian randomization (first step). In the first step (DNA methylation affecting the mediator, gene expression), the SNP IV (rs752579) utilized in the forward MR analyses to model differential methylation of theSREBF1locus (cg11024682) was also found to be strongly associated with alteredSREBF1gene expression in blood in the FHS (p =3×10⁻¹²; decreased expression in relation to the C allele), a published [45] blood expression quantitative trait locus (eQTL) dataset (p =3.2×10⁻⁶; direction of effect in blood consistent with that seen in the FHS), and liver (p =1×10⁻¹⁵; in the same direction as observed in blood in a reanalysis of 958 samples [46,47]).
Two-step Mendelian randomization (second step). In the second step (gene expression in blood and alternate tissues affecting BMI), we identified adequate eQTLs forSREBF1 expression in whole blood (rs1889018;p =1.7×10⁻¹⁵) from the FHS; in adrenal gland (rs4925138;p =1.1×10⁻⁶) and liver (rs11078366;p =1.8×10⁻⁶) from the Genotype-Tissue Expression (GTEx) Project; and in adipose tissue (rs4985779;p =8.4×10⁻⁴) from the larger MuTHER dataset [48]. The multi-tissueSREBF1eQTLs were selected to be largely indepen-dent from theSREBF1methylation locus SNP IV (details inS1 Methods). We identified signif-icant associations with BMI (adjusted for the four tests,p<0.013) in the GIANT consortium results for two of the four tissue types; specifically, BMI was associated with the SNP IV for SREBF1expression in whole blood (rs1889018,p =0.002) and adrenal gland (rs4925138,p = 0.0098), but not liver (rs11078366,p =0.89) or adipose tissue (rs4985779,p =0.80).
triglycerides (p =0.02) based on GWAS results [49,50,56]. The SNP IV for increasedSREBF1 expression in the adrenal gland (rs4925138) was also nominally associated with adiponectin (p =0.02), triglycerides (p =0.022), and low-density lipoprotein change in response to statin treatment (p =0.04) [50,56,58].
Causal effect estimates. Each SD increase in DNA methylation at theSREBF1locus (cg11024682) was predicted to result in a 2.8-kg/m2decrease in BMI in the FHS (modeling the effect of allele C for rs752579). In contrast, the observed relationship between methylation in blood and BMI in the FHS was in the opposite direction: a 1.0-kg/m2increase in BMI per SD increase in DNA methylation at cg11024682. The predicted direction of effect between methyl-ation and BMI is partly derived from the observed direction of effect between the SNP IV and methylation in blood. Previous literature has reported cell-type-dependent QTLs with opposite directions of effect between a SNP and methylation or expression depending on the cell or tis-sue type examined [59]. As extensive databases of trans-tissue methylation are unavailable, we examined trans-tissue eQTLs forSREBF1from the GTEx Portal [60]. A series of eQTLs for SREBF1(false discovery rate0.05) demonstrate opposite direction of effect between blood versus adrenal gland (p-value<10−6) and additional tissues (atp-value<10−5) such as skeletal muscle, esophagus, aorta tissue, and tibial nerve (http://www.gtexportal.org/home/ bubbleHeatmapPage/SREBF1). Strong eQTLs forSREBF1are likely present in adrenal tissue asSREBF1is highly expressed in the adrenal gland compared to other tissues (http://www. proteinatlas.org/ENSG00000072310-SREBF1/tissue). For example, rs854764 is a strong eQTL forSREBF1in both blood and adrenal tissue but in opposite directions (p =3.8×10⁻¹²and p =4×10⁻⁶, respectively, in the GTEx catalog) and is associated with BMI in GIANT (p = 0.001) and waist-hip ratio (p =9.2×10⁻⁴), adiponectin (p =0.02), HbA1C (p =0.02), type 2 diabetes (p =0.03), triglycerides (p =0.04), and coronary artery disease (p =1.1×10⁻⁵) in GWAS results [4,7,50,52,54,57,61]. This SNP, rs854764, is also a meQTL forSREBF1locus methylation at cg11024682 in the FHS (p =2.8×10⁻¹⁸), but the association withSREBF1locus methylation in adrenal gland, the potential tissue of effect, is unknown. SeeS10 Tablefor causal effect estimates and confidence intervals for the second step of the two-step MR analyses.
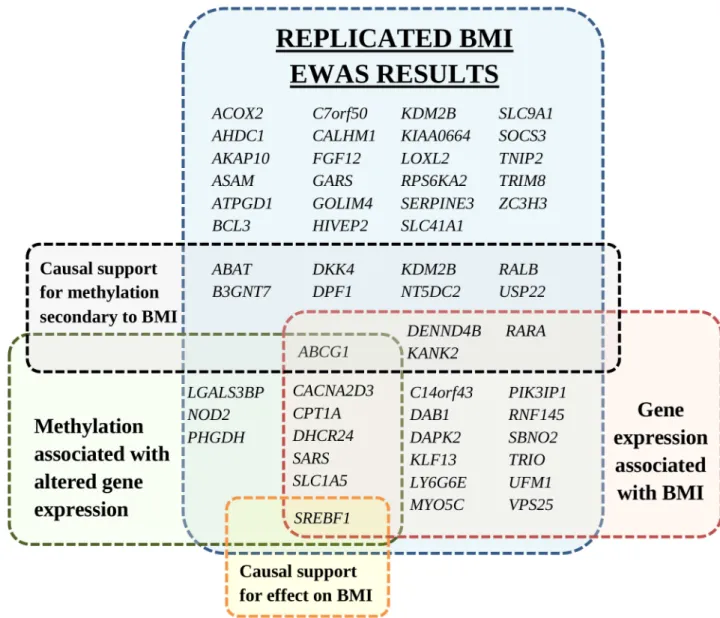
Reverse Mendelian randomization. To test whether BMI affects methylation at the iden-tified CpGs, the additive weighted genetic risk score of 97 known BMI SNPs [7] was used as an IV for BMI (F-test statistic = 26). Sixteen CpGs were found to be differentially methylated as a consequence of BMI using a nominal causalp-value<0.05 cutoff (full list inS11 Table). The 16 downstream CpGs were annotated to 12 genes (ABCG1,USP22,DPF1,RARA,KDM2B, KANK2,RALB,NT5DC2,DENND4B,B3GNT7,DKK4, andABAT). A sensitivity analysis using a single SNP in theFTOlocus as a BMI IV (S12 Table) further supported causal associations downstream of BMI at two of the 16 CpGs (nominal causalp-value<0.05 for cg06500161 and cg04286697, at theABCG1andB3GNT7loci, respectively). The annotated genes with BMI-related differential methylation are characterized inFig 3.
Discussion
ofSREBF1was found to be associated with BMI and other adiposity traits, glycemic traits, dys-lipidemia, and coronary artery disease. In contrast, we found that a substantial proportion (16 out of 83 [19%]) of the BMI-related differentially methylated CpGs identified in this EWAS are likely a consequence of BMI (i.e., downstream signals).
BMI Variation Is Reflected in DNA Methylation Signatures in Blood
A substantial proportion (~18%) of interindividual variation in BMI is captured by the repli-cated differentially methylated CpGs in blood. The magnitude of BMI difference (~12 kg/m2 between the highest and lowest deciles) equates to substantial health risks; for example, each 5-kg/m2increase in BMI in the general population is associated with a 30% increase in mortal-ity [62].
Fig 3. Annotated genes of replicated differentially methylated CpGs identified in the BMI epigenome-wide association study. Genes are grouped by association with gene expression, association of gene expression with BMI, and Mendelian randomization analyses for causal support. Duplicate gene names within the same group are not shown. Figure does not include 18 intergenic CpGs without a gene annotation. BMI, body mass index; EWAS, epigenome-wide association study.
Our results suggest that epigenetic biomarkers hold the potential to improve risk prediction and help tailor therapy choices to prevent or treat cardiometabolic diseases. For example, at the population level, BMI is an effective measure of average future cardiometabolic disease risk [63], but it is insufficiently predictive at the individual level. Regardless of causality, blood-based biomarkers can be useful for prognostic or diagnostic purposes. Further research is required to determine whether refining BMI-related risk by incorporating epigenetic biomark-ers can improve risk prediction and help guide treatment decisions.
Differential Methylation Is Identified in Loci Known to Be Involved in
Adiposity
Lipid metabolism. Previously conducted experiments support a causal role ofSREBF1in adiposity [64].SREBF1(also known asSREBP1) plays a central role in energy homeostasis by promoting glycolysis, lipogenesis, and adipogenesis via induction of the conversion of acetyl-CoA to triglycerides (S16 Fig).SREBF1promotes the conversion of free fatty acids to triglycer-ides in the liver and to triglyceride-rich lipoproteins in the bloodstream. In situations of caloric excess,SREBF1is a key mediator of the induction of lipogenesis in humans [64]. In mice with diet-induced insulin resistance, inhibition ofSREBF1attenuates accelerated atherosclerosis, supporting a link to atherosclerosis and coronary artery disease [65]. The causal connection between increased triglyceride-rich lipoproteins and coronary disease is supported by human genetic studies [66]. We highlight the potential role ofSREBF1expression in the adrenal gland in weight regulation and adiposity-related diseases based on results from the MR analyses. Dis-eases of the adrenal gland are known to be linked to severe obesity, and adrenalectomy in murine models can reverse genetically induced obesity [67,68]. Our results suggest that altered genomic regulation ofSREBF1is causally related to BMI; however, the lack of large datasets of meQTLs in numerous tissues and under various conditions, in combination with the inability to conduct tissue-targeted epigenetic editing in relevant experimental models, limits our ability to make a definitive causal inference. Regulation ofSREBF1is an underexplored target for the prevention of coronary artery disease.
demonstrate that these connections are evident in humans, adding to previous evidence from animal models [78].
Inflammatory pathways. Aside from the lipid metabolism genes, a number of loci involved in inflammatory pathways were identified by our EWAS. Enlarged adipocytes in obese individuals are known to promote inflammation. One BMI-related differentially meth-ylated CpG was identified at theNOD2(nucleotide binding oligomerization domain 2) locus. NOD2, an innate immune receptor, is involved in the immune response to bacterial lipopoly-saccharides (LPSs) by activating NF-κB signaling. Uptake of LPS from gut microbiota has been demonstrated to result in increased internalization of LPS-rich lipoproteins into adipo-cytes and promote macrophage conversion from the M2 form to the inflammatory M1 form [79].NOD2is also included in the GO pathway for regulation of lipid metabolism (0045834) as it is a positive regulator of phosphatidylinositol 3-kinase activity and has been demon-strated to promote vascular inflammation and formation of lipid-rich atherosclerotic lesions in hypercholesterolemicLDLR−/−
mice [80,81].NOD2interacts with another BMI-related differentially methylated inflammatory gene locus atSOCS3(suppressor of cytokine signaling 3), a negative regulator of cytokine signaling. In addition,LGALS3BP(lectin,galactoside binding soluble 3 binding protein), also known asMAC2BP(Mac-2-binding protein), is involved in the immune response associated with lymphokine-activated killer cell cytotoxic-ity and platelet activation, signaling, and aggregation.LGALS3BPhas been found to stimulate host defenses and is elevated in individuals with various types of cancer such as breast, lung, colorectal, ovary, and endometrial cancers, many of which are obesity-related. In addition, LGALS3BPwas recently identified as a promising biomarker for non-alcoholic steatohepati-tis and pancreatisteatohepati-tis [82,83], known obesity-related diseases. Methylation at theLGALS3BP locus demonstrated a significant sex interaction, with a stronger effect in men. This may be related to environmental factors more common in men (such as specific dietary patterns) or male-specific physiology.
Differential Methylation Is Identified in Loci Not Previously Linked to
Adiposity
Serine metabolism. Two of the ten genes differentially expressed in association with BMI-related methylation (PHGDHandSARS) are involved in L-serine metabolism.PHGDH (phosphoglycerate dehydrogenase) is involved in the early steps of the synthesis of the amino acid L-serine, which plays a role in oxidoreductase as a NADP acceptor in the tricarboxylic acid cycle.SARS(seryl-TRNA synthetase) catalyzes the transfer of L-serine to tRNA. In addi-tion,RPS6KA2(ribosomal protein S6 kinase A2), a locus not previously reported as being BMI-related, is a serine/threonine kinase that acts downstream of MAPK signaling and is involved in cell proliferation. L-serine is necessary for specific functions in the central nervous system; however, the link between adiposity and functional health consequences via effects on serine metabolism is currently unknown.
BMI EWAS Findings in the Context of Published Epigenetic
Epidemiology Studies
Previous in silico methods of identifying putative epigenetically regulated obesity genes highlightedSOCS3(suppressor of cytokine signaling 3) andRARA(retinoic acid receptor alpha) [84], both of which were identified in the FHS-LBC meta-analysis (p =2.7×10⁻¹¹for cg27637521 inSOCS3andp =1.3×10⁻⁸for cg13274938 inRARA). An association study of DNA methylation and BMI in 459 individuals from the Cardiogenics Consortium identified an association of methylation at three CpGs intronic toHIF3A(hypoxia inducible factor 3A) in blood and adipose cells with BMI [28]. We found modest associations of differential methyla-tion and expression at theHIF3Alocus with BMI in our study. However, the associations were stronger in younger individuals in the FHS, suggesting that the connection may be less appar-ent at older ages.
At a nominal causalp-value<0.05, we found that many (16 [19%]) of the replicated CpGs are downstream of BMI. This is consistent with recent findings from longitudinal methylation data and bidirectional MR in the Avon Longitudinal Study of Parents and Children [85] that BMI-relatedHIF3Amethylation is likely secondary to differences in BMI.
There is substantial overlap between the identified BMI-related CpGs and reported CpG– metabolite associations in blood from 1,814 participants in the KORA cohort (Kooperative Gesundheitsforschung in der Region Augsburg) [86] (S13 Table). Notably, ceramides and sphingolipids—known to have altered levels among obese individuals and implicated in the development of the metabolic syndrome [87–89]—were identified. In addition, the BMI-related differentially methylated CpG (cg03725309) at theSARSlocus, as discussed above in the serine metabolism section, was found to be associated with blood levels of serine.
BMI EWAS Findings in the Context of BMI GWAS Results and Nearby
Genetic Variants
Of note, none of the CpGs associated with BMI was near genes previously identified in GWASs of obesity-related traits, such asFTO(fat mass and obesity associated) orMC4R( mela-nocortin 4 receptor). We hypothesize that many of the replicated differentially methylated loci reflect novel pathways involved in the regulation of adiposity or adiposity-related diseases. Long-range interactions of DNA methylation with known obesity-related loci, however, may exist [90]. Further work to understand the role of the novel loci in relation to adiposity is also required. In addition, combining information from DNA methylation with genetic markers identified from DNA sequence variation may allow for improvements in risk prediction previ-ously not possible with sequence variants alone [91].
Study Limitations
Our study has several limitations. Results from MR analyses utilizing genetically predicted methylation and expression levels do not prove causation but provide supportive evidence. The results of the MR analyses are based on numerous assumptions, for example, that there are not alternative pathways through which the SNP IV may act on BMI (i.e., pleiotropic effects). The MR assumptions cannot be tested directly and may bias the results. The forward MR results did not reach Bonferroni-adjusted significance thresholds for multiple testing; however, validation of the nominally significant results in the larger GIANT consortium sup-ports our findings. We avoided the use of multi-SNP score IVs as we had already identified adequate single SNP meQTLs and using multi-SNP score IVs would have further risked intro-ducing bias due to pleiotropy. The meQTLs for the MR analyses were derived in the FHS and the outcome was tested within the same cohort, which can potentially result in bias toward significance. The MR analyses, using the blood meQTL IV, suggest an inverse relationship between the predicted methylation of theSREBF1locus and BMI, the reverse of the observed relationship, which can be interpreted as a null result. This finding is potentially explained by different directions of effect of QTLs in alternate tissues, which was supported by examining the association of genetic variants in blood versus other metabolically active tissues in the GTEx Project resource. Unfortunately, there are limited datasets of meQTLs in various tissues to explore this further. The observation of associations of BMI with methylation at the same CpG in different directions of effect in blood versus adipose-derived DNA has been previously reported at BMI-related CpG sites [30]. ForSREBF1, we presume that the metabolic conse-quences of altered methylation and the effect on BMI occur in tissues other than blood, such as the adrenal gland, with the methylation changes in blood that we were able to detect repre-senting a biomarker of trans-tissue differential methylation [92]. In addition, it is possible that positive and negative feedback loops can result in regulation of the same gene to be both a causal and a downstream effect of adiposity. We would not be able to discern this scenario from the observational cross-sectional data in this study.
An alternate methylation assay would be required for clinical purposes as the current microarrays are unsuitable in a clinical setting. Future research would be required for technical validation for clinical purposes. Our study supports blood cells as a useful accessible tissue for epigenetic biomarker discovery in large population studies. However, our study would not be able to detect tissue-specific methylation changes occurring in non-blood cell lines (e.g., neu-ron-specific epigenetic modifications in relation to BMI). Many of our top CpGs replicated in the GOLDN study, which assessed DNA methylation in a single blood cell type (CD4+), sug-gesting that the associations we detected are not likely to be due to confounding by blood cell heterogeneity. Many of the genes associated with BMI-related differential methylation were known to have a role in adiposity and cardiometabolic traits from murine knockout models; however, the universe of knockout models is likely enriched for the study of adiposity and car-diometabolic traits, and we could not directly test whether our results identified more than expected. Our study was conducted among older-age adults, and the findings may not be gen-eralizable to younger ages.
Conclusions
Our findings provide a foundation for further research to determine if individualized epige-netic profiles can be used to guide clinical decision making and improve health outcomes. Our findings may have additional clinical and therapeutic relevance if other loci that are differen-tially methylated in relation to BMI represent attractive targets for the treatment or prevention of obesity and adiposity-related diseases.
Supporting Information
S1 Fig. Quantile-quantile plot of expected versus observed−log10p-values from the epi-genome-wide association study of BMI in the FHS-LBC meta-analysis. Models: (A) age-and sex-adjusted, (B) additionally smoking-adjusted, age-and (C) additionally excluding frailty/ morbid obesity (BMI<18 kg/m2and>35 kg/m2).
(EPS)
S2 Fig. Quantile-quantile plot of expected versus observed−log10p-values from the epi-genome-wide association study of BMI in FHS alone. Using surrogate variables to adjust for cell count proportion and technical effects (A) compared to the alternate approach of imputed cell counts and measured technical effects (B). Genomic inflation factor lambda is lower in the surrogate variable analysis approach compared to the approach of imputed cell counts and measured technical effects (1.04 versus 1.25), suggesting fewer potential false positives and a more conservative approach.
(EPS)
S3 Fig. Manhattan plot of the epigenome-wide association study of BMI in the FHS-LBC meta-analysis in age- and sex-adjusted models. The dotted line indicates the Bonferroni cut-off for significance ofp-value<1.2×10⁻⁷. The top six CpGs with the lowestp-values are shown, annotated to their closest gene transcript.
(EPS)
S4 Fig. Comparison of−log10p-values of results of the FHS-LBC BMI epigenome-wide association study. (A) Model 1 (age- and sex-adjusted) + Model 2 (additionally smoking-adjusted). (B) Model 1 + Model 3 (excluding BMI<18 and>35 kg/m2).
(EPS)
S5 Fig. Three-dimensional scatterplot of−log10p-values for 135 epigenome-wide signifi-cant CpGs from the FHS-LBC discovery cohorts in three external replication cohorts. Rep-lication significance defined as Bonferroni-adjustedp-value<3.7×10⁻⁴(0.05/135). CpGs significant in one, two, and all three replication cohorts are depicted in green, yellow, and red, respectively. Annotated genes are labeled for CpGs replicated in all three cohorts. Full list of replication results is available inS2 Table.
(EPS)
S6 Fig. Variation in BMI explained (adjustedR2) by differential methylation of 77 nonre-dundant replicated CpGs in the FHS-LBC epigenome-wide association study and tested in the independent PIVUS cohort. CpGs are added in decreasing order of significance and are adjusted for age, sex, and preceding CpGs.
(EPS)