DEPRESSION, DIABETES, AND SOCIAL SUPPORT
Jaimie Cathryn Hunter
A dissertation submitted to the faculty at the University of North Carolina at Chapel Hill in partial fulfillment of the requirements for the degree of Doctor of Philosophy in the Gillings School of Global Public Health
(Health Behavior).
Chapel Hill 2015
ABSTRACT
Jaimie Cathryn Hunter: Depression, Diabetes, and Social Support (Under the direction of Edwin Fisher)
This dissertation is dedicated to my mother, Claire W. Hunter, who made even the darkest days bright and who now knows far more than she ever wanted to know about moderation, mediation, and survival
analysis; to my father, William E. Hunter, whose tireless devotion to making sure I succeed helped me learn to focus on something so much greater than anything I had ever accomplished in the past; and to
my brother, William L. Hunter, JD, and his beautiful wife and daughters, who have been terrific cheerleaders along this journey. Most importantly, this dissertation is dedicated to all students who live
ACKNOWLEDGEMENTS
I am grateful for the opportunity to use data from the Diabetes Prevention Program (DPP). DPP was conducted by the DPP Research Group and supported by the National Institute of Diabetes and Digestive and Kidney Diseases (NIDDK), the General Clinical Research Center Program, the National Institute of Child Health and Human Development (NICHD), the National Institute on Aging (NIA), the Office of Research on Women's Health, the Office of Research on Minority Health, the Centers for Disease Control and Prevention (CDC), and the American Diabetes Association. The data from the DPP were supplied by the NIDDK Central Repositories. This dissertation was not prepared under the auspices of the DPP and does not represent analyses or conclusions of the DPP Research Group, the NIDDK Central Repositories, or the NIH.
I want to acknowledge Drs. Brenda DeVellis and Joanne Jordan, as well as their research teams, for their great efforts in developing the JOCO and ACES datasets. The Johnston County Osteoarthritis Project was supported in part by the Centers for Disease Control and Prevention/ Association of Schools of Public Health (cooperative agreements S043, S1734, and S3486), the National Institute of Arthritis and Musculoskeletal and Skin Diseases Multipurpose Arthritis and Musculoskeletal Disease Center(grant 5-P60-AR30701), and the National Institute of Arthritis and Musculoskeletal and Skin Diseases
Multidisciplinary Clinical Research Center (grant 5-P60-AR49465-03). The Arthritis, Coping and Emotions Study was supported by the National Institute of Mental Health (grant R01MH64034).
I also want to acknowledge the hard work conducted by investigators at the United States National Center for Health Statistics in building and maintaining national data on important health issues. Data from the National Health and Nutrition Examination Survey (NHANES) are freely available on the Centers for Disease Control and Prevention website: http://wwwn.cdc.gov/nchs/nhanes/.
I want to thank my dissertation committee members for the wisdom they shared so willingly. I am truly humbled by sharing this journey with all of you.
I acknowledge with gratitude the tireless work of my mentors and advisors in this process, especially Drs. Brenda DeVellis and Edwin Fisher. I am better academically because you shared knowledge with me, and I am better personally because you pushed me to reach beyond what I thought were my limits. It was not always easy, but it was always worthwhile. Thank you for all you have done; I am very honored to have been your student.
Finally, I want to acknowledge and thank Dr. Chris Wiesen at the UNC Odum Institute for
TABLE OF CONTENTS
LIST OF TABLES ... x
LIST OF FIGURES ... xi
LIST OF ABBREVIATIONS... xii
CHAPTER 1: INTRODUCTION ... 1
Depression, Diabetes, and Social Support ... 1
Research Questions and Hypotheses ... 5
Theoretical and Conceptual Considerations ... 7
CHAPTER 2: BACKGROUND AND SIGNIFICANCE ... 12
Depression and Diabetes: Challenges for Public Health ... 12
Bidirectional Relationship ... 13
Social Support: A Buffer? ... 16
Control Variables ... 18
Biological Factors ... 18
Demographic Factors ... 20
Health Behaviors ... 21
Limitations of the Current Literature ... 22
Implications for Public Health ... 23
CHAPTER 3: GENERAL METHODS ... 24
Preparation for Data Analysis ... 24
Multivariate Data Analysis ... 26
Calculating and Interpreting Moderation Models ... 27
CHAPTER 4: THE DIABETES PREVENTION PROGRAM AND DPP
OUTCOMES STUDY ... 31
Methods Specific to DPP ... 31
About the Study ... 31
Measures ... 32
Statistical Analysis ... 35
Results from DPP ... 37
Sample Characteristics ... 37
Bivariate Relationships ... 39
Final survival model ... 41
Summary ... 42
CHAPTER 5: THE NATIONAL HEALTH AND NUTRITION EXAMINATION SURVEY ... 55
Methods Specific to NHANES ... 55
About the Study ... 55
Measures ... 56
Statistical Analysis ... 58
Results from NHANES ... 60
Sample Characteristics ... 60
Summary ... 63
CHAPTER 6: THE ARTHRITIS, COPING, AND EMOTION STUDY... 68
Methods Specific to ACES ... 68
About the Study ... 68
Measures ... 69
Statistical Analysis ... 72
Results from ACES ... 74
Sample Characteristics ... 74
CHAPTER 7: DISCUSSION ... 96
Study Finding with Respect to Hypotheses ... 96
Hypotheses 1a, 1b, and 1c: The Direct Effect of Depression on Diabetes Status ... 96
Hypothesis 2: Moderation By Social Support ... 96
Hypothesis 3: Mediation By Obesity ... 96
Application and Implications ... 97
Characterizing the Relationship between Depression and Diabetes ... 97
Making the Case for Social Support ... 99
Limitations ... 103
Future Directions ... 106
Conclusion ... 110
LIST OF TABLES
Table 3.1. Variables Used in the Present Study ... 29
Table 4.1. Characteristics of the DPP/DPPOS Sample ... 43 Table 4.2. Bivariate Relationships between DPP/DPPOS Covariates and
Time to Diabetes Diagnosis, Derived from Simple Accelerated Failure
Time Models ... 44
Table 4.3. Covariate-Only Model (Model 1), Unconditional Model (Model 2), and Conditional Model (Model 3) for the Relationship between Covariates and Time to Diabetes Diagnosis using DPP/DPPOS Data and an Accelerated
Failure Time Model, with Likelihood Ratio Tests of Model Fit (n = 2,299). ... 45
Table 4.4. Final Model for the Relationship between Covariates and Time to Diabetes Diagnosis Using DPP/DPPOS Data and an Accelerated Failure
Time Model (n = 2,299). ... 46 Table 5.1. Characteristics of the NHANES Sample ... 64
Table 5.2. Bivariate, Independent Relationships between Each NHANES Independent Variable and Diabetes Status, Derived from Weighted Logistic
Regression Analyses ... 65 Table 5.3. Covariate-Only Model (Model 1), Unconditional Model (Model 2),
and Conditional Model (Model 3) for the Relationship between Covariates and Diabetes Status using NHANES Data and Weighted Logistic Regression for
Complex Sampling Design, with Contrast Tests of Model Fit (n =3,351). ... 66 Table 5.4. Final Model for the Relationship between Covariates and Diabetes
Status Using NHANES Data and Weighted Logistic Regression for Complex
Sampling Designs (n = 3,351). ... 67 Table 6.1. Bivariate Analyses between Independent Variables Measured at
Baseline and Diabetes Measured at Wave 2 ... 85
Table 6.2. Characteristics of the ACES Sample ... 86 Table 6.3. Bivariate, Independent Relationships between Each ACES
Independent Variable and Diabetes Status at Wave 1, Derived from Simple
Logistic Regression Analyses ... 87
Table 6.4. Relationships between Models and Data ... 87 Table 6.5. Total, Direct, and Indirect Effects for the Influence of Depression or
Depressive Symptoms on Diabetes Status, As Mediated By Body Mass Index (BMI)... 94 Table 7.1. Summary of Effect Sizes for Depressive Symptoms and Social
Support for Diabetes Prevention Program, National Health and Nutrition
LIST OF FIGURES
Figure 1.1. Generalized conceptual model for the present study: a moderation model. ... 9
Figure 1.2. Detailed conceptual model for the present study, informed by the
Stress-Buffering Model and the Biopsychosocial Model. ... 11 Figure 4.1. Survivor function of diabetes data with 95% confidence limits. ... 46 Figure 4.2. Kaplan-Meier product-limit survival curves for categorical BDI score,
where 1 = high depression, 2 = moderate depression, 3 = mild depression, and 4 = no depression. Log rank score indicates that a difference exists
between levels of the independent variable. ... 47 Figure 4.3. Kaplan-Meier product-limit survival curves for dichotomous Social
Provisions Scale score, where 1 = low support and 2 = high support. Log rank
score indicates that a difference exists between levels of the independent variable. ... 48 Figure 4.4. Kaplan-Meier product-limit survival curves for categorical age group,
which is organized from 1 = youngest to 7 = oldest. Log rank score indicates
that a difference exists between levels of the independent variable. ... 49 Figure 4.5. Kaplan-Meier product-limit survival curves for ethnicity, where
1 = other group, 2 = Latino/a, 3 = African American, and 4 = Caucasian. Log rank score indicates that a difference exists between levels of the
independent variable. ... 50 Figure 4.6. Kaplan-Meier product-limit survival curves for sex, where 1 = male
and 2 = female. Log rank score indicates that no significant difference exists
between levels of the independent variable. ... 51
Figure 4.7. Kaplan-Meier product-limit survival curves for educational attainment, where 0 = less than or equal to a high school education and 2 = at least some college. Log rank score indicates that no significant difference exists between
levels of the independent variable. ... 52
Figure 4.8. Kaplan-Meier product-limit survival curves for smoking status, where 1 = former smoker, 2 = current smoker, and 3 = never smoker. Log rank score indicates that no significant difference exists between levels of the independent
variable. ... 53
Figure 4.9. Kaplan-Meier product-limit survival curves for treatment group, where 1 = lifestyle intervention, 2 = metformin intervention, and 3 = placebo. Log rank score indicates that significant differences exist between levels of the
independent variable. ... 54
LIST OF ABBREVIATIONS ACES Arthritis, Coping, and Emotion Study
ADA American Diabetes Association BDI Beck Depression Inventory
CDC Centers for Disease Control and Prevention
CES-D Center for Epidemiologic Studies – Depression scale CI Confidence interval
CIDI Composite International Diagnostic Interview DPP Diabetes Prevention Program
DPPOS Diabetes Prevention Program Outcomes Study FPG Fasting plasma glucose
HR Hazard ratio
HbA1c Hemoglobin A1c (glycosylated hemoglobin) ISEL Interpersonal Support Evaluation List MDD Major depressive disorder
NCHS National Center for Health Statistics
NHANES National Health and Nutrition Examination Survey
NIDDK National Institute of Diabetes and Digestive and Kidney diseases
OR Odds Ratio
PHQ-9 Nine-item Patient Health Questionnaire SPS Social Provisions Scale
CHAPTER 1: INTRODUCTION Depression, Diabetes, and Social Support
Increasing efforts to explicate the dichotomy between mental and physical disease and
demonstrate its fallacies have paved the way for a new understanding of the mutually influential nature of these factors. This evolving view of physical and mental health as interdependent, co-evolving processes has presented new opportunities for public health researchers and practitioners to understand health outcomes more holistically. It has spawned new fields of inquiry, such as behavioral medicine and health psychology, to address the mental health needs of individuals living with chronic disease and the physical health impact on those struggling with mental illness. The commitment of public health to this movement is evident in the Centers for Disease Control and Prevention (CDC)’s recent crusade to include mental health promotion and mental illness prevention in public health practice (CDC, 2011b). Developing a more thorough understanding of the complex interplay between mental and physical health is crucial in developing innovative and relevant interventions for treating and preventing mental illness, reducing stigma, and improving lives.
While the relationship between depression and diabetes is gaining recognition, resilience or “buffer” variables (statistical moderators) that could lessen the impact of depression on diabetes remain underexplored. For instance, it could be that the relationship between depression and diabetes is not as strong in the presence of social support, defined here as “the various resources provided by one’s interpersonal ties” (S Cohen & Hoberman, 1983) (p. 100). Social support has been shown to buffer the deleterious health outcomes associated with stress (or stressors) and chronic illness, including HIV (Ashton et al., 2005), mental distress (Olstad, Sexton, & Sogaard, 2001), arthritis (Penninx et al., 1998; Penninx et al., 1997), and coronary artery disease (Wang, Mittleman, & Orth-Gomer, 2005).
Diabetes is a strong candidate for testing the buffering hypothesis of social support because its etiology can be influenced by psychosocial and behavioral factors, such as engaging in self-care behaviors, eating nutritious foods, and maintaining a healthy weight. The buffering effect assumes that exposure to social support is adequate to help interrupt the etiological pathway of the disease (S Cohen, 1988). Social support has been shown to moderate the relationship between self-care activities and glycosylated hemoglobin (HbA1c, a measure of average glucose in the blood often used to measure adequacy of glucose control in diabetes management) such that, with social support, individuals are more likely to be able to control their HbA1c levels by engaging in self-care activities than are their counterparts without social support (Shayeghian et al., 2015). Furthermore, having social support can improve
This research was broad in the methods used to model the relationship between depression and diabetes. With the first dataset, including data from the Diabetes Prevention Program (DPP), hazard for diabetes development given depression and presence versus absence of social support was assessed using a technique in survival analysis widely known as the Cox proportional hazards regression model. With the Arthritis, Coping, and Emotion Study (ACES) data and the 2007-2008 National Health and Nutrition Examination Survey (NHANES) data, multiple logistic regression analyses were used to model increments in log odds of diabetes for depressive symptoms and social support. Mediation analysis was also used with the ACES data to look for mediation effects of body mass index. Each database is described briefly below and explored in more detail in Chapters 4 (DPP), 5 (NHANES), and 6 (ACES).
Dataset 1 (DPP). The study first examined the impact of social support on hazard for development of diabetes longitudinally (over 12 years) as a function of depressive symptoms. People with
pronounced depression or taking high doses of antidepressants were screened out of the original DPP study, so effects seen in the present study are for individuals ostensibly living with mild to moderate levels of depressive symptoms. The study used data not only from the Diabetes Prevention Program (DPP; National Institute for Diabetes and Digestive and Kidney Diseases), a sample of adults at high risk for type 2 diabetes, but also from the DPP Outcomes Study (DPPOS), a
Dataset 2 (NHANES). In the second dataset analyzed, cross-sectional data from the 2007-2008 National Health and Nutrition Examination Survey (NHANES; National Center for Health Statistics) were used for the availability of all variables of interest. The NHANES dataset is the product of a health status survey conducted every year in the homes of randomly selected Americans. The 2007-2008 data are the most recent that include the NHANES Social Support Questionnaire. Depressive symptoms are measured using a 9-item scale derived from the Patient Health Questionnaire (PHQ) (Kroenke & Spitzer, 2002; Kroenke, Spitzer, & Williams, 2001; Spitzer, Kroenke, & Williams, 1999), and diabetes is ascertained from HbA1c or fasting plasma glucose and self-report data. A five-point social inclusion scale was conducted using answers to relevant questions including marital status, financial support availability, emotional support availability, friendship, and church attendance.
Dataset 3 (ACES). The third arm of the study used data from the Arthritis Coping and Emotions Study (ACES, PI: B. DeVellis / J. Jordan), a longitudinal community survey of biological and psychosocial correlates of arthritis in adults aged 45 and older living in Johnston County, North Carolina. This dataset is housed at the University of North Carolina at Chapel Hill. Perceived social support was examined as a moderator for the relationship between answers to a depression screener and self-reported presence vs. absence of diabetes. ACES utilizes the Composite International Diagnostic Interview (Robins et al., 1988) as a diagnostic tool for depression and the Center for Epidemiological Studies – Depression scale (CES-D) (Radloff, 1977) as a tool for depressive symptoms. Social support was measured using items from the widely-used Interpersonal Support Evaluation List (ISEL) (S Cohen & Hoberman, 1983).
represent the constituents properly, whereas the other two datasets did not), and data structure (it does not make sense to combine a longitudinal study with a cross-sectional one or to examine survival analysis models cross-sectionally), the three datasets could not be pooled. Differences in findings or
inconsistencies that occur across datasets were examined in light of the type of variable for which the difference arose. For example, it is known that structural support measures may not adequately capture available support and that structural support may perform more poorly in buffering stress than perceived support (S Cohen & Wills, 1985). So, if a difference is noted between a functional and structural support measure, it might make sense that the inconsistency between datasets is a function of a measurement issue rather than a problem with the study.
The relationship between depression and diabetes is a critical topic for public health research, given the high prevalence and significant morbidity associated with each of the conditions. Previous studies indicate that successful treatment of depression could reduce diabetes risk (Kan et al., 2013; Silva, Atlantis, & Ismail, 2012). Identifying psychosocial buffers that would moderate the relationship between depression and diabetes could also reduce the increased risk for diabetes conferred by living with depression. From a wider perspective, understanding the influence of psychosocial determinants of the development of physical disease would facilitate prevention and intervention efforts at multiple levels of the socioecological framework.
Research Questions and Hypotheses
This study had two main research questions, a minor question to be addressed with the ACES study, and seven total hypotheses. The overall goals of the study were to explore the nature of the relationship between depression and diabetes and to determine whether social support
moderates or “buffers” this relationship.
Research Question 1: What is the nature of the relationship between depression and diabetes in the DPP, NHANES, and ACES datasets?
Hypothesis 1b: Recent depression and diabetes are directly and positively related such that people who have had depression in the previous 12 months will have higher odds of diabetes as compared to people who have not had depression in the previous 12 months, when depression is measured categorically (ACES recent CIDI depression model).
Hypothesis 1c: Lifetime depression and diabetes are directly and positively related such that people who have ever had depression will have higher odds of diabetes as compared to people who have never had depression, when depression is measured categorically (ACES lifetime CIDI depression model).
Research Question 2: Does having social support moderate the relationship between depression (or depressive symptoms) and diabetes?
Hypothesis 2: The association between having depressive symptoms and odds of diabetes will depend on the level of social support such that, for individuals with high levels of social support, the association between depression and diabetes will be attenuated compared to those with low levels of social support.
(Minor) Research Question 3: Does body mass index (BMI) mediate the relationship between depression or depressive symptoms and diabetes? (Note: For methodological reasons explained in greater detail below, this meditational analysis was only carried out in the ACES study.)
Theoretical and Conceptual Considerations
Health does not occur in a vacuum; rather, it is the product of interactions between individuals and their physical, social, and cultural environments (Glanz, Rimer, & Viswanath, 2008). The underlying goal of the present research was to use a socioecological model as a framework for understanding the relationship between depression and diabetes (both intrapersonal variables) and the impact that social support (an interpersonal variable) has on that relationship. As a secondary aim, a biological factor that underlies this pathway was explored; body mass index was treated as a mediator rather than a control variable and proven to be a pathway through which depression impacts diabetes. Resilience factors, such as social support, could help buffer these pathways to prevent comorbidity.
It is clear from the empirical literature that social support confers resilience against chronic illness—for example, by providing enacted support for improvement in diabetes self-management
behaviors (Fortmann, Gallo, Walker, & Philis-Tsimikas, 2010; Osborn & Egede, 2012). Earlier researchers have proposed two theories to explain the mechanisms behind this phenomenon: the buffering
hypothesis and the direct effects hypothesis. The buffering hypothesis poses that social support acts on health by softening the deleterious effect of stress on physiology or mental state (S Cohen, 1988; S Cohen & Hoberman, 1983; S Cohen & McKay, 1984; S Cohen & Wills, 1985). In comparison, the direct effects hypothesis states that the good health often seen among people with adequate social support is a reflection of the fact that people who have social support tend to be healthier in the first place (Strom & Egede, 2012), which raises the question of whether this effect an artifact. It was the stress buffering hypothesis that inspired the present study.
resources in one’s time of need, which may help shorten the stress appraisal process; and (2) it reduces the stress reaction by providing a solution to the problem or facilitating healthy behaviors in reaction to the problem (S Cohen & Wills, 1985). Stated differently, social support provides a vehicle through which someone afflicted by a stressor can problem-solve and cope with that stressor rather than having that stressor overtake them and be detrimental to their physical and/or mental health. A related thought is that social support affects health by interrupting or precluding learned helplessness (Wallston, Alagna, DeVellis, & Devellis, 1983).
The present study examined whether the stress-buffering hypothesis of social support can be expanded to be a depression-buffering mechanism of social support. It asked: where social support has been shown to buffer the effects of stress (or stressors, as the case may be) on chronic mental and physical disease (S Cohen & Hoberman, 1983; S Cohen & McKay, 1984; S Cohen & Wills, 1985), can it also be shown to buffer the effects of depression on disease? This line of inquiry does not equate depression with stress, as the two are very distinct but mutually influential constructs (Hammen, 2005). Rather, it poses the question of whether a concept close to stress that perhaps runs parallel to it can be substituted for stress in this model and, in turn, receive similar benefits.
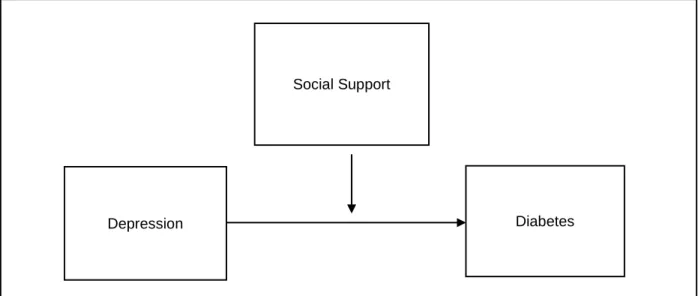
Figure 1.1. Generalized conceptual model for the present study: a moderation model.
Figure 1.2 shows the conceptual model in a bit more detail, including pathways that have empirical evidence to support them. Variables and pathways not measured as part of the present research are drawn in gray for clarity of intent. The path from depression and diabetes has been
demonstrated to be bidirectional (Chen et al., 2013; Golden et al., 2008; Pan et al., 2010), but the present analyses focused on the path from depression to diabetes and the mediating influence of body mass index on this relationship. This path was chosen to test the impact of social support on the relationship.
Pathways beyond those identified by Cohen and colleagues have also been posed for both biological and behavioral mechanisms through which social support impacts physical health. Social support buffers the effects of stressors on chronic disease through activation of the endocrine system by altering catecholamine and cortisol levels and of the immune system by boosting natural killer and helper T cells and antibodies (B. N. Uchino, 2006; B. N. Uchino, Cacioppo, & Kiecolt-Glaser, 1996). Social environment early in life buffers the impact of stress on health epigenetically through DNA methylation over the course of a lifetime; called “epigenetic programming,” this process explains how protective genes can become “turned off or on” in response to a nurturing social environment early in life, which in turn provides protection or risk for disease over the course of a lifetime (Szyf, McGowan, & Meaney, 2008).
Depression Diabetes
While Uchino and colleagues (2006) have shown that the impact of social support on chronic disease outcomes does not work through a health behavior pathway, other researchers have found evidence for the positive impact of social support on health behaviors. Researchers have lauded social support as a critical factor in helping people stop smoking (E. B. Fisher, Jr., 1997; Lawhon, Humfleet, Hall, Munoz, & Reus, 2009; R. P. Murray, Johnston, Dolce, Lee, & O'Hara, 1995; J. Wagner, Burg, & Sirois, 2004). Moreover, it has been shown that higher levels of social support are associated with more physical activity (Kitzman-Ulrich, Wilson, Van Horn, & Lawman, 2010; Peterson & Cheng, 2013) and improved adherence to dietary recommendations (Aggarwal, Liao, Allegrante, & Mosca, 2010; Nicklett et al., 2012; Scholz, Ochsner, Hornung, & Knoll, 2013; Tamers et al., 2011).
Even with this positive relationship between social support and lifestyle changes, the evidence for the relationship between social support and body mass index remains inconclusive. Some studies have found no direct relationship between the two variables (Kim, McEwen, Kieffer, Herman, & Piette, 2008; Tamers et al., 2011), while another found that, among adults, risk for becoming obese increases by 57% if a friend becomes obese (Christakis & Fowler, 2007). Similarly, BMI increases for both men and women during marriage and cohabitation (Averett, Sikora, & Argys, 2008).
bidirectional. Evidence supporting the bidirectional relationship between depression and diabetes (and explaining comorbidity) arises from common biological and behavioral mechanisms, such as sleep disturbance, activation of the hypothalamus-anterior pituitary-adrenal (HPA) axis, and poor dietary habits (L. Berkman, Glass, Brissette, & Seeman, 2000; Holt et al., 2014).
CHAPTER 2: BACKGROUND AND SIGNIFICANCE Depression and Diabetes: Challenges for Public Health
Major depressive disorder is pervasive in the United States (US) and carries with it increased morbidity from the disease and its frequently comorbid conditions. Nationally, it is estimated that one in five adults will experience a major depressive episode at some point during his or her lifetime (Kessler et al., 2010). Further, a large epidemiological survey found that approximately 8% of all US adults had experienced a major depressive episode in the previous year (Kessler, Chiu, Demler, Merikangas, & Walters, 2005). With symptoms that may include restlessness, irritability, persistent depressed mood, thoughts of death, loss of interest or pleasure in daily activities, and/or feelings of hopelessness (NIMH, 2014), depression can be devastating to relationships, productivity, and health. In 2010, depression was the second highest cause of disability in the US, after back pain (C. J. Murray et al., 2013), and this finding does not account for disability or lost productivity from other illnesses, such as diabetes mellitus, for which depression confers increased risk. In spite of its severity and pervasiveness, this disease frequently goes undiagnosed and undertreated. Contributing to this problem is a shortage of mental health professionals: e.g., only about 7 psychiatrists per 100,000 population in the US (WHO, 2011). The consequences of untreated depression include increased quantity and severity of physical comorbidities (Ghio et al., 2015), such as diabetes.
disease, stroke, renal failure, blindness, peripheral vascular disease, or death (CDC, 2011a). Moreover, diabetes ranks eighth in the US for number of years lost to disability (C. J. Murray et al., 2013). While age, gender, race, and body size all impact the development of diabetes (ADA, 2014), recent research efforts have focused on exploring the myriad psychosocial factors, including depression, that influence diabetes onset (Liburd, Jack, Williams, & Tucker, 2005; Olson et al., 2010; M. Peyrot, McMurry, & Kruger, 1999).
Empirical evidence points to substantial relationships between depression and diabetes. An age-adjusted analysis using Behavioral Risk Factor Surveillance System (BRFSS) data found that more than 9% of US adults with diabetes have comorbid depression (Li et al., 2009). Other studies have estimated that nearly one in five individuals with diabetes currently has depression, compared to less than half this number in the general population (Nichols & Brown, 2003; Roy & Lloyd, 2012). In a recent cross-sectional study of NHANES data, researchers found that those with diabetes that was clinically diagnosed had four times higher odds of having depression compared to those without diabetes, while undiagnosed diabetes was not statistically significantly associated with depression (B Mezuk et al., 2013). Treating one of the two comorbid conditions results in a change in the other, indicating that these diseases shift as a system rather than independently. For example, among patients with diabetes, relieving depressive symptoms decreases levels of glycosylated hemoglobin (HbA1c), a biomarker for glucose control in diabetes; changes in depressive symptoms correlate with changes in HbA1c (r=0.45) (Echeverry, Duran, Bonds, Lee, & Davidson, 2009). Moreover, the outcomes of each of these diseases are made worse by the presence of the other (Holt et al., 2014).
Bidirectional Relationship
Living with depression increases a person’s likelihood that he or she will develop diabetes later in life. In a meta-analysis of studies that examined the relationship between depression and the onset of diabetes, researchers concluded that depressed adults have a 37% higher risk for developing Type 2 diabetes than those without depression (Knol et al., 2006). A longitudinal study of adults aged 55 and older found a 65% increase in risk; they estimated that, among their sample of participants, the amount of diabetes that was attributable to depression was nearly 7% (Campayo et al., 2010). In a sample of adults aged 65 and older, those who lived with clinical depression were at least twice as likely to develop
(Atlantis et al., 2010). Increased risk for diabetes onset conferred by living with depression persists above and beyond risk conferred by lifestyle factors such as poor diet (Carnethon et al., 2007; B. Mezuk, Eaton, Albrecht, & Golden, 2008), family history (B. Mezuk, Eaton, Albrecht, et al., 2008), antidepressant use (Atlantis et al., 2010; Kivimaki et al., 2010; Sambamoorthi, Ma, Findley, & Rust, 2013), and sedentary lifestyle (Carnethon et al., 2007; B. Mezuk, Eaton, Albrecht, et al., 2008).
More recent studies have examined the impact of depression on insulin resistance, which
indicates a high risk for diabetes. A meta-analysis of observational studies, clinical trials, and unpublished data demonstrated that the presence of depression is modestly but statistically significantly associated with insulin resistance [pooled effect size: 0.19 (CI: 0.11-0.27)] (Kan et al., 2013). This finding persisted above and beyond the fact that the methods used for measuring depression and insulin resistance differed among the 18 studies examined. A cross-sectional study using NHANES data from 1999-2008 found a significant negative relationship between insulin resistance and depression that existed only in men (Shen & Bergquist-Beringer, 2013). However, a recent review found evidence of the association between depression and insulin resistance is inconsistent, as cohort studies tend to find a negative relationship and cross-sectional studies find a positive relationship; this review also notes that some clinical trials found that administering antidepressants among depressed participants helps lower insulin resistance (Silva et al., 2012). This tentative finding implies that a reduction in depression could help prevent diabetes.
While evidence for a causal relationship between depression and diabetes continues to
accumulate, it has sometimes been difficult to tease apart the directionality of the relationship. This major limitation of early research findings arose from difficulties in determining the temporal order of the
In a seminal longitudinal study of adults aged 45 and older who participated in the Multi-Ethnic Study of Atherosclerosis (MESA), Golden and colleagues (2008) found a modest 10% increase in risk for development of type 2 diabetes over 3 years given baseline depressive symptoms (odds ratio = 1.10; CI: 1.02-1.19). This association remained statistically significant after controlling for inflammation, a risk factor for both depression (Howren, Lamkin, & Suls, 2009) and type 2 diabetes (Calle & Fernandez, 2012; Pradhan, Manson, Rifai, Buring, & Ridker, 2001), and was only partially explained by lifestyle factors (Golden et al., 2008). Furthermore, the research team found a 54% increase in risk for depression at follow-up among individuals living with diabetes at baseline (OR = 1.54; CI: 1.13-2.09), indicating that the relationship is bidirectional (2008).
Large parallel studies in which groups of individuals with diabetes but no depression, and groups of individuals with depression but no diabetes are monitored over time for the development of disease have become a research standard in this field. These studies may be done prospectively or as part of a secondary analysis plan. In a breakthrough examination of 10-years of data from the Nurses’ Health Study, Pan and colleagues found that the relative risk of developing diabetes for individuals with
moderate to severe depression who were not taking antidepressants was 1.17 (95% CI: 1.05, 1.30), and that for individuals with depression who were taking antidepressants was 1.25 (CI: 1.10, 1.41). These findings persisted after controlling for body mass index, family history of diabetes, smoking, physical activity, dietary patterns, and alcohol consumption. Moreover, individuals with diabetes had a relative risk for developing depression of 1.29 (CI: 1.18, 1.40) compared to those without diabetes, after controlling for all covariates. This risk increased to a level as high as 1.53 (CI: 1.26, 1.85) if diabetes was untreated (Pan et al., 2010).
The present study focused on varied measures of depression and the risk it confers related to diabetes status, and the extent to which social support can moderate (“buffer”) the hypothesized direct, positive relationship between depression and diabetes. Because the goal, more generally, was to determine whether psychosocial resilience factors can soften the effect of a mental illness on a physical illness, the unidirectional relationship from depression to diabetes was chosen. The researcher aimed to establish that depressive symptoms and diabetes are related in three large datasets: 2007-2008 National Health and Nutrition Examination Survey, Diabetes Prevention Program, and Arthritis, Coping, and Emotion Study, in hopes that the moderation effect could also be established.
Social Support: A Buffer?
The establishment of a direct, positive relationship between depression and diabetes naturally raises the question of whether there are any factors that can confer resilience—that is, buffer the flow from mental distress to physical disease. The answer may lie in a body of literature on the stress buffering model of social support. Dunkel-Schetter and colleagues describe resilience in the context of chronic stress as "the process involving an ability to withstand and cope with ongoing or repeated demands and maintain healthy functioning in different domains of life such as work and family" (Dunkel-Schetter & Dolbier, 2011) (p. 8). The present research posits, therefore, that the direct, positive relationship between depressive symptoms and diabetes will be attenuated if social support is present.
The buffering model of social support was perhaps best summarized by Cohen and Hoberman (1983): “High levels of social support protect one from stress-induced pathology but social support level is relatively unimportant for those experiencing low levels of stress” (p. 100). There is wide support for this model in the literature, especially with respect to myocardial infarction (L. Berkman et al., 2000; B. Uchino, Holt-Lunstad, Uno, & Betancourt, 1999); for illustrative purposes, this brief review will focus on the impact of social support on diabetes outcomes.
Social support and diabetes
Rosland, 2013). Social support also increases the odds that a person with diabetes will exercise by 22-38% (Nicklett et al., 2013; Rees, Karter, & Young, 2010). In a qualitative study of 34 people with diabetes, Vest and colleagues (2013) found that social support helps improve self-care through providing
assistance for day-to-day care, providing emotional support, and setting an example to motivate individuals (Vest et al., 2013). Improvements in self-care are associated with better diabetes outcomes and quality of life.
Exactly how social support influences diabetes outcomes, however, is not well understood (Dale, Williams, & Bowyer, 2012; Stopford, Winkley, & Ismail, 2013; Strom & Egede, 2012). It has been
demonstrated, for example, that social support can buffer the impact of chronic stressors on glycosylated hemoglobin (HbA1c) levels by helping individuals cope with those stressors (MF Peyrot & McMurry, 1992). Olson and colleagues (2010) conducted an exploratory, cross-sectional study of the impact of social relationships on chronic disease processes and found that interpersonal relationships were inversely related to HbA1c levels and inflammatory cytokines. These findings were independent of diabetes self-management or other health behaviors (Olson et al., 2010).
Social support and depression
(Heaney & Israel, 2008)—was associated with increased depressive symptoms among patients with diabetes (Penninx et al., 1998). The authors attribute the latter finding, which appears contrary to the others, to the possibilities that people displaying depressive symptoms elicit more sympathy and that receiving this type of support fosters dependence, which in turn leads to more depression.
Social support as a buffer against depression among those with diabetes
Some work has been done relating depression to diabetes with social support as a moderator. However, these studies have used diabetes as the predictor of depression, whereas the present study uses depression as a predictor of diabetes. Littlefield and colleagues (1990) conducted a cross-sectional study of individuals living with insulin-dependent diabetes, some of whom also had end-stage renal disease. After surveying the participants, the researchers found that depression was associated with increased physical impairment and decreased support and that, among people with the most severe physical complications, having support protected against depression arising from diabetes and its complications (Littlefield, Rodin, Murray, & Craven, 1990).
The present research examined the impact of social support on the development of diabetes, controlling for psychosocial and biological risk factors. The researcher postulated that depression would be associated with a greater likelihood of diabetes and that social support would moderate or reduce this effect—that is, if social support is present, then the direct, positive relationship between depression and diabetes would be weaker.
Control Variables
This section presents some variables that have been shown in the literature to impact depression and/or diabetes. These variables have been used as statistical covariates, although body mass index was used as a mediator in the ACES dataset toward the end of the study.
Biological Factors Inflammation
et al., 2009; Ranjit et al., 2007); in fact, some researchers now consider depression to be an inflammatory disease (Catena-Dell'Osso, Rotella, Dell'Osso, Fagiolini, & Marazziti, 2013; Copeland, Shanahan,
Worthman, Angold, & Costello, 2012; Howren et al., 2009; Messay, Lim, & Marsland, 2012; Zunszain, Hepgul, & Pariante, 2013). Conversely, having positive affect has been shown to lower inflammatory activity (Steptoe, O'Donnell, Badrick, Kumari, & Marmot, 2008; Steptoe, Wardle, & Marmot, 2005).
The nature of the connection between depression, diabetes, and inflammation remains unclear. For instance, recent evidence suggests that inflammation is a common causal factor for both depression and diabetes (Stuart & Baune, 2012). Further studies are needed to replicate these findings.
Nevertheless, inflammation only accounts for a portion of the variance explained by the relationship between diabetes and depression.
Gaining a better understanding of how social involvement impacts inflammation is critical in learning about how psychosocial factors influence health (Kiecolt-Glaser, Gouin, & Hantsoo, 2010). Studies that, to-date, have shown that having social support is inversely correlated with levels of inflammatory markers (Glei, Goldman, Ryff, Lin, & Weinstein, 2012; Loucks et al., 2006; B. Mezuk, Diez Roux, & Seeman, 2010; Olson et al., 2010) and positively associated with immune functioning (Hansel et al., 2010).
Obesity
Obesity, defined as body mass index (BMI) greater than or equal to 30 kg/m2, is a critical risk factor for type 2 diabetes, heart disease, and other health consequences. BMI could mediate the pathway between depression and diabetes in a direct, dose-response fashion. Obesity can be a consequence of depression; depression can impede health-related self-care behaviors, such as exercise, medication adherence, sleep, and proper nutrition (Chan, Lin, Chau, & Chang, 2012; Egede, Ellis, & Grubaugh, 2009; Gonzalez et al., 2008). In turn, as BMI increases, so does risk for developing diabetes owing to impeded metabolic functioning (Howren et al., 2009; Ranjit et al., 2007).
support moderates the relationship between BMI, perceived peer isolation, and depression among adolescents (Xie et al., 2005).
Demographic Factors Ethnicity
Being African American confers increased risk for depression-diabetes comorbidity; the odds of having comorbid diabetes and depression for African Americans are 1.67 times as high as those for Caucasians (p < 0.05) (Blazer, Moody-Ayers, Craft-Morgan, & Burchett, 2002). Moreover, even when controlling for social support, African Americans are only about half as likely to report depression as Caucasians are (Shim et al., 2012).
It is clear that African Americans and Caucasians can have different risk levels for both diabetes and depression. For instance, access to resources is often disparate between African American and Caucasian communities, and financial distress, community disadvantage, and low levels of educational attainment are significantly correlated with HbA1c, as mediated by depressive symptoms (Kogan, Brody, & Chen, 2009). Moreover, African Americans are more likely than Caucasians to receive substandard treatment for their depression (de Groot, Pinkerman, Wagner, & Hockman, 2006; Delaney, Oddson, McClelland, & Psaty, 2009; J. Wagner, Tsimikas, Abbott, de Groot, & Heapy, 2007; J. A. Wagner, Perkins, Piette, Lipton, & Aikens, 2009) and may therefore be at a greater risk for consequences of the disease. People may also experience depression differently based on their racial or ethnic heritage; for instance, stress associated with perceived prejudice has been shown to lead to depression among African Americans living with diabetes (J. Wagner & Abbott, 2007). More research is needed to better understand racial or ethnic differences in diabetes outcomes in the context of depression.
Sex
depression among older men without social support were 3.5 times as great as the odds for those with social support; there was no significant relationship between depression and social support for women, even though women were more likely to be depressed (OR: 3.5; CI: 1.1,12.1) (Alexandrino-Silva, Alves, Tofoli, Wang, & Andrade, 2011). The type of social support needed may also differ between men and women; research indicates that men are more likely to have depression in the absence of tangible support, whereas women are more likely to have depression if they do not have emotional support (Grav et al., 2012). Some other studies either (1) found no gender differences in the relationship between social support and depression (Dalgard et al., 2006) or (2) simply did not stratify by gender (Egede & Osborn, 2010; Liu et al., 2013; Patten et al., 2010).
Sex may also play an important role as a moderator of the main-effects relationship between depression and diabetes. A recent study found that the association between depression and insulin resistance exists only for men (Shen & Bergquist-Beringer, 2013). In another study, women were 62% more likely to have comorbid diabetes and depression than their male counterparts (OR: 1.62, p < 0.05) (Blazer et al., 2002). However, most studies of the relationship between depression and diabetes did not stratify their analyses by gender.
Health Behaviors
Dietary patterns and exercise habits can greatly influence mood (Messier et al., 2013; Nanri, 2013; Quirk et al., 2013; Rogers, 2001) and, if maladaptive, can also lead to obesity, insulin resistance, and diabetes. While lifestyle factors do explain some variance in the development of diabetes in the context of depression, empirical evidence indicates that the depression-diabetes relationship persists throughout the lifespan and above and beyond the effects of lifestyle (Carnethon et al., 2007; Golden et al., 2008; Golden et al., 2004; B. Mezuk, Eaton, Albrecht, et al., 2008).
Smoking
Thulesius, 2013). Furthermore, recent longitudinal research has revealed that depression and smoking have a bidirectional causal relationship such that the two conditions fuel one another; this finding was especially pertinent to adolescents who smoke as they enter adulthood (Tjora et al., 2014). A study conducted over 10 years found that both smoking at baseline and persistently smoking (i.e. continued at 10-year follow-up) both approximately doubled a person’s risk for having depression at the end of the study (Bakhshaie, Zvolensky, & Goodwin, 2014). These were strong studies and lend heavy credence to the relationship between depression and smoking.
Limitations of the Current Literature
Researchers have made great strides in understanding the connections between depression and diabetes, finding clear relationships between the two conditions and beginning to postulate biological mechanisms through which these relationships might be mediated. However, there are several limitations and gaps in current knowledge. First and foremost, while research concerning covariates of social support, depression, and diabetes has begun to accumulate, no study to-date has examined social support as a moderator for the relationship between depression and diabetes in the direction from
depression to diabetes. Rather, researchers have found that social support reduces the risk of depression among people already living with diabetes—that is, it buffers the effects of the stress of living with
diabetes on depression. Second, there has been difficulty with temporally separating the effects of
depression and diabetes (Eaton et al., 1996), although this issue has become less of a concern with more recent parallel studies that feature newer, longitudinal datasets. Third, attempts to parse biological
Implications for Public Health
Diabetes and depression present significant burdens of morbidity, and it appears that they drive each other. Understanding factors that could prevent one or both conditions from developing would have profound public health benefits and allow researchers to develop new, state-of-the-research interventions such as programs to help people living with depression maintain self-care regimens and avoid diabetes. Moreover, comorbid depression and diabetes have implications for self-care and, as such, increase the risk of having poor health outcomes. As a case in point, in an epidemiological, multicultural study of older adults in rural North Carolina, individuals who had comorbid depression and diabetes were more likely to have poor diabetes self-management behaviors, such as blood glucose monitoring and foot-checking, thus rendering them more vulnerable to complications from the disease (Bell et al., 2010). Egede and Osborn (2010) also found a decrease in diabetes self-management behaviors among individuals with comorbid depression and diabetes, and they attributed participants’ worse self-care to lower levels of motivation to comply with recommended self-care regimens as compared to individuals who were not living with depression (Egede & Osborn, 2010).
CHAPTER 3: GENERAL METHODS
The goal of this chapter is to present a general overview of the analytic methods used in the present research. Details specific to the individual databases are included with their corresponding chapters (Chapter 4: Diabetes Prevention Program; Chapter 5: National Health and Nutrition Examination Survey; Chapter 6: Arthritis, Coping, and Emotion Study) and may only be referenced briefly here.
The present study was built around secondary statistical analyses of three large datasets; no original data were collected. The National Health and Nutrition Examination Survey (NHANES) is national-level, and the Diabetes Prevention Program (DPP) data were collected from 27 study sites across the nation. The third dataset, the Arthritis, Coping, and Emotion Study (ACES), came from a study local to Johnston County, North Carolina. All datasets had diabetes status as a dichotomous outcome, though each one operationalized depression and social support differently. These differences will be explored further in Chapters 4 through 6 as data from the individual studies are presented. It should be noted that the term “depression” refers to the construct in general, which in some cases is better denoted as “depressive symptoms” but, in other cases (such as when referring to the CIDI), is reflective of having met clinical criteria for a major depressive episode. Distinctions have been made between the two circumstances throughout the document wherever possible.
All statistical analyses were conducted using SAS version 9.3 software (SAS Institute, Cary) with alpha set at 0.05.
Preparation for Data Analysis
Bivariate analyses were conducted to determine the degree to which each predictor was independently related to diabetes status. Simple logistic regression was used for bivariate analyses. Categorical variables with more than two levels (for instance, ethnicity) were kept categorical and entered as nominal variables as appropriate. Dichotomous variables were dummy coded. Odds ratios were calculated by exponentiating the beta coefficients for the final models. For the NHANES dataset, these logistic regression models were adjusted for the complex sampling design using Mobile Examination Center (MEC) weights in PROC SURVEYLOGISTIC.
Prior to multivariate analysis, PROC REG was used to test for multicollinearity between the independent variables. The criteria for multicollinearity (tolerance, variance inflation factor, and condition index) do not depend on the dependent variable, so using ordinary least squares (OLS) regression was acceptable for this particular test (Allison, 2001). Each independent variable fell well within the acceptable range for all three criteria: VIF was less than 10, tolerance was greater than 0.1, and the condition index was well below 10. Thus, it was concluded that multicollinearity was not a sizeable concern for these data.
Data were not standardized, so reported regression coefficients for ACES and NHANES are unstandardized beta weights (“b”s) and not “β”s.
Multivariate Data Analysis
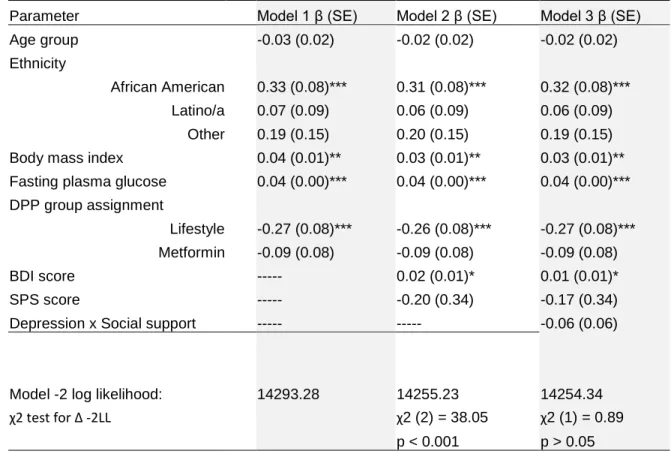
A three-model hierarchical modeling approach was used for all analyses. For NHANES and ACES, logistic regression was used; for DPP, the approach taken was the use of a Cox regression model, a type of survival analysis. Independent variables were retained in the multivariate analyses if the p-value of their univariate association with diabetes (bivariate model) was less than or equal to 0.25 (Hosmer & Lemeshow, 2000).
In Model 1, all demographic and control variables were entered first to adjust for their influence on diabetes status. This model served as the “base” for subsequent models. The -2 log likelihood (-2LL) was reported and recorded to enable the calculation of a likelihood ratio test (LRT), which will help determine whether later models improve on the model fit from this simple covariate model. The LRT is conducted by subtracting the -2LL value of the new model from the -2LL value of the old model. Smaller -2LL are better. The difference between the two -2LL values is the chi-square (χ2) value for the test, and one can compare this value against the critical value for the number of degrees of freedom and alpha level on a chi-square table to determine whether the difference between the two -2LLs is statistically significant. If p < 0.05, then the model with the smaller -2LL value is the better fit. If it is not statistically significant, then the original model can be retained.
Research Question 2, determining whether social support moderates the relationship between depressive symptoms and diabetes, requires a conditional model. Conditional models are so named because they model the relationship between depressive symptoms and diabetes as being conditional or “depending” on the value of social support. As such, they are the “moderation models” of these analyses, where depressive symptoms and social support are the main parameters of interest. Model 3 was conditional, having the addition of the depression by social support interaction variable. Model 3 was created even if Model 2 was not statistically significant. All conditional models included both depressive symptoms and social support, as it is inappropriate in most cases to have an interaction effect without having main effects included in the model (Hayes, 2013). Mathematical and graphical means of interpreting interactions, or statistical moderation models, are described below.
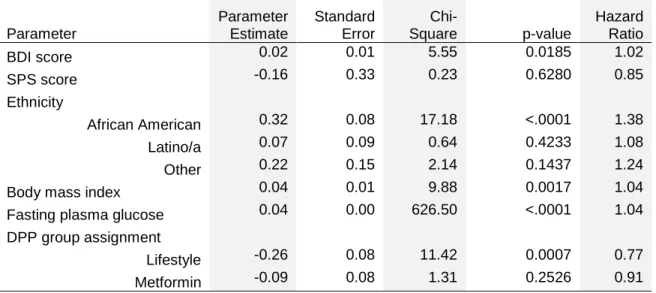
In the end, final models were constructed by accepting either the conditional or unconditional model and removing any parameter(s) with a p-value greater than 0.10, then specifying and re-calculating the model. Odds ratio and confidence limits were calculated for the final models, when possible, by exponentiating the regression coefficients. It is not possible to create odds ratios for
statistically significant interaction terms or for the main effects terms that go into the interaction terms. So, if interaction terms were not significant in the present analyses, they were dropped in favor of simpler models.
It is not appropriate to retain interaction terms that are not significant (Hayes, 2013), but the variables that comprised the interaction term (depressive symptoms and social support) were retained and interpreted in every model, regardless of their p-values, due to their importance to the study’s specific aims.
Calculating and Interpreting Moderation Models
the moderator (Z, social support) by creating a product term between these two variables (X*Z). The relationship between X and Y (the outcome variable, diabetes) is then determined in the context of this interaction (Frazier, Tix, & Barron, 2004). If, in the resultant logistic regression equation, the regression coefficient for the interaction term is statistically significant (p < 0.05), there is evidence for interaction. In all datasets used in this dissertation study, diabetes is modeled as a dichotomous variable; thus, logistic regression was used in each case.
For all datasets, hierarchical regression was used to examine the moderation effect, entering first X and M to create an unconditional model, then adding the X*M interaction to create a conditional model (Hayes, 2013). As described above, in the conditional model, the interaction term determined that the effect of depressive symptoms on diabetes would be contingent upon the level of social support present. If the regression coefficient for the resulting interaction term (moderated effect) were statistically
significant, the results would be probed graphically using simple slopes and intercepts by calculating the effect of depressive symptoms on diabetes at different levels of social support: one standard deviation above the mean and one standard deviation below the mean (Frazier et al., 2004). A simplified formula for calculating simple slopes follows (KJ; Preacher, Curran, & Bauer, 2010):
Equation 3.1. Simple slopes formula
Regression equation: Logit Y = b0 + b1X + b2Z + b3 XZ Can be rearranged to: Logit Y = (b0 + b2Z) + (b1 + b3Z)X
Simple intercept: b0 + b2Z Simple slope: b1 + b3Z
This plot can be achieved using the SAS SGPLOT procedure. Unstandardized beta coefficients would be interpreted to determine whether the hypothesized buffering effect in which the direct positive relationship between depression and diabetes is softened in the presence of social support is viable.
Treatment of Missing Data
missing in 9% of cases. The NHANES documentation states that, “if 10% or less of data for the main outcome variable for a specific component are missing for eligible examinees, it is usually acceptable to continue analysis without further evaluation or adjustment” (Johnson et al., 2013). If more than 10% had been missing, the sample weights would have needed to be readjusted to accommodate the missingness and to minimize bias. Moreover, each independent variable in NHANES had less than 10% missing values.
In the ACES dataset, the smoking variable was missing approximately 43% of its values, and the ISEL variables (appraisal support and tangible support) were missing approximately 34% of their values. The observations for which ISEL data were present did not differ significantly in demographic
characteristics or depression scores from the dataset as a whole, so analyses proceeded under the assumption that data were missing completely at random (MCAR). List-wise deletion was used; in other words, only the cases in which ISEL values were available were used for analyses of tangible support and appraisal support. No bias was introduced through this method because the data were MCAR
(Allison, 2002). The MCAR or MAR (missing at random) assumptions were not true for smoking; cases for which smoking data were included differed from the larger sample on the basis of ethnicity, age,
depression status, and other critical variables in the ACES dataset. Per Allison (2002), list-wise deletion can be used on models with non-missing at random (NMAR) data on the independent or dependent variable, but not both. As a result, smoking data for ACES were not used.
All omissions, “I don’t know” responses, refusals, out-of-range responses, and other non-responses were recoded as missing observations.
Table 3.1, below, presents the variables used in this study. Table 3.1. Variables Used in the Present Study
Variable Diabetes Prevention Program (DPP)
Arthritis Coping and Emotions Study (ACES)
National Health and Nutrition Examination Survey (NHANES) 2007-2008
Diabetes Diabetes diagnosis based on 2-hour oral glucose tolerance test
Self-report (“Has a doctor told you that you now have or have ever had diabetes or high blood sugar?”)
Glycosylated
Depression Beck Depression Inventory (21 items) (Beck, 1961)
Composite International Diagnostic Interview (CIDI) (Markush, 1973) and Center for Epidemiologic Studies – Depression scale (Radloff, 1977)
Patient Health
Questionnaire (9 items) (Kroenke & Spitzer, 2002; Kroenke et al., 2001; Spitzer et al., 1999) Social Support Social Provisions Scale (24 items)(Cutrona, 1987) Interpersonal Support Evaluation List (ISEL) (S. Cohen, Hoberman, H.M., 1983) (8 items), McArthur Studies on Successful Aging (L. F. Berkman, Seeman, T.E., Albert, M., Blazer, D., Kahn, R., Mohs, R., Finch, C., Schneider, E., Cotman, C., McClearn, G., 1993)
NHANES MacArthur Studies of Successful Aging and Social Network Index (20 items) (L. F. Berkman, Seeman, T.E., Albert, M., Blazer, D., Kahn, R., Mohs, R., Finch, C., Schneider, E., Cotman, C., McClearn, G., 1993) Inflammation Data too sparse Data too sparse C-reactive protein
Sex Male / Female Male / Female Male / Female
Ethnicity Caucasian / African American / Latino / Other
Caucasian / African American Caucasian / African American / Latino / Other
Education Quantitative, in years, dichotomized into high school or less versus some college
Quantitative, in years Categorical,
dichotomized into high school or less versus at least some college
BMI Categorical Quantitative Quantitative
Age Categorical Quantitative Quantitative
Smoking Categorical (never, former, current)
Categorical (never, former, current)
Categorical (never, former, current) Osteoarthritis
status
Not applicable Self-report of doctor’s diagnosis
Not applicable
Other
Fasting plasma glucose; quantitative
CHAPTER 4: THE DIABETES PREVENTION PROGRAM AND DPP OUTCOMES STUDY Methods Specific to DPP
About the Study
The Diabetes Prevention Program (DPP), supported by the National Institute of Diabetes and Digestive and Kidney Diseases (NIDDK), was a longitudinal, 27-center randomized controlled trial with five-year follow-up. The primary goal of DPP was to test the efficacy of each of three active interventions (intensive lifestyle, troglitazone, and metformin) as compared with placebo. Randomization began in 1996, and the parent study ended with a data lock in 2001 because of its success in demonstrating the effectiveness of a lifestyle intervention to prevent diabetes in a high-risk population.
All participants in the multiethnic sample were at high risk for diabetes due to high BMI
(>24kg/m2), a fasting plasma glucose of 5.3–6.9 mmol/L, and impaired glucose tolerance (DPPRG, 2000). If participants developed diabetes, they were allowed to continue with their intervention and were
followed. Individuals were excluded from DPP if they were taking high doses of antipsychotic medications or selective serotonin reuptake inhibitors (SSRIs).
Participants were randomly assigned to one of four experimental conditions: intensive lifestyle, metformin, troglitazone, or placebo control. Investigators discontinued the troglitazone arm of the study in 1998 due to medication toxicity but continued to follow the participants. The intensive lifestyle
intervention, known as the Lifestyle Balance program, aimed to achieve a minimum of 7% weight loss or weight maintenance by encouraging a healthy diet and exercise regimen, plus promoting peer support and engagement with a core curriculum for lifestyle modification. Conventional diet and exercise recommendations were made to all participants, including those in the placebo control group.
In Fall 2002, following a brief bridge and “washout” period in which placebo was discontinued, metformin was continued open-label, and all participants were offered a group-based lifestyle
The end of DPPOS Phase 1 was in 2008, and data used in the present study are only to that point. Annual and midyear study visits continued in Phase 1, and participants completed study questionnaires, medical history updates, medication use evaluations, and other assessments and had their physical measurements taken. The data analyzed here included baseline data from the start of the DPP intervention study and the most recent available outcome data from the DPPOS, 6 years after its inception in 2002, and 12 after first randomization of participants in 1996.
Measures
Dependent variable: Diabetes
For the DPP analyses, all incident cases of diabetes were type 2. DPP investigators tested participants for diabetes every six months (yearly and mid-year visits) using either fasting plasma glucose level (≥ 126 mg/dL) or 2-hour post-glucose challenge (≥ 200 mg/dL). Study investigators repeated the abnormal tests to bolster the reliability of the results. Ultimately, a dichotomous variable for diabetes diagnosis and an interval measure for time of diagnosis were compiled. Together, these terms became the dependent variable for the Cox proportional hazard regression models.
Independent variables Depressive symptoms
Social support
The DPP includes the Social Provisions Scale (Cutrona, 1987), a 24-item questionnaire with four-point Likert scale items ranging from “Strongly disagree” to “Strongly agree.” The Social Provisions Scale surveys six provisions critical to social relationships, identified by Weiss in 1974: guidance, reliable alliance, reassurance of worth, attachment, social integration, and opportunity for nurturance. In addition to providing scores on each of the subscales, answers to the items can be totaled to obtain a global measure of social support. It was administered during midyear visits, and, for the purposes of the present study, baseline data were used.
Demographic covariates Sex
Sex was a dichotomous (male/female) variable, with males designated as the comparison category.
Ethnicity
DPP featured individuals of Caucasian, African American, and Latino/a ethnicity. It also contained an “Other” category that included individuals of Asian, Pacific Islander, or American Indian heritage or of mixed ethnicity. A four-level, nominal variable was created for ethnicity data, with the Caucasian group being the reference.
Age
DPP data included age at baseline, broken into seven groups within one categorical (ordinal) variable to help preserve anonymity.
Income
Education
The DPP data featured a quantitative education variable in which respondents indicated the number of years of schooling they had completed. For the present study, a new, dichotomous education variable was constructed by dividing the data into those with a high school education or less and those with more than a high school education. Having some education after high school was used as the reference group.
Other covariates Smoking
Smoking status (current, former, or never) was used in the DPP analyses, given the association of smoking with diabetes (Clyde, Smith, Gariepy, & Schmitz, 2013) and depression (Bakhshaie et al., 2014; Ziedonis et al., 2008). A nominal, three-level categorical variable was constructed for smoking status based on habits reported at DPP baseline. “Never smoked” was the reference group and indicated individuals who had smoked less than 100 cigarettes during their lifetime. Participants who had smoked 100 or more cigarettes at any point during their lifetime were asked to describe themselves further as either “former smokers” or “current smokers.” It is not known how recently “former smokers” had stopped smoking.
Body mass index
Body mass index (BMI), a measure of obesity, was calculated from height and weight from all study participants, and baseline BMI was used as a control variable in these analyses. To preserve anonymity of participants, DPP investigators condensed BMI into an ordinal variable consisting of 10 categories, and this ordinal variable was treated quantitatively for analytical purposes. Each category consisted of approximately 2 kg/m2, and individuals with BMI above 45 kg/m2 were treated as one group. BMI less than 26 kg/m2 was the reference group used in the present analyses.
Fasting plasma glucose