The Use of Functional Data Analysis to
Evaluate Activity in a Spontaneous Model of
Degenerative Joint Disease Associated Pain in
Cats
Margaret E. Gruen1,2, Marcela Alfaro-Co´ rdoba3
, Andrea E. Thomson1, Alicia C. Worth1, Ana-Maria Staicu3*, B. Duncan X. Lascelles1,2,4
1 Comparative Pain Research Program, Department of Clinical Sciences, College of Veterinary Medicine,
North Carolina State University, Raleigh, North Carolina, United States of America, 2 Comparative Medicine Institute, North Carolina State University, Raleigh, North Carolina, United States of America, 3 Department of Statistics, North Carolina State University, Raleigh, North Carolina, United States of America, 4 Center for Pain Research and Innovation, University of North Carolina School of Dentistry, Chapel Hill, North Carolina, United States of America
Abstract
Introduction and objectives
Accelerometry is used as an objective measure of physical activity in humans and veterinary species. In cats, one important use of accelerometry is in the study of therapeutics designed to treat degenerative joint disease (DJD) associated pain, where it serves as the most widely applied objective outcome measure. These analyses have commonly used summary mea-sures, calculating the mean activity per-minute over days and comparing between treatment periods. While this technique has been effective, information about the pattern of activity in cats is lost. In this study, functional data analysis was applied to activity data from client-owned cats with (n = 83) and without (n = 15) DJD. Functional data analysis retains informa-tion about the pattern of activity over the 24-hour day, providing insight into activity over time. We hypothesized that 1) cats without DJD would have higher activity counts and inten-sity of activity than cats with DJD; 2) that activity counts and inteninten-sity of activity in cats with DJD would be inversely correlated with total radiographic DJD burden and total orthopedic pain score; and 3) that activity counts and intensity would have a different pattern on week-ends versus weekdays.
Results and conclusions
Results showed marked inter-cat variability in activity. Cats exhibited a bimodal pattern of activity with a sharp peak in the morning and broader peak in the evening. Results further showed that this pattern was different on weekends than weekdays, with the morning peak being shifted to the right (later). Cats with DJD showed different patterns of activity from cats without DJD, though activity and intensity were not always lower; instead both the peaks and troughs of activity were less extreme than those of the cats without DJD. Functional a1111111111 a1111111111 a1111111111 a1111111111 a1111111111 OPEN ACCESS
Citation: Gruen ME, Alfaro-Co´rdoba M, Thomson AE, Worth AC, Staicu A-M, Lascelles BDX (2017) The Use of Functional Data Analysis to Evaluate Activity in a Spontaneous Model of Degenerative Joint Disease Associated Pain in Cats. PLoS ONE 12(1): e0169576. doi:10.1371/journal. pone.0169576
Editor: Jaroslaw Harezlak, Indiana University, UNITED STATES
Received: June 8, 2016
Accepted: December 19, 2016
Published: January 18, 2017
Copyright:©2017 Gruen et al. This is an open access article distributed under the terms of the
Creative Commons Attribution License, which permits unrestricted use, distribution, and reproduction in any medium, provided the original author and source are credited.
Data Availability Statement: Data and code has been submitted to Dryad.com. The DOI is: doi:10. 5061/dryad.v1c16.
data analysis provides insight into the pattern of activity in cats, and an alternative method for analyzing accelerometry data that incorporates fluctuations in activity across the day.
Introduction
Physical activity is commonly affected in patients with degenerative joint diseases (DJD), and changes in activity may be used as an outcome measure for patients with arthritis and DJDs
[1–4]. Self-reported activity is often inadequate for quantifying actual physical activity [5], as
self-report is subject to biases due to recall and social desirability, and patients are likely to under- or over-estimate true activity. The advent of accelerometer based systems allows for objective assessment of activity, and these systems have allowed researchers to more specifi-cally define activity patterns, as well as track changes in activity related to health statuses and response to interventions.
‘Activity’ monitors (accelerometers) measure changes in acceleration by detecting low-fre-quency accelerations sampled at frequencies that vary by device but are often high sub-second frequencies. These changes in acceleration are recorded by the device and are converted to ‘counts’ for a given epoch length of seconds to minutes. The counts are unit-less, and are gen-erated by a voltage signal which is proportional to the individual unit’s measure (e.g. duration
and/or intensity) of change in acceleration [6]. That is, these counts will be higher with higher
magnitude of acceleration for a given epoch. Accelerometers may be classified by the number of axes in which they measure acceleration (uni-, bi-, or tri-axial), or may be omni-directional. These monitors have been evaluated in humans as measures of physical activity by comparison
of activity counts against oxygen consumption, measured via indirect calorimetry [7] or
dou-bly-labeled water.
There has been great interest in the ability to objectively measure physical activity since cor-relation coefficients between self-report and accelerometer-based measures are frequently low
[8]. In humans, accelerometer-based activity monitoring has been used to assess activity
dur-ing sleep [9], following stroke [10], and as a criterion for validation of physical activity survey/
assessment tools [11]. Population based epidemiologic studies have used accelerometry to
eval-uate physical activity in people with arthritis [3,12–14] while intervention studies have
quanti-fied effects of treatments on activity with some showing improvement [15] and others showing
more equivocal effects [16]. Analytical methods across studies have varied resulting in calls for
greater uniformity in the interpretation of accelerometer-based data [17,18].
The establishment of criteria for defining sedentary behavior and high-activity behavior has not been standardized. Activity counts per-minute have been used to determine whether an individual is moving or sedentary, and sustained high levels of activity counts used to indicate high-intensity activity, however different studies have employed cut-off levels that lead to dis-parate conclusions. The effects of varied cut-offs were examined in a modeling experiment
done by Masse et al. [18], where application of four algorithms for accelerometer-based data
reduction resulted in marked differences in outcomes. Additional issues include the mis-matches between the detection abilities of particular activity monitors in relation to the activity being studied (e.g. uni-axial, vertically sensitive accelerometers used to detect activity involved
in riding a bicycle) [19], differences in output when worn on the hip vs. the wrist [20], and
varying criteria for establishing length of wear. Frequently, algorithm based or visual inspec-tion of data is used to determine estimated wear time. Despite these limitainspec-tions, accelerometry remains the primary means of objective physical activity monitoring in patient populations.
design, data collection and analysis, decision to publish, or preparation of the manuscript.
In veterinary medicine, accelerometers have been used in studies involving many species.
In dogs [21] and in cats [22], accelerometry, with specific accelerometer types, has been
vali-dated in a lab environment as a surrogate measure of distance moved. In both dogs and cats, accelerometer outputs (counts) were compared against objectively assessed distance moved
using standardized software (Noldus1Ethovision) designed for quantification of behavior
[21,22]. Validation studies were followed with feasibility studies to evaluate the ability of dogs
and cats to tolerate wearing such monitors in their home environments. Interestingly, a study
in dogs found that activity counts were higher on weekends as opposed to weekdays [23],
while a study in cats found the opposite [22]. In the cat study, the subjects were
laboratory-housed cats, and the lower activity counts seen during the weekend were attributed to the lower amount of human/caretaker activity in the facility during those days. This suggests that owner patterns of activity are likely important mediators of activity in pet dogs and cats, and that activity patterns may not be uniform across the week.
The most common application of accelerometry in veterinary medicine has been the study of spontaneous activity in dogs and cats with DJD/osteoarthritis (DJD/OA). Several studies
have used accelerometers to measure activity in dogs [21,24] and cats [25–27]. Moreover,
both dogs [28] and cats with DJD/OA will show improvements in activity with analgesics, and
motor activity has been used as an important objective outcome measure for analgesic
treat-ments in cats with DJD/OA in multiple studies [25,29–32].
In addition, there is recent increased interest in domestic dogs and cats as models of
natu-rally-occurring DJDs in humans [33–35] as both species develop spontaneous disease with
sig-nificant overlapping features with the human condition [36–38] including mobility
impairment. Indoor cats, in particular, are intriguing as a model of spontaneous activity, as their daily activity is less confounded by human intervention (i.e. though influenced by human activity, their activity over the day is not dependent on whether or not they are taken for a walk). Thus far, the analysis of the activity data generated by accelerometers in cats has been fairly coarse and a better understanding of activity patterns or profiles, and the most useful approaches for analyzing activity data will benefit both our ability to interpret the effects of DJD/OA on activity in cats, and the applicability of this naturally-occurring model to transla-tional research.
To date, accelerometry has been used in cats to describe normal activity under different
feeding and housing conditions [39–41] and activity in response to weight management
strate-gies [42,43], in addition to the studies of analgesic treatments for DJD/OA and associated pain
[29–32]. Across these studies, statistical analyses of activity data have varied widely in method,
using a diversity of analytic designs generally based upon condensed data. Particularly in the drug intervention studies, cats may wear activity monitors for days to weeks. Considering that each 24-hour day may contain 1440 individual per-minute “counts,” these studies generate large volumes of data for analysis. Current analytic methods frequently collapse the data down to single summary values (e.g. total counts or average per-minute counts) for particular time spans, and information about the pattern of activity in cats is lost. Inter-cat variability in these summary measures, even within a housing condition, is high, making between group analyses difficult. This variability, coupled with a lack of knowledge of the most important metric to investigate, hinders the ability to fully understand the impact of disease and the effects of inter-ventions on cat activity.
Functional data analysis (FDA) provides methods for analyzing data that are believed to
arise from curves evaluated at a finite grid of points [44]. In particular, it allows for the use of
the entire profile of daily activity counts (over a 24-hour day), rather than summary values. As a result, FDA allows analysis of data patterns without losing the richness of the information
principal components analysis (FPCA), which examines the dominant modes of variation of
the data as a method for understanding the major sources of data variability [45]. Functional
data analysis has been applied to accelerometer data in recent studies of people [46–49], but to
our knowledge has not been applied in the field of pain research or with data gathered from veterinary species.
Application of FDA to accelerometer data from cats offers an opportunity to examine the pattern of activity in cats, including potential identification of peaks of activity and
quantifica-tion of the variability of activity, and the effects of covariates that vary over time [48]. FDA
allows activity data from cats to be represented in new ways than have previously been
described, and can aid in the detection of patterns or variations among the data [45] as well as
inform decisions about the use of such data in evaluating therapeutics.
The objectives of this study were to use FDA to evaluate activity patterns and activity inten-sity in cats with and without DJD in order to better understand normal population distribu-tions for each group. We hypothesized that 1) normal cats would have higher daily activity counts and intensity than cats with DJD; 2) daily activity counts and intensity in cats with DJD would be inversely correlated with total radiographic DJD burden and total orthopedic pain score; and 3) daily activity counts and intensity would have a different pattern on weekends vs. weekdays. To our knowledge, no studies have been published that examine activity patterns in well phenotyped cats (with and without DJD) in their home setting.
Materials and Methods
Subjects
Potential study subjects were identified from local primary care veterinarians or were self-referred by owners in response to advertisements for one of four clinical trials. The first trial was designed to investigate activity in normal cats (i.e. those without DJD) (previously
unpub-lished data). Two other trials included in the exploratory analyses [25,30] were designed to
evaluate outcome measures and efficacy for a non-steroidal anti-inflammatory medication in cats with DJD and owner-rated mobility impairment. All trials were carried out with approval by the North Carolina State University College of Veterinary Medicine’s Institutional Animal Care and Use Committee (Protocols 11-102-O, 08-124-O).
Inclusion and exclusion criteria
Inclusion criteria for the normal cat study included age over one year, weight over one kilo-gram (kg), and the absence of owner-rated mobility impairment. Inclusion criteria for the
intervention trials have been previously described [25,30,50]. Briefly, cats were required to be
greater than one year of age and weigh more than one kg, and to have a qualifying degree of owner-rated mobility impairment, joint pain on orthopedic examination, and radiographic evidence of DJD.
Exclusion criteria, common across trials, have been described previously [25,30,50] and
included the presence of suspected or diagnosed infectious diseases, symptomatic cardiac dis-ease, immune-mediated disdis-ease, neoplasia, inflammatory bowel disdis-ease, urinary tract infection, hyperthyroidism, and diabetes mellitus. Cats with stable chronic kidney disease (CKD) up to
and including IRIS stage two [51] were eligible to enroll following demonstration of stable
serum biochemistry and urinalysis results. Importantly, all cats were required to be indoor only and able to wear a collar, though they did not need to have a collar at the time of enrollment.
Recruited cats were examined by a veterinarian and received full physical, orthopedic, and neurologic examinations. Demographic data including age, weight (kg), and body condition
sedated, and orthogonal radiographs were made of each joint. Radiographs were reviewed for
the presence of DJD/OA as described in [53] by a board-certified veterinary radiologist
masked to the results of the orthopedic examination.
Total pain scores
During the orthopedic examination, each joint and axial skeletal segment was palpated and manipulated to evaluate for signs of pain and instability. Responses for each joint or segment
were scored using a previously published scale [53] where 0 = no resentment; 1 = mild
with-drawal, mild resistance to manipulation; 2 = moderate withwith-drawal, body tenses, may orient to site, may vocalize/increase vocalization; 3 = orients to site, forcible withdrawal from manipula-tion, may vocalize or hiss or bite; 4 = tries to escape or prevent manipulamanipula-tion, bites or hisses, marked guarding of area. The scores for each individual joint or axial skeletal segment were summed to generate a total pain (TPain) score for each cat (possible range: 0–80). Based on
scores from a previously described study of the prevalence of DJD in cats [53], TPain scores
were further categorized as 0–2 = negligible/normal (as long as no single joint received a score of 2); 2–4 = low (a score of 2 was placed in this category if a single joint received a score of 2);
5–9 = moderate;10 = high.
Total DJD scores
Radiographs were evaluated and scored as previously described [53]. Briefly, each joint was
evaluated for the presence and severity of radiographic changes indicative of DJD and scored on a scale from 0 (normal) to 10 (ankylosis) by a single investigator (BDXL). The scores for each individual joint or axial skeletal segment were summed to generate a total DJD (TDJD) score for each cat (possible range: 0–200). Again based on scores from the previously described
study [53], TDJD scores were further categorized as 0–3 = negligible/normal; 4–12 = low; 13–
24 = moderate;25 = high.
Activity monitors
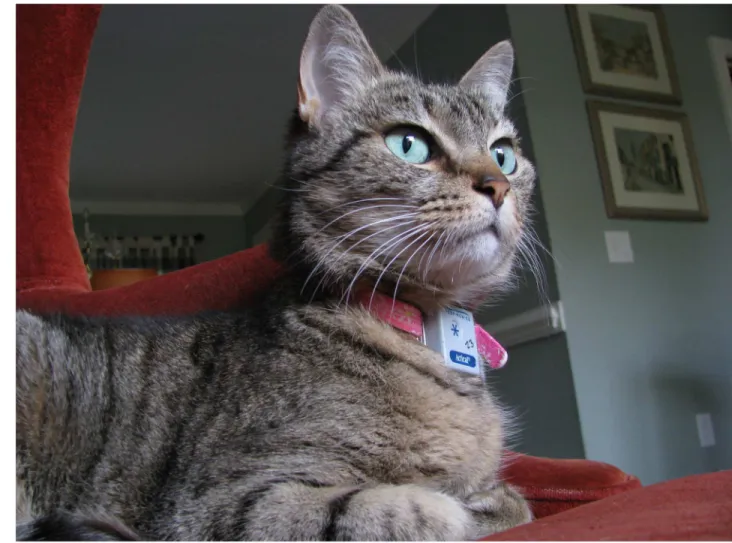
Following enrollment, all cats in each study were fitted with an activity monitor (Actical1,
Philips Respironics, Bend, Oregon, USA) mounted on a neck collar (Fig 1). Collars were
pro-vided by the study if the cats did not have their own. The Actical1monitors are
omni-direc-tional activity monitors that contain a piezoelectric sensor mounted to an internal circuit board to generate analog voltage change that is proportional to the duration and intensity of
the change in acceleration [6]. The Actical1monitors have a sampling rate of 32 Hz, and
report data (“counts”) for specified epoch lengths ranging from 15 seconds to one minute. Epoch length for summary data output by the units in these studies were set to 1 minute, and the collars were worn continuously throughout the study period, with the exception of peri-odic downloading. Each daily activity profile is thus composed of 1440 minute-by-minute measurements. Activity data were downloaded to a dedicated computer via a serial port reader
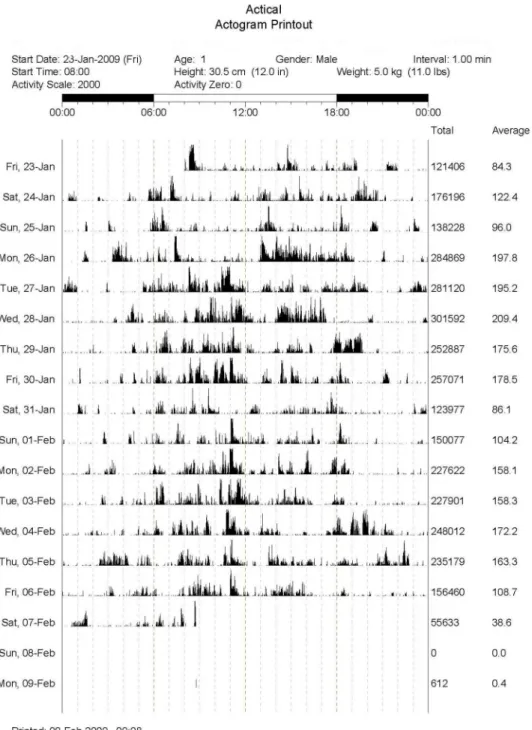
(Actireader1) using designated software. The software generates a graphical representation of
the activity over each day (Fig 2) as well as a ‘raw’ output of activity counts per-minute that
Statistical analysis
Data disclosure. Portions of the data used for this manuscript have been previously
pub-lished, however the current use and analysis represent original work. The activity data for the cats with DJD have appeared in two separate publications using a very simplistic approach to analysis [25,30].
Data sets. The normal cat data set included cats that had no owner-noted mobility
impairment, normal classifications for TDJD score and TPain score, and comprised data from n = 15 cats. Cats in the DJD data set had a combination of owner-noted mobility impairment and abnormal TDJD and TPain scores (n = 83). These cats represent populations from two individual studies referred to by their in-house names as FMPI (n = 25) and Low-Dose (n = 58).
Data analysis. Prior to the current FDA-based approaches, descriptive statistics were
gen-erated for demographic information for the cats, and compared using one-way ANOVA for continuous variables (age, BCS, TPain score and TDJD score) and Chi-squared testing for dis-tribution of cat gender.
As activity counts were highly skewed, data were transformed using the equation
x !ln(1 +x) and then averaged in each 5-minute interval to decrease variability [46]. For
convenience, in the remainder of the paper we refer to the transformed data over the
5-min-ute intervals as activity counts. For all analyses, significance level was set atα= 0.05; when
multiple tests were performed on the same data subset, a Bonferroni correction was applied
asα= 0.05/(k) wherekis the number of tests, and the adjusted p-value reported. Average
activity was calculated for each group of cats and denoted asYGi(t)for the activity of catiin
Fig 2. Example of an actigram for a cat. Each row of data contains the activity counts for a single day, with
the counts depicted graphically along the time axis from 00:00 (12:00am) to 23:59 (11:59pm). The final two columns for each row represent the total activity counts for the day, and the average per-minute counts for the day.
groupG. Further, a measure of intensity of activity was generated to control for a cat- or
accelerometer-specific effect and referred to asIGi(t), for the intensity of activity of catiin
groupG. Intensity provides a sense of the cat’s activity relative to its average activity, with
higher intensity interpreted as more active than average. It was calculated using a cat’s
aver-age activity over the last seven days of the baseline period (AveYGi)with the following
equa-tion:
IG
iðtÞ ¼ YGiðtÞ AveðYGiÞ;
whereAveYGiis the average across all seven days
Evaluation and comparison of activity profiles for normal cats and cats with DJD. We
first needed to determine separation or pooling of data for weekend and weekday activity, and for the two groups of DJD cats. To characterize activity patterns in cats with and without DJD, average activity and intensity profiles were separated for weekends (Saturday and Sun-day) and weekdays (Monday through FriSun-day) within each group of cats. Likelihood ratio
test-ing [54] was used to formally assess first whether weekend and weekday activity and
intensity profiles were different for each group of cats, and second whether the activity and intensity profiles were different for the two groups of DJD cats (FMPI and Low-dose). For both the activity and intensity profiles of the two groups of DJD cats, the null hypothesis of no difference between the two groups’ means for weekends and weekdays was formally investigated in four main settings (where Bonferroni correction was applied): 1) no
covari-ates; 2) controlling for age, BCS, and their interaction (ageBCS); 3) controlling for age, BCS,
ageBCS interaction, and TPain score; and 4) controlling for age, BCS, ageBCS interaction,
and TDJD score. Null distributions were based on N = 10,000 simulations. Further, we for-mally assessed whether the population distributions of activity and intensity profiles for the two groups of DJD cats were the same using the Anderson-Darling testing procedure
pro-posed by Pomann et al. [55]. Results are discussed in the results section; they were supportive
of separating weekend and weekday activity and pooling data from the two groups of cats with DJD into one DJD group.
To describe the main features of the average activity and intensity profiles of the cats, func-tional principal components analysis (FPCA) was performed for both the Normal cats and the combined group of cats with DJD (DJD group), separately for weekends and weekdays, with the following formula:
YiðtÞ ¼ mðtÞ þ
X
k
kðtÞxikþit
whereμ(t)is the mean at each time point,ϕk(t)is thekeigenfunction, andξikare the scores for
thekcomponent andisubject. To better understand the relationship between weekends and
weekdays for each principal component, correlations were generated on the estimated scores
for each of thekprincipal components.
Finally, to formally assess the effects of age, BCS, TDJD score, and TPain score on activity profiles and intensity profiles, we used functional regression models for the Normal and DJD groups separately for weekends and weekdays. Specifically, the assumed models for each
response can be written for each group as specified in Faraway [56] and computed using
Scheipl et al. [57] methods as follows:
Model 1: Normal cats
Model 2: DJD cats (where TDJD and TPain scores were included)
YiðtÞ ¼b0ðtÞ þ Ageib1ðtÞ þ BCSib2ðtÞ þ ðAgeBCSÞib3ðtÞ
þ TDJDib4ðtÞ þ TPainib5ðtÞ þ iðtÞ
whereβ0(t)is the intercept,β1(t)is the time-varying effect of age,β2(t)is the time-varying effect
of BCS,β3(t)is the time-varying effect of the interaction between age and BCS,β4(t)is the
time-varying effect of DJD score andβ5(t)is the time varying effect of Pain score. Each
covari-ate was standardized, and the coefficientsβ0(t),β1(t),β2(t) andβ3(t)were modeled using
penal-ized splines. Herei(t)denotes the normal residual term, assumed to be independent, centered
in zero with varianceσ2and identically distributed.
Finally, we compared the Normal group with the DJD group using both the daily activity and intensity profiles, separately for weekends and weekdays. Average activity profiles and intensity profiles for Normal cats and those with DJD were compared using the same analysis approach outlined for comparing the two groups of DJD cats for both group means and popu-lation distributions. Group means were formally investigated in the same four main settings, with and without covariates.
Statistical analysis was performed using the computing environment R (R Core Team, 2016). The code and data to perform each of the tests mentioned in this paper are available for download.
Results
Descriptive statistics for the cats in each group are presented inTable 1. Cats in the Normal
group were significantly younger and, as expected, had lower TDJD and TPain scores than cats in the FMPI and Low-dose groups. Cats in the FMPI and Low-dose groups were not sig-nificantly different for any of these variables.
Prior to transformation, range, quartiles, mean, and median average per-minute activity
(across the 7 days) were calculated (Table 2). The range of activity counts for the normal cats is
smaller than for the cats with DJD, however the mean average per-minute activity for each group is not significantly different (One way ANOVA, p = 0.541).
Table 1. Demographic distribution for cats included in each of the studies. Results within a category that are designated by the same letter were not
sig-nificantly different from one another.
Study Mean Age
(years)
Median Body Condition Score (1–9)
Sex (MC/FS) Mean TDJD score (possible
range:0–200)
Mean TPain score (possible range:0–80)
Normal cat (n = 15)
5.80—A 5 9/6 3.07—A 1.3—A
FMPI (n = 25) 11.77—B 7 8/17 20.0—B 14.0—B
Low-dose (n = 58) 12.4—B 6 27/31 23.4—B 16.4 –B,C
Between group analysis
ANOVA: p<0.001
Wilcoxon test: p = 0.060 Likelihood ratio: p = 0.360
ANOVA: p<0.0001 ANOVA: p<0.0001
doi:10.1371/journal.pone.0169576.t001
Table 2. Pre-transformation range, quartiles, median, and mean of average per-minute activity counts across the 7 day period for each group of cats.
Group Minimum 1stQuartile Median Mean 3rdQuartile Maximum
Normal 20.61 25.02 31.38 35.98 42.12 72.04
FMPI 11.44 22.09 30.87 39.70 54.92 105.70
Low-dose 8.22 21.31 31.42 34.97 41.05 108.00
Evaluation of activity profiles for normal cats
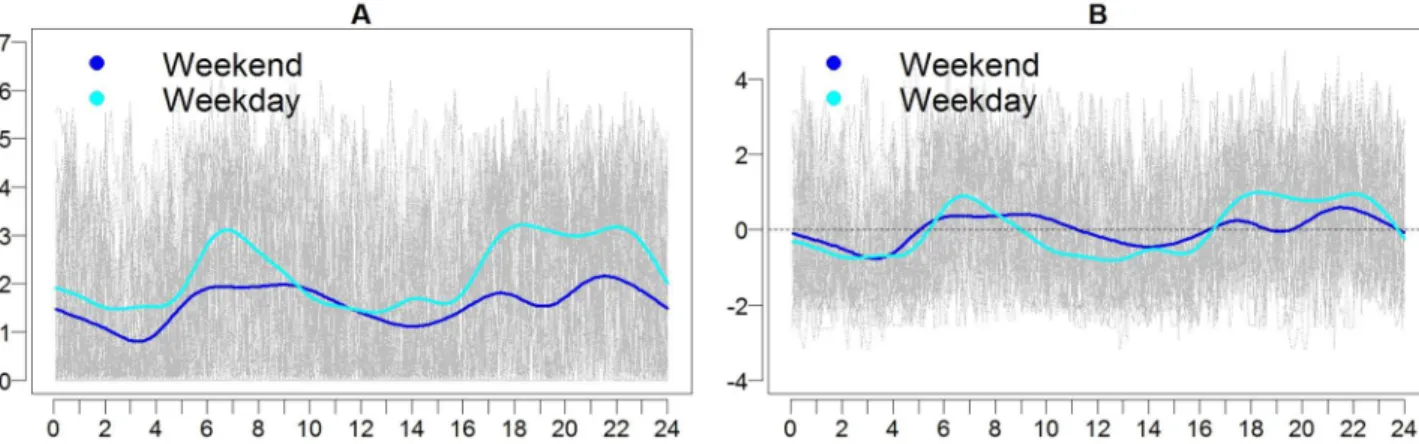
Fig 3depicts the average activity and intensity profiles for weekdays and weekends for the
Nor-mal cats. The times where the intensity is positive may be interpreted as times when the activ-ity is greater than typical activactiv-ity. Cats show a bimodal pattern of activactiv-ity with a trough during the hours between approximately 2:00 am and 5:00 am. During the weekdays, the activity peaks occur in the morning between approximately 5:30 am and 9:00 am and in the evening between 17:00 (5:00 pm) and 23:00 (11:00 pm). This pattern is present but less well-defined on weekends, with the morning peak less extreme and shifted to the right. Likelihood ratio testing for activity and intensity tested the null hypothesis that mean weekend and weekday average
activity and intensity were the same and obtained p-values of<0.0001 for each, indicating a
statistically significant difference between weekends and weekdays for means of average activ-ity and intensactiv-ity profiles.
Evaluation of activity profiles for DJD cats
The two sets of data from cats with DJD (FMPI and Low-dose studies) were evaluated for a dif-ference in activity and intensity profiles prior to pooling. The test for a difdif-ference in the distri-butions showed no significant difference for the weekends (p = 0.114) or the weekdays
(p = 0.139). Activity and intensity profiles from the two groups are shown inS1 Fig. Bonferroni
corrected results of likelihood ratio tests showed no significant differences between the two sets of cats in models that included no covariates (p = 0.790 for activity and p = 0.986 for inten-sity), or controlled for age, BCS, the interaction between age and BCS, TPain score, and TDJD
score (all p-values>0.050 for both activity and intensity). Given the lack of evidence of a
dif-ference between the groups for activity and intensity profiles, the two groups were pooled. Following pooling of the data, and as with the Normal group of cats, average activity and
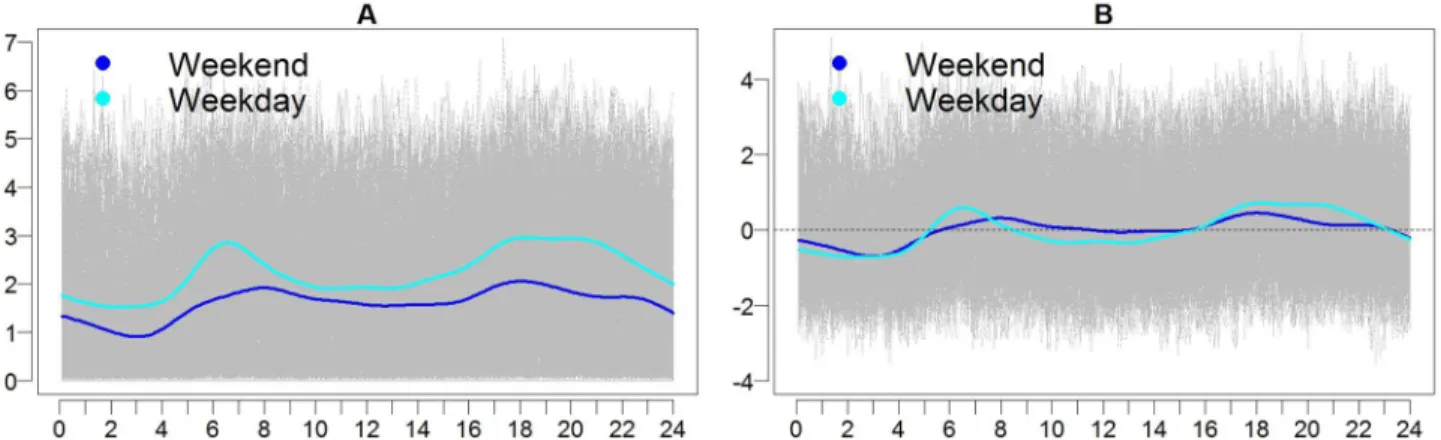
intensity profiles for DJD cats for weekends and weekdays were generated (Fig 4). Again, the
bimodal pattern of activity was noted, with peaks in activity and intensity evident in the morn-ing from approximately 5:00 am to 8:30 am, and evenmorn-ing from approximately 16:00 (4:00 pm) to 23:00 (11:00 pm). This was particularly apparent during weekdays and to a lesser extent dur-ing the weekends. Likelihood ratio tests for activity and intensity tested the null hypothesis that mean weekend and weekday average activity and intensity were the same, and obtained
p-Fig 3. Activity (A) and intensity (B) profiles for cats in the Normal group. Log transformed activity for all cats is shown in gray with time
(in hours) along the horizontal axis. The group mean for activity and intensity are shown for the weekends (dark blue) and weekdays (light blue). For intensity, positive values (above the zero line) indicate activity that is higher than average for that time period, while negative values (below the zero line) indicate activity that is lower than average.
values of<0.001 for each, indicating a difference between weekends and weekdays for means of average activity and intensity.
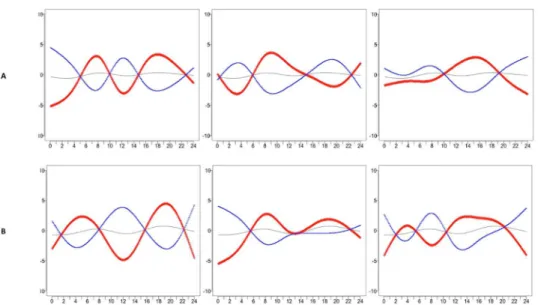
As weekend and weekday profiles have different distributions, FPCA was performed sepa-rately for weekend and weekday data, and results are presented here for intensity profiles for
the Normal group and DJD group. The top three eigenfunctions are shown inS2andS3Figs.
Figs5and6display the variation about the estimated mean corresponding to each direction:
^ mðtÞ 2
ffiffiffiffiffi
^ lk
q
^
kðtÞ, wherel^kis the estimated eigenvalue for each of the top three
eigenfunc-tionsϕk(t),for the Normal group and DJD group, respectively.
For the Normal group, the three components explain approximately 77% and 86% of the total variance for weekend and weekday intensity, respectively. Correlations between the scores
Fig 4. Activity (A) and intensity (B) profiles for cats in the DJD group. Log transformed activity for all cats is shown in gray with time (in
hours) along the horizontal axis. The group means for activity and intensity are shown for weekends (dark blue) and weekdays (light blue). doi:10.1371/journal.pone.0169576.g004
Fig 5. FPCA for Intensity for the Normal cats for weekends (A) and weekdays (B). Hours of the day are
shown across the horizontal axis. Variance about the mean that corresponds to each FPC is shown for weekends and weekdays with red (pluses) indicating the positive direction and blue (minuses) indicating the negative direction. Variance explained by each FPC: Weekends: 35.88%, 24.44%, 16.83%. Weekdays: 40.01%, 23.86%, 21.77%.
for weekends and weekdays were 0.77 for FPC1, 0.53 for FPC2, and 0.64 for FPC3. For both weekends and weekdays, the variance about the mean for FPC1 shows a sign change at the beginning and end of each peak, while FPC3 shows an important peak during the evening on the weekdays that is shifted earlier on weekends. Cats that are positively loaded on FPC1 show similar behavior on weekends and weekdays during the period from midnight to 6:00 am, but different behavior on weekends and weekdays during the period from noon to midnight.
For the DJD group, the three components explain approximately 73% and 77% of the total variance for weekend and weekday intensity, respectively. Correlations between the scores for weekends and weekdays were 0.38 for FPC1, 0.41 for FPC2, and 0.49 for FPC3. For both week-ends and weekdays, the variance about the mean for FPC1 shows a sign change at the begin-ning and end of each peak. Cats that are positively loaded on FPC1 have lower than average activity during early mornings on weekdays, higher than average activity between 10:00 and 15:00 (3:00 pm), and lower again after 15:00 (3:00 pm), while a different pattern is seen for weekends. FPC2 and FPC3 also show different patterns for weekends and weekdays, particu-larly between 15:00 (3:00 pm) and midnight for PFC2 and midnight to 8:00 am for FPC3.
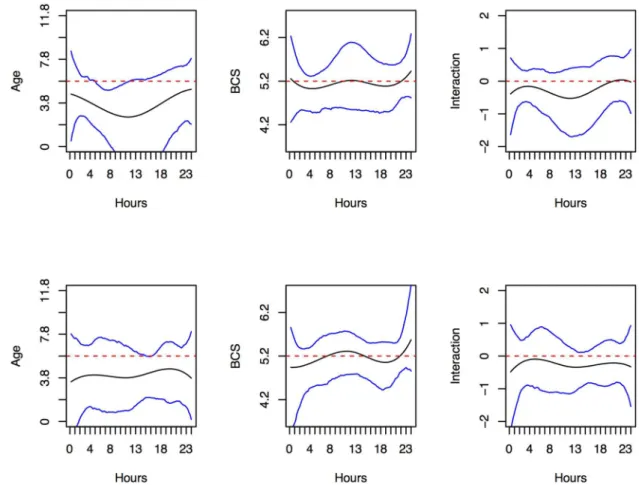
Results of functional regression analysis evaluating the effects of age and BCS on activity
and intensity profiles for weekends and weekdays in the Normal group are shown inFig 7
(activity) andS4 Fig(intensity). Specifically, each panel depicts the estimated effect of age, BCS
and their interaction in the solid line, as well as their 95% point-wise confidence intervals (CIs) constructed using bootstrap methods (N = 2000). Results are significant when the bounds of both CIs are above or below zero; no significant effects were found for intensity pro-files for weekends or weekdays. For activity propro-files, age, was significantly associated, though the pattern differed over time. Older cats were more likely to be less active in the mornings on weekends, and the afternoons on weekdays.
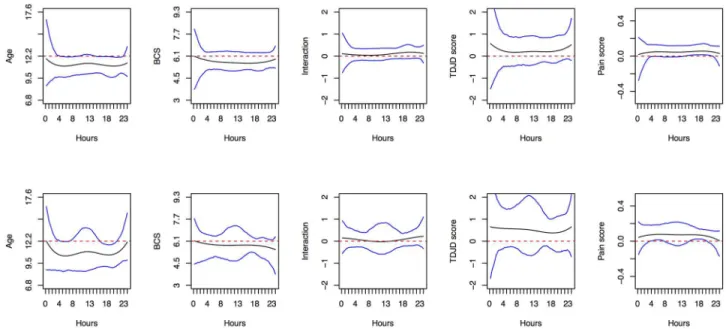
Results of functional regression analysis evaluating the effects of age, BCS, TDJD score, and TPain score on activity and intensity for weekends and weekdays in the DJD cats are shown in
Fig 8(activity) andS5 Fig(intensity). Specifically, each panel depicts the estimated effect of
Fig 6. FPCA for Intensity for the DJD cats for weekends (A) and weekdays (B). Variance about the mean
corresponding to each FPC is shown for weekends and weekdays with red (pluses) indicating the positive direction and blue (minuses) indicating the negative direction. Variance explained by each FPC: Weekends: 33.99%, 21.80%, 16.67%. Weekdays: 36.93%, 20.16%, 18.58%.
age, BCS and their interaction, TDJD score, and TPain score in solid line, as well as their 95% point-wise CIs constructed using bootstrap methods. Again, results are significant when the bounds of both CIs are above or below zero; no significant effects were found for intensity for weekends or weekdays. For activity profiles, age and pain score were significantly associated, though the pattern differed over time. During the morning and afternoon peaks, older cats were more likely to be less active on both weekends and weekdays. However, cats with higher TPain score were more likely to be more active during the daytime hours on both weekends and weekdays.
Comparison of activity profiles between normal cats and those with DJD
Likelihood ratio tests were used to assess the null hypothesis that activity profiles during week-ends and weekdays were the same between the Normal cats and those in the DJD group. Sepa-rate tests were run with no covariates and controlling for covariates; p-values for results are
summarized inTable 3and show a difference in intensity profile between Normal cats and
those with DJD during the weekdays, and a difference in activity profile between Normal cats and those with DJD on the weekends when controlling for covariates. The results indicate dif-ferent mean intensity during weekdays for the two groups; for the other group comparisons, the differences in the way the responses vary seem to be more complex.
Fig 7. Functional regression analysis for activity in the Normal group. Depicted are the smooth effects of Age (in
years, left panels), BCS (middle panels) and AGE*BCS (standard deviations away from the mean, right panels) on the activity of Normal cats, when model (1) is assumed. Results are shown for weekends in the top row and weekdays in the bottom row, with functional coefficients in black, 95% confidence intervals in blue, and zero demarcated in red.
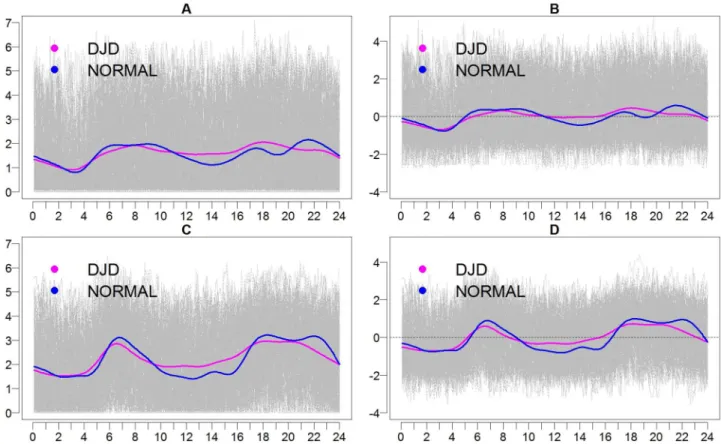
Finally, we investigated whether the way the activity varies (the population distributions) is the same in Normal cats and DJD cats; for this we used the functional Anderson-Darling
test-ing procedure of Pomann et al. [55]. We found significant evidence against this null hypothesis
for both weekends (p = 0.013) and weekdays (p = 0.010). The same null hypothesis was
investi-gated for intensity and the results were also significant for both weekends (p<0.010) and
week-days (p<0.010) Based on these findings we conclude that the Normal cats and DJD cats show
different levels of activity both during the weekends and weekdays, and also show different intensity of activity. This test indicates that the distributions are different, without providing
information on how they are different. Visual inspection of the mean functions (Fig 9) shows
that they cross each other at various times of the day, with the Normal cats having more vari-able activity and intensity, while the activity and intensity profile of the cats with DJD appears muted across the day.
Discussion
In this study, FDA methods were used to examine the pattern of activity and intensity in cats with and without DJD. This represents a novel method of analysis, one that allows for further
Fig 8. Functional regression analysis for activity in the DJD group. Depicted are the smooth effects of Age (in years), BCS, AGE*BCS (standard deviations away from the mean), standardized TDJD score and TPain score on the activity of DJD cats, when model (2) is assumed. Results are shown for weekends in the top row and weekdays in the bottom row, with functional coefficients in black, 95% confidence intervals in blue, and zero demarcated in red.
doi:10.1371/journal.pone.0169576.g008
Table 3. Results of likelihood ratio tests for weekend and weekday activity profiles and intensity profiles when comparing Normal and DJD cats.
Models were tested both with and without covariates. Values in bold are significant after adjustment for multiple comparisons using Bonferroni correction for each data set (row).
No covariates Age, BCS, Age*BCS interaction Age, BCS, Age*BCS interaction, and TDJD score
Age, BCS, Age*BCS interaction, TPain score
Weekend activity profile 0.6648 <0.0001 <0.0001 0.0320
Weekend intensity profile 0.9098 0.9900 0.9900 0.9999
Weekday activity profile 0.9999 0.0292 0.0880 0.6736
Weekday intensity profile <0.0001 <0.0001 <0.0001 <0.0001
understanding of spontaneous activity profiles in cats, and how age, pain, and radiographic DJD affect activity profiles across the day. This understanding is critical to our ability to use activity as an effective objective outcome measure, both for monitoring an individual cat longi-tudinally, but also in response to a therapeutic intervention. As cats represent a spontaneous model of naturally-occurring DJD, further understanding of activity can expand our ability to investigate treatment options that may be of benefit to humans as well as cats. Through FDA, we now understand how DJD-associated pain alters the spontaneous activity profile, and points the way forward to how to assess the effects of analgesic treatments in a sophisticated and elegant manner, rather than looking at a coarse summary variable such as mean activity per-minute across a unit time period.
Using a group of normal cats, without DJD and associated pain, as well as cats with varying degrees of DJD, this study identified significant differences between the activity pattern of cats during the weekdays and weekends. These differences are important as they highlight a point raised by Piccione et al. regarding the influence of human activity on the activity pattern of
cats [39,40]. Cats are generally defined as diurnal or crepuscular, with peaks of activity at
dawn and dusk [58,59], a pattern that matches the bimodal pattern seen in this study.
How-ever, cats may readily adapt to different housing conditions. In an intriguing study done in 2013, Piccione et al. showed that cats that are kept outdoors overnight have a strikingly differ-ent pattern of activity, and an increase in overall activity, compared to cats that are kept
indoors overnight [40]. The authors of that study proposed that human activity was the major
influencing factor on the pattern of cat activity for cats housed exclusively indoors. The current
Fig 9. Activity (A and C) and intensity (B and D) profiles for cats in the Normal group (blue) and those with DJD (pink). Log
transformed activity for all cats is shown in gray with time (in hours) along the horizontal axis. The group mean for activity and intensity are shown for weekends (A&B, respectively) and weekdays (C&D, respectively).
study supports and extends these findings by showing that activity on weekends, when owners typically have an altered schedule, is different from weekdays. Here, the weekend activity across all groups of cats had more muted peaks, with the morning peak shifted to the right (later), suggesting that the morning activity began later on weekends. This could be explained by a strong influence of owner activity on cat activity. As owners are more likely to wake up and begin daily routines at more variable times on weekends, each cat’s peak of activity would be less uniformly distributed, contributing to the flattening of the peak. However, on week-days, where owners are more likely to get up earlier and leave the house at more uniform times, activity related to caretaking (feeding, medication, play, etc.) is more likely to be con-centrated in the morning. This may be less uniform in the evening, as owners return home at different times and may interact with their cat in a variety of ways over the hours between returning home and retiring to bed. This is supported by the narrower peak seen in the morn-ing and the broader evenmorn-ing peak seen on weekdays. For the cats in these studies, demographic information collected from owners quantified how many hours owners were away from home, but not the details of when those hours occurred, making it difficult to explore whether there was a difference in the distribution of activity for cats whose owners were out of the home dur-ing workdur-ing hours versus those that were not. Work is currently underway to explore this rela-tionship by having a cohort of cats wear activity monitors while owners detail their times in and out of the home, as well as their interactions with their cats around food, play, and social interactions. While this should be further explored in studies that account for owner schedules, it suggests that when using activity data from cats, the number of weekend and weekdays should be standardized across data sets. This has also been suggested by studies in humans
[60] and dogs [23].
The differential effect of weekdays and weekends on activity is particularly important to
account for when evaluating treatment response. One study performed in laboratory cats [29]
selected nighttime activity on weekends in order to decrease the effect of the human caretakers on spontaneous activity, thus attempting to focus on the activity modulating effects of the anal-gesic drugs being administered. This approach is interesting, and certainly decreases variability as cat and caretaker interaction can differ, but may underestimate the potential effect of the analgesic to increase activity in response to human interaction. If cat activity is heavily influ-enced by human activity, then hypothetically, analgesic treatment could lead to increased interest in interactions and thus increased activity.
In addition to the differences in activity profiles over weekends and weekdays, activity pro-files and intensity propro-files are different between Normal cats and those with DJD. However, it is not as simple as finding that the activity and intensity are consistently higher for the Normal cats as opposed to those with DJD. Indeed, a direct comparison of mean activity counts per minute in Normal cats versus cats with DJD showed no difference in activity. Nevertheless, when using FDA to evaluate activity patterns, we found that cats with DJD appear to have higher activity and intensity of activity at some times during the day, while the height of their peaks appears flattened compared to the Normal cats at other times. Overall, the variation in activity over the day appears to be muted, with lower peaks and less deep troughs, in cats with DJD compared to Normal cats. Cats typically experience bouts of activity in spurts rather than sustained trotting or running as might be seen in dogs. It is possible that the height of the peaks for the Normal cats represents relatively more of these bursts of activity, so that what may be important is the height and number of the peaks. In humans, age has been associated with an increase in low-intensity activity at the expense of intensity activity, with high-intensity physical training in older persons resulting in a compensatory decrease in
low-inten-sity activity [61]. As age is associated with chronic pain, this compensatory relationship may
Cats experiencing joint-related pain may show a similar decrease in the number of spurts of activity, while maintaining a more consistent level of low-intensity activity. Pain-induced rest-lessness could contribute to this low-intensity activity, and this deserves further investigation. While work has been done in dogs to establish cut-points for distinguishing intensity of
activ-ity [62], such work has not been done in cats. Age has previously been shown to be associated
with decreased activity in both cats and dogs [23], and cut-points in accelerometer counts for
defining intensity of activity may need to reflect changes in baseline activity that occur with age. In the present study, functional regression showed that in the DJD groups, older cats were more likely to be less active across the majority of the day on both weekends and weekdays, but specifically in the morning and afternoon. Also in the DJD groups, cats with higher pain scores on orthopedic exam were more likely to show increased activity during the morning and afternoon. The reason for this is unknown, but may be related to the incongruency between pain on veterinary orthopedic exam and decreased mobility/activity in the home. Results from the FPCA suggest that morning and evening peaks (the mean behavioral pattern) account for the majority of variability. The first dominant mode of variation for both Normal and DJD cats represents the morning and evening peaks as having a different pattern of varia-tion from the rest of the day (during weekdays). This variavaria-tion pattern explains almost half of the total variance (approximately 40% for each). While the FPCs for weekends and weekdays are not controlled for cats (i.e. cats may be loaded positively on FPC1 for weekends and nega-tively loaded for FPC1 on weekdays), their scores are posinega-tively correlated indicating that if a cat is positively loaded on a component for the weekend, they are likely to be positively loaded on that component for weekdays.
Additional areas of interest in understanding activity patterns in cats include 1) defining “normal” activity for a cat of a given age or health status, as this would be valuable for deter-mining an individual’s status relative to a population norm for their age, and 2) being able to use baseline activity to stratify cats for randomization in clinical trials. Prior to log transforma-tion of the data, ranges, means, and medians of average per-minute activity across the period were generated, and showed similarity between the means and medians for all groups of cats. While FDA showed that the mean activity profile over the day was different at times, it would not be possible to classify a cat as normal or abnormal based only on their activity counts. Therefore, the first goal does not appear possible; cats show variability in activity independent of DJD and pain, similar to variability seen in people, though additional studies with larger numbers of cats should be performed. However, using the median average per-minute activity, the second goal is potentially achievable. In general, studies of therapeutic interventions for
DJD have randomized or stratified based on an owner rating [30] or radiographic DJD [29],
and then used activity as the objective outcome measure. Median per-minute activity could be used as a variable for randomization to a clinical study group, or even as an entry criterion for early clinical studies, assuming that lower median activity indicates pain-related decrease in activity.
Limitations and future work
(and associated pain) as prevalence of radiographic DJD in cats has been estimated at 60–92%
of cats, with increased prevalence associated with age [63,64]. The current study required cats
that were classified as Normal to have minimal to no radiographic evidence of DJD. As
radio-graphic disease does not correlate perfectly with the presence of pain [65], this study further
required that cats defined as Normal have minimal to no pain on orthopedic exam. This quali-fication was required as it is not yet known what degree of pain on orthopedic exam or radio-graphic DJD corresponds to clinically relevant pain or mobility impairment. Indeed, a study
by Guillot et al. [29] included a group of cats classified as having abnormal orthopedic exam
findings but no radiographic evidence of OA, and these cats were not impaired on peak verti-cal force, a measure generally considered more sensitive than simple observation, suggesting that pain on orthopedic exam may not translate to clinical signs of impairment. Given the dis-crepancies between the groups of cats, future work to understand activity patterns in cats should use a randomly selected group of cats of varying ages and phenotype them following the collection of activity data. This would allow better understanding of whether there is a breakpoint for pain on exam or radiographic DJD that predicts lower activity.
Still, given the dichotomy of the two populations used in this study, it is even more striking that the activity patterns were not more distinct between the Normal and DJD cats. In cats, as in dogs and people, there exists a wide variation of activity levels. For clinical trials, it may be possible to randomize cats based on baseline activity, but the inter-cat variability and generally small number of cats enrolled in clinical trials suggest that cats will continue to need to be eval-uated as their own controls for intervention trials. In this study, the Normal cats had a more restricted range of per-minute activity than any of the other groups of cats, but this could be due to the smaller number of cats in this group, and expansion of this group could show a wider range of per-minute activity, though frequently smaller numbers are associated with greater variability. While all activity monitors were worn in the same manner, mounted on a neck collar, the same set of activity monitors was not necessarily used in each study. While
lab-oratory based validity calibration has been performed for activity monitors in cats [22],
reli-ability calibration is not routinely performed outside of that provided by the manufacturer at intermittent times. Inter-accelerometer variability has been shown to be higher than
intra-accelerometer variability [66], and unpublished data from our collaborator suggests that while
the activity monitors are internally consistent, some may register activity counts at lower accel-eration, resulting in higher activity counts. This may be accounted for in our use of intensity, which compensates not only for inter-cat variability, but also for uncalibrated accelerometers or varying output from accelerometers. Using intensity, this study did not show significant effects for covariates within a group, but did find significant differences between the Normal cats and those with DJD during the weekdays.
Conclusions
This type of FDA is novel for activity data in companion animals. The similarities between the FMPI and Low-dose studies suggest that the differences found between the Normal cats and those with DJD are real differences, but this should be explored more in future work. In addi-tion, future work should evaluate the change in activity pattern in response to an analgesic therapy. While several studies have shown that analgesics can increase activity in cats with
DJD [25,29], these studies have all used average per-minute activity over a treatment period.
in response to interactions with owners. However, alternatives to this suggestion are possible, and this will be an area of future research.
Further work that incorporates owner schedules will increase the granularity of analyses, and can shed light onto the effect of owner presence on activity peaks and on increased activity in response to an analgesic. Indeed, a potential placebo-by-proxy effect could be explored using FDA, as activity in cats should increase more when their owners are home if this effect is beneficial. Of great benefit to the understanding of activity in cats would be a longitudinal study of cats over their lifetime, from youth through to advanced age, correlated with changes in pain, radiographic DJD, weight, and health status. This type of study should also include additional subjective assessments of cats, including observations of temperament and behav-ior. It is possible that the interaction between pain, radiographic DJD, and activity is complex, as is seen in humans, and that behavioral traits interact both with baseline activity as well as response to DJD and associated pain. Future work to better understand temperament traits in cats is ongoing, and incorporation of these findings into studies of activity and treatment response will deepen our interpretation of results.
Supporting Information
S1 Fig. Activity (A) and intensity (B) profiles for cats in the two DJD groups. Log
trans-formed activity for all cats is shown in gray with time (in hours) along the horizontal axis. The group mean for activity and intensity are shown for the Low-dose study (red) and FMPI study (yellow).
(TIF)
S2 Fig. Results of FPCA for Intensity for the Normal cats. (A) The top three eigenfunctions
of intensity profiles for activity during the weekend (black) and weekday (blue). The first com-ponent describes approximately 40% of the total variance for both weekends and weekdays and picks up the two peaks seen in the activity profiles.
(TIF)
S3 Fig. Results of FPCA for Intensity for the DJD cats. The top three eigenfunctions of
intensity profiles for activity during the weekend (dark blue) and weekday (light blue). The first component describes approximately 34% of the total variance for the weekends and approximately 37% for the weekdays and picks up the two peaks seen in the activity profiles. (TIF)
S4 Fig. Functional regression analysis for intensity in the Normal group. Depicted are the
smooth effects of Age (years, left panels), BCS (middle panels) and AGEBCS (standard
devia-tions away from the mean, right panels) on the intensity of Normal cats, when model (1) is assumed. Results are shown for weekends in the top row and weekdays in the bottom row, with functional coefficients in black, 95% confidence intervals in blue, and zero demarcated in red.
(TIFF)
S5 Fig. Functional regression analysis for intensity in the DJD group. Depicted are the
smooth effects of Age (years), BCS, AGEBCS (standard deviations away from the mean),
stan-dardized TDJD score and TPain score on the intensity of DJD cats, when model (2) is assumed. Results are shown for weekends in the top row and weekdays in the bottom row, with functional coefficients in black, 95% confidence intervals in blue, and zero demarcated in red.
Acknowledgments
The authors would like to acknowledge the cat owners that participated in the contributing studies with their cats.
Author Contributions
Conceptualization: MG MC AMS BDXL.
Data curation: MG MC AMS AT AW BDXL.
Formal analysis: MC AMS.
Funding acquisition: MG AMS BDXL.
Investigation: MG AT AW BDXL.
Methodology: MG MC AMS BDXL.
Project administration: MG AT AW BDXL.
Resources: MG AT MC AMS BDXL.
Software: MC AMS.
Supervision: AMS BDXL.
Validation: AMS BDXL.
Visualization: MG MC AMS BDXL.
Writing – original draft: MG MC AMS BDXL.
Writing – review & editing: MG MC AT AW AMS BDXL.
References
1. Lo GH, McAlindon TE, Hawker GA, et al. Symptom Assessment in Knee Osteoarthritis Needs to Account for Physical Activity Level. Arthritis Rheumatol 2015; 67:2897–2904. doi:10.1002/art.39271
PMID:26407008
2. Semanik PA, Lee J, Song J, et al. Accelerometer-monitored sedentary behavior and observed physical function loss. Am J Public Health 2015; 105:560–566. doi:10.2105/AJPH.2014.302270PMID:
25602883
3. Chang RW, Semanik PA, Lee J, et al. Improving physical activity in arthritis clinical trial (IMPAACT): study design, rationale, recruitment, and baseline data. Contemp Clin Trials 2014; 39:224–235. doi:10. 1016/j.cct.2014.08.010PMID:25183043
4. Feinglass J, Song J, Semanik P, et al. Association of functional status with changes in physical activity: insights from a behavioral intervention for participants with arthritis. Arch Phys Med Rehabil 2012; 93:172–175. doi:10.1016/j.apmr.2011.06.037PMID:22200399
5. Masse LC, de Niet JE. Sources of validity evidence needed with self-report measures of physical activ-ity. J Phys Act Health 2012; 9 Suppl 1:S44–55.
6. John D, Freedson P. ActiGraph and Actical physical activity monitors: a peek under the hood. Med Sci Sports Exerc 2012; 44:S86–89. doi:10.1249/MSS.0b013e3182399f5ePMID:22157779
7. Rothney MP, Schaefer EV, Neumann MM, et al. Validity of physical activity intensity predictions by Acti-Graph, Actical, and RT3 accelerometers. Obesity 2008; 16:1946–1952. doi:10.1038/oby.2008.279
PMID:18535553
8. Ekblom O, Ekblom-Bak E, Bolam KA, et al. Concurrent and predictive validity of physical activity mea-surement items commonly used in clinical settings- data from SCAPIS pilot study. BMC Public Health 2015; 15:978. doi:10.1186/s12889-015-2316-yPMID:26415512
10. Kumar D, Gubbi J, Yan B, et al. Motor recovery monitoring in post acute stroke patients using wireless accelerometer and cross-correlation. Conf Proc IEEE Eng Med Biol Soc 2013; 2013:6703–6706. doi:
10.1109/EMBC.2013.6611094PMID:24111281
11. Fitzgerald L, Ozemek C, Jarrett H, et al. Accelerometer Validation of Questionnaires Used in Clinical Settings to Assess MVPA. Med Sci Sports Exerc 2015; 47:1538–1542. doi:10.1249/MSS. 0000000000000565PMID:25380474
12. White DK, Tudor-Locke C, Felson DT, et al. Do radiographic disease and pain account for why people with or at high risk of knee osteoarthritis do not meet physical activity guidelines? Arthritis Rheumatol 2013; 65:139–147.
13. Liu SH, Waring ME, Eaton CB, et al. Association of objectively measured physical activity and metabolic syndrome among U.S. adults with osteoarthritis. Arthritis Care Res 2015.
14. Hashimoto T, Yoshiuchi K, Inada S, et al. Physical activity of elderly patients with rheumatoid arthritis and healthy individuals: an actigraphy study. Biopsychosoc Med 2015; 9:19. doi: 10.1186/s13030-015-0046-0PMID:26442128
15. Dessery Y, Belzile EL, Turmel S, et al. Modulation of physical activity to optimize pain sensation follow-ing an intra-articular corticosteroid injection in patients with knee osteoarthritis. ScientificWorld J 2014; 2014:209165.
16. Fary RE, Briffa NK, Briffa TG. Effectiveness of pulsed electrical stimulation in the management of osteo-arthritis of the knee: three case reports. Physiother Theory Pract 2009; 25:21–29. doi:10.1080/ 09593980802512613PMID:19140079
17. Pedisic Z, Bauman A. Accelerometer-based measures in physical activity surveillance: current prac-tices and issues. Br J Sports Med 2015; 49:219–223. doi:10.1136/bjsports-2013-093407PMID:
25370153
18. Masse LC, Fuemmeler BF, Anderson CB, et al. Accelerometer data reduction: a comparison of four reduction algorithms on select outcome variables. Med Sci Sports Exerc 2005; 37:S544–554. PMID:
16294117
19. Herman Hansen B, Bortnes I, Hildebrand M, et al. Validity of the ActiGraph GT1M during walking and cycling. J Sport Sci 2014; 32:510–516.
20. Hildebrand M, VANH VT, Hansen BH, et al. Age group comparability of raw accelerometer output from wrist- and hip-worn monitors. Med Sci Sports Exerc 2014; 46:1816–1824. doi:10.1249/MSS. 0000000000000289PMID:24887173
21. Hansen BD, Lascelles DX, Keene BW, et al. Evaluation of an accelerometer for at-home monitoring of spontaneous activity in dogs. Am J Vet Res 2007; 68:468–475. doi:10.2460/ajvr.68.5.468PMID:
17472445
22. Lascelles BD, Hansen BD, Thomson A, et al. Evaluation of a digitally integrated accelerometer-based activity monitor for the measurement of activity in cats. Vet Anaesth Analg 2008; 35:173–183. doi:10. 1111/j.1467-2995.2007.00367.xPMID:17927675
23. Dow C, Michel KE, Love M, et al. Evaluation of optimal sampling interval for activity monitoring in com-panion dogs. Am J Vet Res 2009; 70:444–448. doi:10.2460/ajvr.70.4.444PMID:19335098
24. Brown DC, Boston RC, Farrar JT. Use of an activity monitor to detect response to treatment in dogs with osteoarthritis. J Am Vet Med Assoc 2010; 237:66–70. doi:10.2460/javma.237.1.66PMID:
20590496
25. Gruen ME, Griffith EH, Thomson AE, et al. Criterion Validation Testing of Clinical Metrology Instruments for Measuring Degenerative Joint Disease Associated Mobility Impairment in Cats. PLoS One 2015; 10: e0131839. doi:10.1371/journal.pone.0131839PMID:26162101
26. Guillot M, Moreau M, Heit M, et al. Characterization of osteoarthritis in cats and meloxicam efficacy using objective chronic pain evaluation tools. Vet J 2013; 196:360–367. doi:10.1016/j.tvjl.2013.01.009
PMID:23416029
27. Lascelles BD, DePuy V, Thomson A, et al. Evaluation of a therapeutic diet for feline degenerative joint disease. J Vet Intern Med 2010; 24:487–495. doi:10.1111/j.1939-1676.2010.0495.xPMID:20337921 28. Brown DC, Boston RC, Farrar JT. Use of an activity monitor to detect response to treatment in dogs
with osteoarthritis. J Am Vet Med Assoc 2010; 237:66–70. doi:10.2460/javma.237.1.66PMID:
20590496
29. Guillot M, Moreau M, Heit M, et al. Characterization of osteoarthritis in cats and meloxicam efficacy using objective chronic pain evaluation tools. Vet J 2013; 196:360–367. doi:10.1016/j.tvjl.2013.01.009
PMID:23416029
31. Lascelles BDX, DePuy V, Thomson A, et al. Evaluation of a Therapeutic Diet for Feline Degenerative Joint Disease. J Vet Intern Med 2010; 24:487–495. doi:10.1111/j.1939-1676.2010.0495.xPMID:
20337921
32. Lascelles BDX, Hansen BD, Roe S, et al. Evaluation of client-specific outcome measures and activity monitoring to measure pain relief in cats with osteoarthritis. J Vet Intern Med 2007; 21:410–416. PMID:
17552444
33. Malfait AM, Little CB. On the predictive utility of animal models of osteoarthritis. Arthritis Res Ther 2015; 17:225. doi:10.1186/s13075-015-0747-6PMID:26364707
34. Percie du Sert N, Rice AS. Improving the translation of analgesic drugs to the clinic: animal models of neuropathic pain. Br J Pharmacol 2014; 171:2951–2963. doi:10.1111/bph.12645PMID:24527763 35. McCoy AM. Animal Models of Osteoarthritis: Comparisons and Key Considerations. Vet Pathol 2015;
52:803–818. doi:10.1177/0300985815588611PMID:26063173
36. D’Anjou MA, Moreau M, Troncy E, et al. Osteophytosis, subchondral bone sclerosis, joint effusion and soft tissue thickening in canine experimental stifle osteoarthritis: comparison between 1.5 T magnetic resonance imaging and computed radiography. Vet Surg 2008; 37:166–177. doi:10.1111/j.1532-950X. 2007.00363.xPMID:18251811
37. Rialland P, Bichot S, Moreau M, et al. Clinical validity of outcome pain measures in naturally occurring canine osteoarthritis. BMC Vet Res 2012; 8:162. doi:10.1186/1746-6148-8-162PMID:22963751 38. Walton MB, Cowderoy E, Lascelles D, et al. Evaluation of construct and criterion validity for the
’Liver-pool Osteoarthritis in Dogs’ (LOAD) clinical metrology instrument and comparison to two other instru-ments. PLoS One 2013; 8:e58125. doi:10.1371/journal.pone.0058125PMID:23505459
39. Piccione G, Marafioti S, Giannetto C, et al. Comparison of daily distribution of rest/activity in companion cats and dogs. Biol Rhythm Res 2014; 45:615–623.
40. Piccione G, Marafioti S, Giannetto C, et al. Daily rhythm of total activity pattern in domestic cats (Felis silvestris catus) maintained in two different housing conditions. J Vet Behav 2013; 8:189–194.
41. Kappen KL, Garner LM, Kerr KR, et al. Effects of photoperiod on food intake, activity and metabolic rate in adult neutered male cats. J Anim Physiol An N 2014; 98:958–967.
42. de Godoy MRC, Ochi K, Mateus LFD, et al. Feeding frequency, but not dietary water content, affects voluntary physical activity in young lean adult female cats. J Anim Sci 2015; 93:2597–2601. doi:10. 2527/jas.2014-8574PMID:26020354
43. Deng P, Grant RW, Swanson KS. Physical activity level of adult cats with varied feeding frequency. Br J Nutr 2011; 106:S166–S169. doi:10.1017/S0007114511001863PMID:22005419
44. Ramsay JO, Silverman BW. Applied functional data analysis methods and case studies. In: Springer series in statistics. New York: Springer; 2002:1 online resource.
45. Ramsay JO, Silverman BW. Functional data analysis. In: Springer series in statistics. New York: Springer; 2005:1 online resource.
46. Xiao L, Huang L, Schrack JA, et al. Quantifying the lifetime circadian rhythm of physical activity: a covar-iate-dependent functional approach. Biostatistics 2015; 16:352–367. doi:10.1093/biostatistics/kxu045
PMID:25361695
47. Shou H, Zipunnikov V, Crainiceanu CM, et al. Structured functional principal component analysis. Bio-metrics 2015; 71:247–257. doi:10.1111/biom.12236PMID:25327216
48. Morris JS, Arroyo C, Coull BA, et al. Using Wavelet-Based Functional Mixed Models to Characterize Population Heterogeneity in Accelerometer Profiles: A Case Study. J Am Stat Assoc 2006; 101:1352– 1364. doi:10.1198/016214506000000465PMID:19169424
49. Goldsmith J, Zipunnikov V, Schrack J. Generalized multilevel function-on-scalar regression and princi-pal component analysis. Biometrics 2015; 71:344–353. doi:10.1111/biom.12278PMID:25620473 50. Gruen ME, Thomson AE, Griffith EH, Paradise H, Gearing DP, Lascelles BDX. A feline-specific
anti-nerve growth factor antibody improves mobility in cats with degenerative joint disease-associated pain: a pilot proof of concept study. J Vet Intern Med 2016; 28:346–350.
51. IRIS Staging of CKD.http://iris-kidney.com/pdf/n378.008-iris-website-staging-of-ckd-pdf.
52. Myers SL, Brandt KD, Eilam O. Even low-grade synovitis significantly accelerates the clearance of pro-tein from the canine knee. Implications for measurement of synovial fluid "markers" of osteoarthritis. Arthritis Rheumatol 1995; 38:1085–1091.
53. Lascelles BDX, Henry JB, Brown J, et al. Cross-Sectional Study of the Prevalence of Radiographic Degenerative Joint Disease in Domesticated Cats. Vet Surg 2010; 39:535–544. doi: 10.1111/j.1532-950X.2010.00708.xPMID:20561321
55. Pomann GM S A G S. A Two-Sample Distribution-Free Test for Functional Data with Application to a Diffusion Tensor Imaging Study of Multiple Sclerosis. J Royal Stat Soc 2015;Series C.
56. Faraway JJ. Regression analysis for a functional response. Technometrics 1997; 39:254–261.
57. Scheipl F, Staicu AM, Greven S. Functional Additive Mixed Models. J Comput Graph Stat 2015; 24:477–501. doi:10.1080/10618600.2014.901914PMID:26347592
58. Houpt KA. Domestic animal behavior for veterinarians and animal scientists, 5th ed. Ames, Iowa: Wiley-Blackwell; 2011; xxi, 393 p.
59. Panaman R. Behavior and Ecology of Free-Ranging Female Farm Cats (Felis-Catus L). Z Tierpsychol 1981; 56:59–73.
60. Chen KY, Bassett DR Jr. The technology of accelerometry-based activity monitors: current and future. Med Sci Sports Exerc 2005; 37:S490–500. PMID:16294112
61. Westerterp KR. Physical activity as determinant of daily energy expenditure. Physiol Behav 2008; 93:1039–1043. doi:10.1016/j.physbeh.2008.01.021PMID:18308349
62. Michel KE, Brown DC. Determination and application of cut points for accelerometer-based activity counts of activities with differing intensity in pet dogs. Am J Vet Res 2011; 72:866–870. doi:10.2460/ ajvr.72.7.866PMID:21728845
63. Lascelles BD, Henry JB 3rd, Brown J, et al. Cross-sectional study of the prevalence of radiographic degenerative joint disease in domesticated cats. Vet Surg 2010; 39:535–544. doi: 10.1111/j.1532-950X.2010.00708.xPMID:20561321
64. Slingerland LI, Hazewinkel HA, Meij BP, et al. Cross-sectional study of the prevalence and clinical fea-tures of osteoarthritis in 100 cats. Vet J 2011; 187:304–309. doi:10.1016/j.tvjl.2009.12.014PMID:
20083417
65. Lascelles BDX, Dong YH, Marcellin-Little DJ, et al. Relationship of orthopedic examination, goniometric measurements, and radiographic signs of degenerative joint disease in cats. BMC Vet Res 2012; 8.