DOI: 10.1051/0004-6361:20020085 c
ESO 2002
Astrophysics
&
On the variability of the visual binary WR 86
?
WC7 with a
β
-Cephei companion
S. J. Paardekooper1, P. M. Veen1, A. M. van Genderen1, and K. A. van der Hucht2
1
Leiden Observatory, Postbus 9513, 2300 RA Leiden, The Netherlands
2 SRON National Institute for Space Research, Sorbonnelaan 2, 3584 CA Utrecht, The Netherlands
Received 30 August 2001 / Accepted 15 January 2002
Abstract. We discuss the variability of WR 86 (WC7 (+B0 III)), a known visual binary, confirmed by Hubble Space Telescope observations (Niemela et al. 1998). Photometric observations show a fairly smooth light curve with a time scale of∼3.5 h and a light amplitude of∼0m.01. Because of the spectral classification of the visual companion (B0 III) it might well be aβ-Cephei star. From observations taken in 1989, 1990 and 1995 we derive two photometric frequencies, 6.914 cd−1 and 7.236 cd−1, where only the latter is given in the recent VIIth catalogue of galactic Wolf-Rayet stars (van der Hucht 2001). Our spectroscopy reveals a slightly variable WR star and almost certainly a pulsating companion. Comparison with stellar models suggests that WR 86 consists of a 20M β-Cephei star in combination with a WR star of initial mass 40M, atZ= 0.04. We derive a distance to WR 86 of 2.1±0.8 kpc.
Key words.stars: binaries: general – stars: Wolf-Rayet – stars: individual: WR 86
1. Introduction
The Wolf-Rayet (WR) star WR 86 (HD 156327) is a well known visual binary of 000.2 separation, consisting of a WC7 type WR star together with a B0 III companion (L´epine et al. 2001). The variability of WR 86 with a time scale of∼3 h was discovered by Monderen et al. (1988) and subsequently attributed to a possibleβ-Cephei companion to the WR star by van Genderen et al. (1991). However, the tentative objection against this supposition was due to the absence of a progressively increasing light amplitude up into the ultraviolet near 3300 ˚A. A possible explana-tion is that the WR star substantially contributes to the UV flux, surpressing the UV light amplitude appreciably. We present photometric monitoring during nine nights in 1990, from which we derive new periods, one night in 1989 and one in 1995, which were used together with si-multaneous spectroscopy to see whether the photometric variations have any spectroscopic counterpart.
We will describe the observations in Sect. 2, after which we discuss the photometry in Sect. 3, and the spectroscopy in Sect. 4. We draw our conclusions in Sect. 5.
Send offprint requests to: A. M. van Genderen, e-mail:[email protected]
? Tables 3–6 and 8–13 are only available in electronic form
at the CDS via anonymous ftp to
cdsarc.u-strasbg.fr (130.79.128.5)or via
http://cdsweb.u-strasbg.fr/cgi-bin/qcat?J/A+A/384/1012
2. Observations and reductions
The 1989 and 1990 photometric observations were taken with the 90-cm Dutch telescope at the ESO, La Silla, Chile, equipped with the V BLU W photome-ter of Walraven during eighteen nights in July 1989 and nine nights in May and June 1990. An overview of the Walraven photometric system is given by Lub & Pel (1977). Integration times were of the order of 2 min for the variable and 0.5 min for the comparison star HD 158528, with an aperture of 1600.5. This comparison star has been used before in a study of Cepheids (Moffet & Barnes 1984), and we found no variations. No check stars were observed. Both components of WR 86 were together in the aper-ture. Table 1 lists the average photometric parameters in the V BLU W system (in log intensity scale) as well as the equivalent parameters of the U BV systemV and
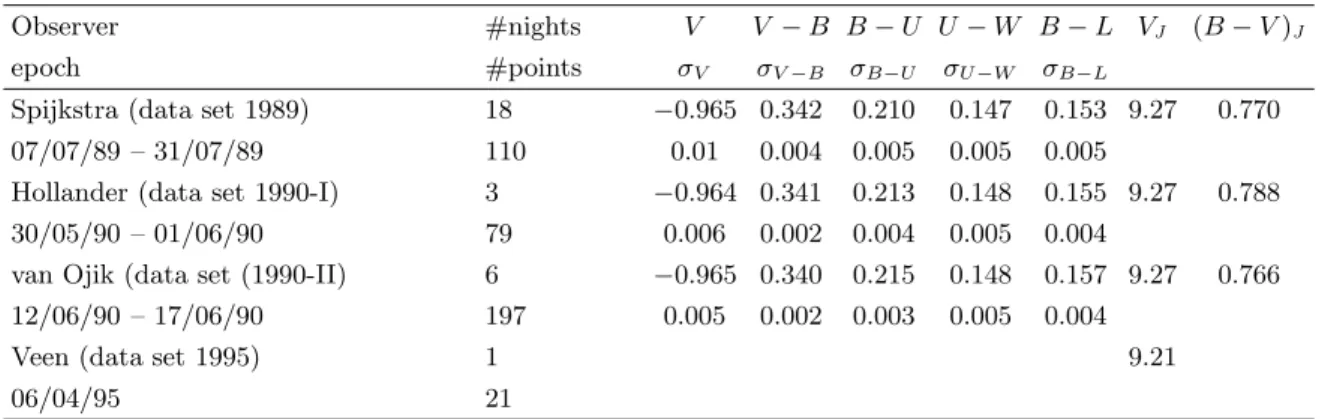
Table 1.Photometric parameters of WR 86 in the V BLU W system (in log intensity scale) and the the transformedV and B−V parameters (U BV system) with subscriptJ (in magnitudes).
Observer #nights V V −B B−U U−W B−L VJ (B−V)J
epoch #points σV σV−B σB−U σU−W σB−L
Spijkstra (data set 1989) 18 −0.965 0.342 0.210 0.147 0.153 9.27 0.770 07/07/89 – 31/07/89 110 0.01 0.004 0.005 0.005 0.005
Hollander (data set 1990-I) 3 −0.964 0.341 0.213 0.148 0.155 9.27 0.788 30/05/90 – 01/06/90 79 0.006 0.002 0.004 0.005 0.004
van Ojik (data set (1990-II) 6 −0.965 0.340 0.215 0.148 0.157 9.27 0.766 12/06/90 – 17/06/90 197 0.005 0.002 0.003 0.005 0.004
Veen (data set 1995) 1 9.21
06/04/95 21
Table 2. Photometric parameters of the comparison star HD 158528 in theV BLU Wsystem (in log intensity scale) and the the transformedV andB−V parameters (U BV system) with subscriptJ(in magnitudes).
V V −B B−U U−W B−L VJ (B−V)J
σV σV−B σB−U σU−W σB−L
−0.599 0.115 0.378 0.156 0.197 8.38 0.273 0.002 0.002 0.004 0.01 0.003
In Table 2 the average photometric parameters of the comparison star are listed. HD 158528 was found non-variable up to the instrumental errors. These parameters are representative for all observation nights. As can be seen from the standard deviations, the variations in dif-ferential magnitudes are due to WR 86.
The 1995 photometric data have been taken, using the ESO 50-cm telescope with, a single channel photometer. Sixteen data points have been recorded in about 21
2 hours,
again relative to the comparison star HD 158528, using the
V (ESO#99) filter.
Spectroscopy has been done by Greidanus in 1989, us-ing the Boller and Chivens spectrograph with the ESO 1.5-m telescope. The spectra have been recorded on a 1024×640 pixel CCD and reduced with MIDAS (version nov99). Part of the reduction was done by van Dongen (1993). The exposure time was 2 min during the first night, and 30 s the second and third nights. The resolution was 3.65 ˚A/pixel, fromλ= 4300 ˚A toλ= 7300 ˚A. The stabil-ity of the wavelength calibration has been checked using atmospheric lines, and it turned out that only the first night could be used for radial velocity studies. The other two nights showed significant scatter in the atmospheric lines, and these have only been used for equivalent width (EW) determinations.
In 1995 again spectra have been taken during two nights by one of us (P. M. V.), one night from λ = 3785 ˚A toλ= 4785 ˚A (five spectra), and one night from
λ= 4715 ˚A to λ= 6735 ˚A (sixteen spectra), resulting in a resolution of 0.49 and 1.03 ˚A/pixel, respectively. The same telescope configuration was used as in 1989, but
Fig. 1.Light curve for part of the data set 1989. The vertical scale is in units of log intensity, bright is up. On the right, an approximate magnitude scale is included. A 2σerror bar is shown on the left.
with a larger CCD detector (2048×2048 pixels). Exposure times were 20 min for the first night, and 10 min for the second night. The five spectra in the shorter wavelength range show many absorption lines from the companion B-type star, some of which were identified by Niemela et al. (1998).
Again, the stability of the wavelength calibration was checked using atmospheric lines. All spectra taken in 1995 are very stable in wavelength calibration up to 0.04 ˚A.
3. Light and color curves
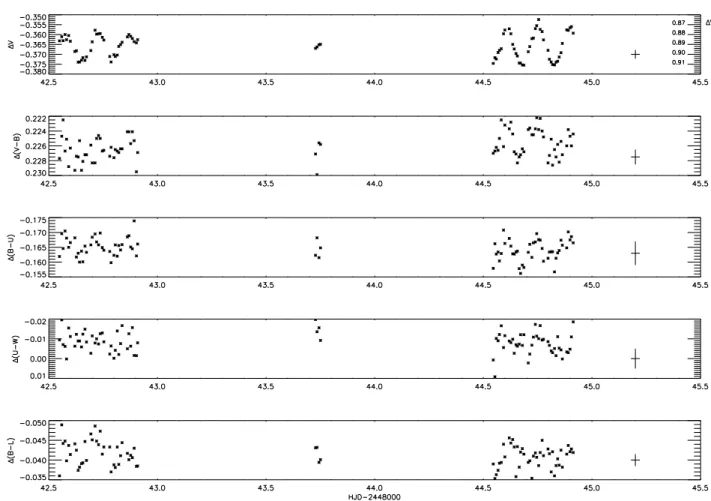
Fig. 2.Light and color curves for the data set 1990-I. The vertical scale is in units of log intensity, bright and blue are up. Note the scale differences on the left. On the right of the ∆V figure an approximate magnitude scale is included. For each color a 2σ error bar is shown on the right.
The differential light and color curves for the data set 1990-I are given in Fig. 2, and the data values can be found in Table 4. Note that the scale differs for the various colors. For the differential light curve an approximate magnitude scale is included, obtained using again the formulae of Pel (1986). Therefore the reader should be careful in compar-ing the Walraven light curve with the 1995 data set in Fig. 5, as systematic errors up to a tenth of a magnitude might be present.
The light curve is remarkably smooth, almost sinuso¨ı-dal, but looking at the third night it is clear that the amplitude as well as the mean intensity have gone up, which already suggests that there must be a second pe-riod. While in the first night the ∆(V −B) is very noisy, it is clear in the third night that the star is red when faint and blue when bright, as expected for a pulsating star.
The second 1990 data set is given in Fig. 3, and the data values can be found in Table 5. This data set clearly shows a lot more scatter than 1990-I, but still the ampli-tude variations (0.01–0.02 in log I) as well as the color variation are obvious.
We performed a period-analysis using the AOV (Analysis Of Variance, Schwarzenberg-Czerny 1989) rou-tine within MIDAS, to check whether a second period is present. Both data sets contain enough cycles to detect
frequencies reliably, and the results are given in Fig. 4. Clearly two periods are present, and the spectral window suggests that these are real. Furthermore, also the one day aliases can be seen, as well as their sub-harmonics (at fre-quencies 12f1 and 12f2). Both f1 and f2 appear in both
data sets, and every time f1 is the main component. We
have identified these frequencies as: 1990−I: f1= 6.914 c/d f2= 7.236 c/d
1990−II: f1= 6.836 c/d f2= 7.455 c/d.
And, assuming a phase-error of 0.2 over the whole observ-ing epoch, we can derive periods and their uncertainty, where we take the phase error divided by the number of observed cycles as the uncertainty:
1990−I: P1= 0d.145±0d.006 P2= 0d.138±0d.006
1990−II: P1= 0d.146±0d.003 P2= 0d.134±0d.003.
Note that the second period is actually the period given in van der Hucht (2001), as found by van Genderen et al. (1991). However, our data suggest that this is in fact not the main period, which isP1.
Fig. 3.Light and color curves for the data set 1990-II. The vertical scale is in units of log intensity, bright and blue are up. Note the scale differences on the left. On the right of the ∆V figure an approximate magnitude scale is included. For each color a 2σerror bar is shown on the right.
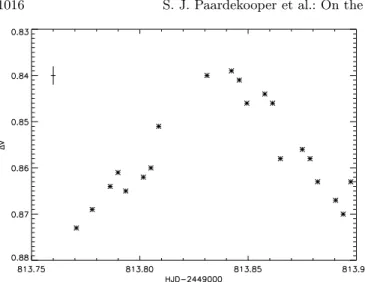
Fig. 5.Light curve for data set 1995, in magnitude scale. A 2σ error bar is indicated on the left.
consists of only about half a cycle, so no period anal-ysis was performed. Note, however, that the amplitude is of the order of 0.m03, consistent with the variations of aβ-Cephei star, see for example Sterken & Jerzykiewicz (1993). Furthermore, the periods are also consistent with
β-Cephei stars. V400 Car (HD 303068) for example, has a period of 0d.1458 (Engelbrecht 1986), and multi-periodicity
is quite common among these stars too. On the other hand, WR stars can exhibit variations on a time scale of hours too (e.g. Veen et al. 2002a,b,c), although most light curves are far less regular than for example those shown in Fig. 2.
The angular separation of the two stars of WR 86 is 000.2, and at a distance of 2.86 kpc (van der Hucht 2001) this means a projected separation of 286 AU. This already suggests that none of the periods found represents a binary period, as the stars are much too far apart for such short periods. It is up to the spectroscopy to decide which of the stars is variable, the WR star, or the B-type star.
4. Spectroscopy
As the 1989 data set runs fromλ= 4300 ˚A toλ= 7300 ˚A, the bright emission lines at 4650 ˚A (Ciii, iv, 5696 ˚A (Ciii)
and 5812 ˚A (Civ) are present. All spectral features used
in this paper are listed in Table 7.
We determined the radial velocity by fitting a Gauss-profile to the lines using the SEARCH/LONG within MIDAS. As the wavelength calibration was accurate up to 0.35 ˚A, the uncertainty in the velocity is about 20 km s−1,
depending on the wavelength of the line. We further per-formed an error-analysis by determining the line centroid, and compared these values by the ones obtained by fit-ting a Gaussian profile. Except for the Heii6560 line, the
differences did not exceed 50 km s−1.
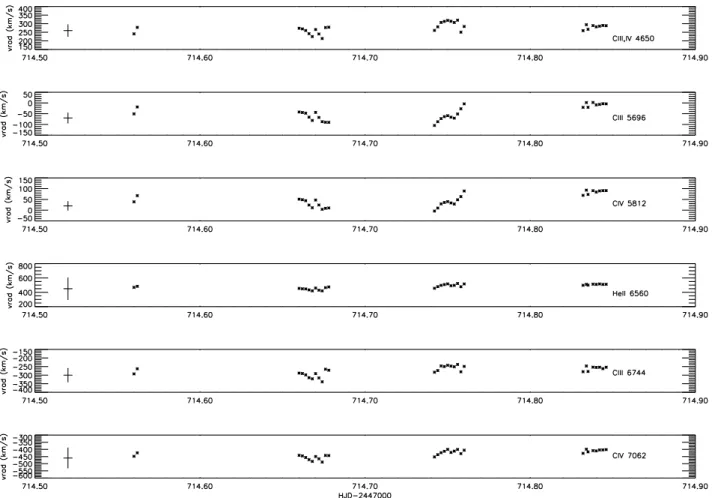
Unfortunately only the first night of the 1989 data could be used for radial velocity study, while simultaneous photometry was done only during the second and the third nights. Figure 6 shows the radial velocity for six observed emission lines, and the data values are listed in Table 8.
Table 7. Spectral lines for which radial velocities andEW’s were determined, with rest wavelengths used. The last two lines are absorption lines due to the companion star.
ID λrest(˚A)
Ciii, iv 4649.6
Civ 5470.8
Ciii 5695.9
Civ 5812.0
Heii 6560.1
Ciii 6744.4
Civ 7062.4
Hei 4025.6
Hei 4387.9
The data are quite noisy even here, and therefore no re-liable period could be found, but we can spot a general trend with some effort. For example, the Ciii, iv line at
4650 ˚A seems to have a maximum at HJD 714.75, and the data points at HJD 714.67 indicate that there just has been a maximum. However, if the WR star is pulsating at the photometric frequency, we would expect another maximum around HJD 714.6. This is clearly inconsistent with the observed behaviour, since if we extrapolate the radial velocity curve sine-wise to the left, we find a near-minimum there.
A similar argument applies to the Ciii5696 ˚A line. The
velocity curve suggests that there is a minimum around HJD 714.71, so we would expect another minimum one photometric period later, at HJD 714.85. Again, this is clearly not the case, as we are just past a maximum at that time. Note that this velocity curve looks a little bit delayed compared to the first one.
The Civ5812 ˚A line shows a similar behaviour as the
previous line, whereas the next line in Fig. 6 shows almost no variation at all. As for the Ciii 6744 ˚A line and the
Civ7062 ˚A line, a minimum at HJD 714.67 seems to be
followed by a maximum at HJD 714.75, which is also in no way consistent with the photometric periods.
Although these results are based on data that are marginally reliable enough to do any radial velocity study at all, it leads us to a first clue that the photometric be-haviour and that of the emission lines, the latter originat-ing from the WR star, are independent.
Fig. 6.Radial velocity for six emission lines in the 1989 data set. 2σ error bars are shown on the left.
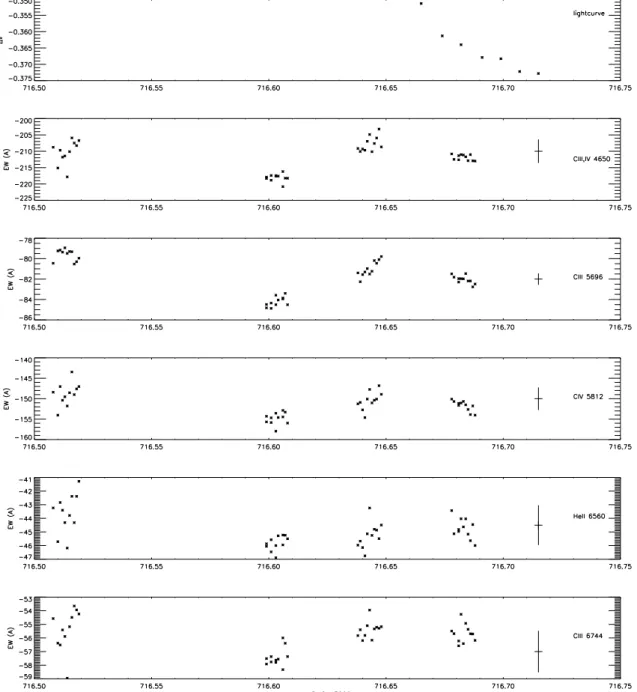
with respect to the light curve (read: continuum flux). A maximum of the light curve in Fig. 7 corresponds with a minimum in the equivalent width of all the observed emis-sion lines. And as the light curve is descending in Fig. 8, all the equivalent widths seem to be rising again. Since the photometric variability is a pure continuum phenomenon, and since the line flux as well as the continuum flux of the WR star originates in de WR stellar wind, this is an-other clue that the photometric variability of WR 86 is due to its companion. At maximum light the relatively strong continuum flux originating from theβ-Cephei star suppresses the equivalent widths of the emission lines orig-inating from the WR star.
We will now turn to the spectra of 1995. Two ranges in wavelength were available: five blue spectra with some absorption lines due to the companion, and sixteen red spectra with the carbon emission lines of the WR star, and for the latter simultanuous photometry was taken. Radial velocities and equivalent widths were measured in the same way as for the 1989 data set.
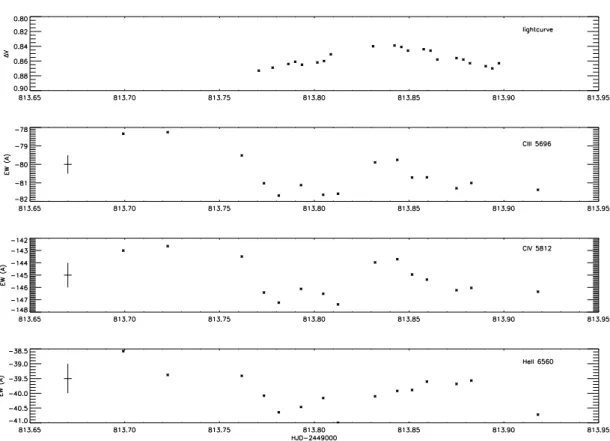
Figure 9 shows the equivalent widths of the emission lines together with the photometry, the data values can be found in Table 11. This time it is difficult to estimate the errors from local scattering, but since these spectra are of better quality compared with the 1989 data set, the errors should be smaller. Again, we see a (local) mini-mum at maximini-mum light (cf. Fig. 7). However, this time no
obvious anti-correlation seems present, as the equivalent width goes up at almost the same time as the photome-try. This may be caused by the smaller separation of the data points and the higher resolution compared to the 1989 data, resulting in a much more structured velocity curve, so that we might be seeing the variation of the WR star superimposed on the variations due to the possibleβ -Cephei star. Note that theEW of all lines has gone down since 1989, although the data set is too small to draw any conclusions about long-term variability.
Looking at the radial velocity for the emission lines, see Fig. 10 and Table 12, there is no visible correlation with the photometry. The Civ 5471 ˚A line seems to be
vari-able at a period of∼0d.25, which is not inconsistent with
the 1989 data set (cf. Fig. 6). More observations are nec-essary to see whether these variations are really periodic. However, line flux and radial velocity do share the same behaviour. For example, we can see a clear minimum in the radial velocity (when the wind moves at maximum speed towards us) corresponding to a maximum in line flux.
Although from this data set it is not at all clear what is happening, as the behaviour of the velocity and line fluxes can equally well be explained in terms of WR variability as in terms of a pulsating companion, we will move on to the absorption line analysis.
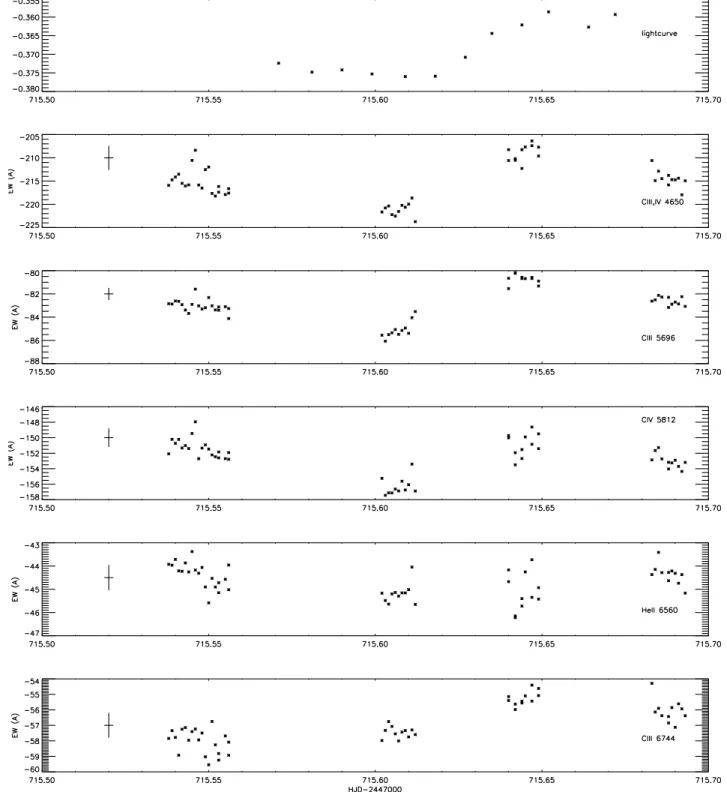
Fig. 7.Light curve from data set 1989 (top, see Fig. 1), followed by the equivalent widths for the indicated lines from the spectra of 1989 (second night). 2σerror bars are shown on the left.
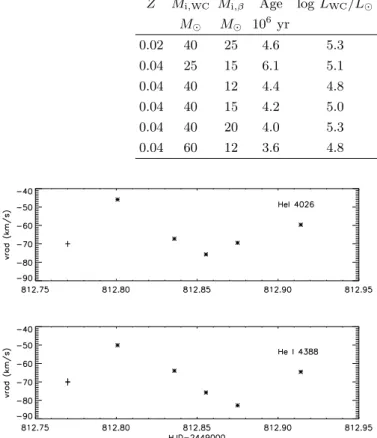
ones that show absorption lines due to the companion, they are of importance. Because when we look at the ra-dial velocity of two of the absorption lines (in fact the only two lines identified by Niemela et al. (1998) that are visible in our spectra), see Fig. 11 and Table 13, their variability is easy to recognize. Moreover, the range does not exceed 50 km s−1, which is consistent with the
lim-its given in Sterken & Jerzykiewicz (1993) for β-Cephei stars. And for what it is worth: a period of about 0d.14 is
Fig. 8. Light curve from data set 1989 (top, see Fig. 1), followed by the equivalent widths for the indicated lines from the spectra of 1989 (third night). 2σerror bars are shown on the right.
The data set might seem a little small for these last two conclusions, but the important point to note is that the companion really is pulsating, as such a short time scale is not compatible with a binary period, as mentioned before. So, what we have here is a pulsating early B-star, which makes it aβ-Cephei candidate at the very least, as it appears that the radial-velocity curve is closely correlated with the photometry. More closely spaced observations are necessary however, to confirm this.
5. Interpretation
Although the evidence is not absolutely conclusive, let us assume that the companion star of WR 86 is in-deed a β-Cephei star. We can use the stellar models of
Meynet et al. (1994) for metal abundancesZ = 0.02 and
Z = 0.04 to make an estimate for the masses of the two stars. We feel that, although the region of space where WR 86 is located is not known to be metal-rich, the young age of both stars justifies a higher metallicity.
According to these models, the minimum mass for a B0 star is about 12M. If we demand that the star must be a main sequence star, in any case not younger, this minimum mass becomes 15 M. As the spectral classifi-cation of the companion varies from B0 V (Smith 1968) to B0 III (L´epine et al. 2001) this demand seems to be justified.
The maximum luminosity of a WC star forZ = 0.02 is logL/L ≤ 5.8, implying a bolometric magnitude of
Fig. 9.Light curve in magnitude scale from data set 1995 (top, see Fig. 5), followed by the equivalent width for the indicated lines. 2σerror bars are shown on the left.
Fig. 10.Light curve in magnitude scale from data set 1995 (top, see Fig. 5), followed by the radial velocity for the indicated lines. 2σerror bars are shown on the left.
WC7 star BC =−4.17 (Nugis & Lamers 2000), we find an absolute visual magnitudeMWC
V ≥ −5.6. As the stars
share the same visual magnitude, this also holds for the
Table 14. Combinations of stars that can give rise to a WC7-β-Cephei binary. Parameters with subscript β belong to the β-Cepei star. The symbolMV stands for absolute visual magnitude (Johnson system).
Z Mi,WC Mi,β Age logLWC/L logLβ/L logTeff,β MV,WC MV,β d
M M 106 yr kpc
0.02 40 25 4.6 5.3 5.1 4.515 −4.3 −4.8 3.1 0.04 25 15 6.1 5.1 4.5 4.449 −3.9 −3.8 1.7 0.04 40 12 4.4 4.8 4.1 4.428 −2.9 −3.0 1.2 0.04 40 15 4.2 5.0 4.5 4.465 −3.6 −3.6 1.5 0.04 40 20 4.0 5.3 4.8 4.497 −4.3 −4.3 2.1 0.04 60 12 3.6 4.8 4.1 4.430 −3.0 −3.0 1.2
Fig. 11.Radial velocity for two absorption lines of the com-panion star. 2σerror bars are shown on the left.
companion mass of about 30M. The same analysis for
Z = 0.04 results in a maximum mass of 25 M for the companion.
Now, looking at the models in this mass range, we can try to find times at which the two stars share the same ab-solute visual magnitude. See Table 14. ForZ= 0.02, only one combination results in approximately the same abso-lute visual magnitude, but the companion star is much too hot to be of spectral type B0. Furthermore, according to Maeder (1991) the luminosity of aZ = 0.02 WC7 star should be around logL/L = 6.0, while logL/L = 5.3 corresponds to a WC5 star. We can therefore safely rule out this combination.
As for Z = 0.04, a WC7 star should have a luminos-ity around log L/L = 5.4, which points away from the 12Mβ-Cephei star combinations. The best option seems to be a WC7 star with an initial mass of 40Min combi-nation with aβ-Cephei star with an initial mass of 20M. In fact, this is the only combination in which the compan-ion is actually brighter than a main sequence B0 star, as found by Niemela et al. (1998).
Furthermore, an analysis performed by Koesterke & Hamann (1995) indicated a luminosity for the WC7 com-ponent of log L/L = 5.5. The mentioned combination of masses gives rise to a luminosity that agrees with their result. L´epine et al. (2001) derive an absolute visual
magnitude of the WR-component ofMV =−4.8±0.2. Of all mass combinations in Table 14, the mentioned combi-nation of masses comes closest to their result too.
However, only the 12 M β-Cephei stars obey the period-luminosity relation for β-Cephei stars (Sterken & Jerzykiewicz 1993):
−6.5 log P−10.8 =Mbol±0.6 (1)
where the periodPis given in days. With a period of 0d.145
this yields Mbol =−5.4, or log(L/L) = 4.1±0.2. This
luminosity is clearly too low for the 20M β-Cephei star. On the other hand, relation (1) is derived by Sterken & Jerzykiewicz using only stars of spectral type B1 and later, while the only B0 star in their sample is omitted. This star, V986 Oph (HD 165174), has a bolometric magnitude of minus 9.31, while relation (1) predicts Mbol = −7.4. So
both V986 Oph and our B0 component are approximately 2 mag brighter than the period-luminosity relation pre-dicts, which suggests that this relation may not hold for stars of such early spectral type. Note, however, that for thedouble period (0d.290) the period-luminosity relation predicts Mbol = −7.3, or log L/L = 4.8, exactly the
luminosity of a 20M β-Cephei star (see Table 14). So the evolutionary state of the system WR 86 can be explained in terms of just single-star evolution, indicating that there need not have been significant mass transfer between the components earlier on.
If we adopt the interstellar extinction as given in van der Hucht (2001), namely Av = 3.16 (Smith 1968
sys-tem, can be converted to U BV by dividing by 1.11), we can derive a distance for the system. The apparent vi-sual magnitudemV = 10.2 (Niemela et al. 1998) together with the absolute visual magnitudes in Table 14 and the interstellar extinction lead to the distances given in the last column Table 14. The distance of the preferred com-bination (2.1 kpc) is a little shorter thand= 2.86 kpc as given in van der Hucht (2001). The estimated error in the luminosities is about 0.2, which means an error of 0.5 in absolute magnitude. Adding an uncertainty inAV of 0.2, we arrive at an uncertainty in the distance of 0.8 kpc.
6. Conclusion
photometric periods present, namely P1 = 0d.146 and
P2 = 0d.136, with almost equal amplitudes. The
spec-troscopy indicates that the WR component is also vari-able, but the photometric behaviour is dominated by the
β-Cephei star.
This binary system can be explained in terms of the single star evolution atZ = 0.04. The stellar models sug-gest that the initial mass of the WC7 component was 40 M, while its present mass is about 12 M. The β -Cephei star had an initial mass of 20M, of which 19M
remains today. The luminosity of the WC7 component (see Table 14) agrees with the value found by Koesterke & Hamann (1995). We derive a distance to WR 86 of 2.1±0.8 kpc.
References
van Dongen, H. 1993, internal report, Leiden Observatory Engelbrecht, C. A. 1986, MNRAS, 223, 189
Flower, P. J. 1996, ApJ, 469, 355
van Genderen, A. M., van der Hucht, K. A., & Larsen, I. 1990, A&A, 229, 123
van Genderen, A. M., Verheijen, M. A. W., van der Hucht, K. A., et al. 1991, in Wolf-Rayet Stars and Interrelations with Other Massive Stars in Galaxies, ed. K. A. van der Hucht, & B. Hidayat (Kluwer; Dordrecht), Proc. IAU Symp., 143, 129
Hartkopf, W. I., Mason, B. D., Barry, D. J., et al. 1993, AJ, 106, 352
van der Hucht, K. A. 2001, New Astron. Rev., 45, 135 Jeffers, H. M., van den Bos, W. H., & Greeby, F. M. 1963, Index
Catalog of Visual Double Stars, Publ. Lick Obs., No. 21 Koesterke, L., & Hamann, W.-R. 1995, A&A, 299, 503 L´epine, S., Wallace, D., Shara, M. M., Moffat, A. F. J., &
Niemela, V. S. 2001, AJ, 122, 3407 Lub, J., & Pel, J. W. 1977, A&A, 54, 137 Maeder, A. 1991, A&A, 242, 93
Meynet, G., Maeder, A., Schaller, G., Schaerer, D., & Charbonnel, C. 1994, A&AS, 103, 97
Moffet, T. J., & Barnes, T. G. 1984, ApJS, 55, 389
Monderen, P., de Loore, C. W. H., van der Hucht, K. A., & van Genderen, A. M. 1988, A&A, 195, 179
Niemela, V. S., Shara, M. M., Wallace, D. J., Zurek, D. R., & Moffat, A. S. J. 1998, AJ, 115, 2047
Nugis, T., & Lamers, H. J. G. L. M. 2000, A&A, 360, 227 Pamyatnykh, A. A. 1999, AcA, 49, 119
Pel, J. W. 1986, Internal report, Leiden Observatory Schwarzenberg-Czerny, A. 1989, MNRAS, 241, 153 Smith, L. F. 1968, MNRAS, 138, 109
Sterken, C., & Jerzykiewicz, M. 1993, Space Sci. Rev., 62, 95 Veen, P. M., van Genderen, A. M., van der Hucht, K. A., et al.
2002a, A&A, in press
Veen, P. M., van Genderen, A. M., Crowther, P. A., & van der Hucht, K. A. 2002b, A&A, in press