Quantitative assessment of the upper airway in infants and
children with subglottic stenosis
Carlton Zdanski1,*, Stephanie Davis, MD2,*, Yi Hong, MSc3, Di Miao, BS4, Cory Quammen,
BS5, Sorin Mitran, PhD10, Brad Davis, PhD5, Marc Niethammer, PhD6, Julia Kimbell, PhD1,
Elizabeth Pitkin, BSN7, Jason Fine, PhD3, Lynn Fordham, MD8, Bradley Vaughn, MD9, and
Richard Superfine, PhD6
1Department of Otolaryngology/Head and Neck Surgery, University of North Carolina at Chapel
Hill, Chapel Hill, North Carolina
2Department of Pediatrics, Section of Pediatric Pulmonology, Allergy and Sleep Medicine, Riley
Children’s Hospital, Indiana University School of Medicine
3Department of Computer Science, University of North Carolina at Chapel Hill, Chapel Hill, North
Carolina
4Department of Statistics, University of North Carolina at Chapel Hill, Chapel Hill, North Carolina
5Kitware, Incorporated, Carrboro, North Carolina
6Department of Physics and Astronomy, University of North Carolina at Chapel Hill, Chapel Hill,
North Carolina
7Department of Pediatrics, Division of Pediatric Pulmonology, University of North Carolina at
Chapel Hill, Chapel Hill, North Carolina
8Department of Radiology, University of North Carolina at Chapel Hill, Chapel Hill, North Carolina
9Department of Neurology, University of North Carolina at Chapel Hill, Chapel Hill, North Carolina
10Department of Mathematics, University of North Carolina at Chapel Hill, Chapel Hill, North
Carolina
Correspondence to: Carlton J. Zdanski, MD, FACS, FAAP, G117, POB, CB#7070, Department of otolaryngology/Head and Neck Surgery, University of North Carolina at Chapel Hill, Chapel Hill, NC 27599-7070, Telephone: (919) 966-8926, FAX: (919) 966-7941, [email protected].
*Dr.’s Zdanski and Davis share first co-authorship
CONFLICT OF INTEREST: None of the authors have any conflict of interest.
LEVEL OF EVIDENCE: 4 Supplemental Information Legend:
1. Computational Fluid Dynamics Methods.
2. Flow Rate Normalization Methodology.
3. Table S1: Linear regression summary: Geometry Variables
4. Table S2: Linear regression summary: Computational Fluid Dynamics
5. Patient Characteristics: Intervention versus No Intervention
HHS Public Access
Author manuscript
Laryngoscope
. Author manuscript; available in PMC 2017 May 01.Published in final edited form as:
Laryngoscope. 2016 May ; 126(5): 1225–1231. doi:10.1002/lary.25482.
A
uthor Man
uscr
ipt
A
uthor Man
uscr
ipt
A
uthor Man
uscr
ipt
A
uthor Man
uscr
Abstract
OBJECTIVES—Determine whether quantitative geometric measures and a computational fluid
dynamic (CFD) model derived from medical imaging of children with subglottic stenosis (SGS) can be effective diagnostic and treatment planning tools.
STUDY DESIGN—Retrospective chart and imaging review.
SETTING—Tertiary Care Hospital
SUBJECTS AND METHODS—CT scans (n=17) of children with SGS were analyzed by
geometric and CFD methods. Polysomnograms (n=15) were also analyzed. Radiographic data was age/weight flow normalized and compared to an Atlas created from radiographically normal airways. Five geometric, seven CFD, and five polysomnography measures were analyzed.
Statistical analysis utilized a two-sample t-test with Bonferroni correction and area under the curve analysis.
RESULTS—Two geometric indices (the ratio of the subglottic to mid-tracheal airway; the percent
relative reduction of the subglottic airway) and one CFD measure (the percent relative reduction of the hydraulic diameter of the subglottic airway) were significant for determining which children with SGS received surgical intervention. Optimal cutoffs for these values were determined. Polysomnography, the respiratory effort related arousals index was significant only prior to Bonferroni correction for determining which children received surgical intervention.
CONCLUSIONS—Geometric and CFD variables were sensitive at determining which patients
with SGS received surgical intervention. Discrete, quantitative assessment of the pediatric airway was performed, yielding preliminary data regarding possible objective thresholds for surgical versus non-surgical treatment of disease. This study is limited by its small, retrospective, single institution nature. Further studies to validate these findings and possibly optimize treatment threshold recommendations are warranted.
Keywords
Pediatric airway; subglottic stenosis; airway stenosis; airway and voice modeling
Introduction
Subglottic stenosis (SGS) may be either congenital or acquired. Congenital SGS is identified when there is airway narrowing in the cricoid area without a history of endotracheal
intubation [1]. Acquired SGS typically occurs in children with a previous history of
intubation, usually as a result of endotracheal tube trauma [1]. Infants and children with SGS are at risk for hypoxia, respiratory insufficiency, and impaired growth. A multidisciplinary approach to care of these children involves complex decision making from medical and surgical specialists. In these unique and challenging cases, therapy is typically directed by the clinicians’ experience. Clinical tools often used include history, physical examination, polysomnography, and airway endoscopy (both rigid and flexible) to create an individualized approach to care. In some cases, treatment failure occurs despite medical and surgical intervention. Treatment failure may also result from inappropriate watchful waiting for growth that fails to resolve the problem. These failures may lead to serious complications
A
uthor Man
uscr
ipt
A
uthor Man
uscr
ipt
A
uthor Man
uscr
ipt
A
uthor Man
uscr
requiring more invasive procedures to appropriately correct the condition. Existing
quantitative metrics, such as discrete anatomic measurements from imaging and endoscopy or measures from computational fluid dynamics, are research tools that are not currently used in the clinical setting. Given this, the development of more effective, quantitative diagnostic tools with broad clinical applicability for infants and children with airway obstruction has great potential to improve management.
With advancing computer technology, powerful bioengineering tools are now available for investigating the physiological dynamics of the respiratory tract. Using computer-aided design software, anatomically-accurate, 3-dimensional computational models can be generated from patient-specific digital data captured by computed tomography (CT) scans or other imaging modalities. Computational techniques including computational fluid dynamics (CFD) and fluid-structure interaction (FSI) models allow for the merging of dynamic anatomy with physiology by creating a virtual model of the respiratory tract with computed measures of airflow.
These computational models could be used as a standardized, quantitative, predictive tool to estimate the effect of various medical and surgical interventions. The goal of this study was to develop and validate a functional computational model of the pediatric upper airway in children with SGS. We hypothesized that quantitative geometric measures derived from medical imaging and a functional computational model that simulates the aerodynamic behavior of the airway in infants and children with SGS can be used as effective diagnostic and treatment planning tools.
Subjects
We enrolled 17 participants ≤ 10 years of age with SGS from May 31, 2011 to Nov. 7, 2013. Inclusion criteria included the diagnosis of SGS defined as a) a subglottic airway diameter of 4 mm or less in a term neonate; b) a subglottic airway diameter of 3.5 mm or less in a premature neonate; or c) the inability to pass an endotracheal tube of expected size based on the age of the subject[1]. In general, conservative tube sizes (by inner diameter in mm) for children greater than or equal to 1 year of age are chosen utilizing the formula [4 + (age/ 16)]. Special consideration is given for variations in patient size and endotracheal tubes. Additional inclusion criteria included being scheduled for a clinically indicated endoscopic upper airway evaluation and the ability to comply for study visits and procedures. Subjects were enrolled into either a cross-sectional or a longitudinal component of the protocol; for the longitudinal component, subjects were evaluated over a 1 year period. For the purpose of this manuscript, only cross-sectional data from visit 1 or 3 of the longitudinal study are reported. Exclusion criteria included acute intercurrent respiratory infection, defined as an increase in cough, wheezing, or respiratory rate with onset in the preceding 2 weeks and/or physical findings at screening that would compromise the safety of the participant or the quality of the study data. Institutional review board approval and parental consent were obtained for all subjects.
A
uthor Man
uscr
ipt
A
uthor Man
uscr
ipt
A
uthor Man
uscr
ipt
A
uthor Man
uscr
Protocol
Once informed consent was signed, a CT scan of the neck was obtained in all subjects. A polysomnogram was scheduled within 2 months of the clinically indicated upper airway endoscopy. CT data was used as described below. No medical decision making was based on the modeling data.
CT methods
Subjects were scanned from the top of the sella to the pulmonary hila using a multi-detector Siemens scanner with CareDose technique (Siemens AG Healthcare sector, Erlangen Germany); kV 100, reference mAs 80 with 0.6mm collimation. Images were reconstructed at 0.3 mm increments.
Geometric Methods
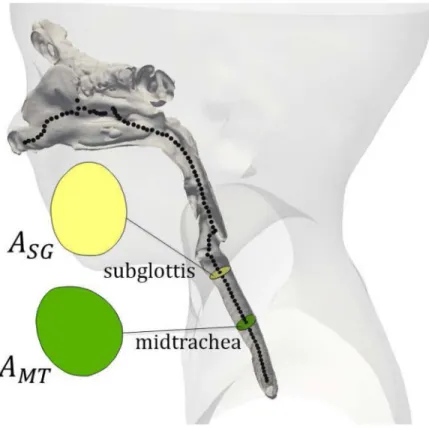
We measured geometric properties of the pediatric airway based on a simplified model which approximates 3D airway geometry with cross sections measured on normal planes along the airway centerline [2]. The cross-sectional area (A) and the hydraulic diameter (D), discussed below in the section on computational fluid dynamics, were evaluated. For each subject, five anatomics (nasal spine, choanae, epiglottis tip, true vocal cords (TVC) and tracheal carina were used to align and register the geometries of all of subjects. By spatially normalizing cross-sectional area measurements using a spline model [3], we were able to measure cross-sectional areas in a common coordinate system across subjects. Two further locations were determined: SGS (the minimum cross-sectional area along the airway below the TVC) and midtrachea calculated as the midway point between the subglottis and the carina). Our analysis included the following quantities:
a. ASG: the average cross-sectional area of a 1.5mm-long airway segment centered at a user-placed subglottis landmark.
b. AMT: the average cross-sectional area of a 15mm-long airway segment centered at the midpoint between the subglottis and the carina.
c. RASG: subglottic-tracheal ratio, the ratio of the cross-sectional area at the subglottis to that at the mid-trachea.
Given that these values were extracted from the geometry derived from individual medical images, we then sought to understand whether additional insight was to be gained by normalizing the patient values against population values via an “atlas based” normalization process.
d. AS(Asg): The relative percentile reduction of the airway’s cross-sectional area in the subglottic region. We built an atlas from 68 normal controls (age 9 to 185 months), adapted to the age of the testing subject [4]. The CT scans of all children at the study institution who underwent regional scanning for reasons
A
uthor Man
uscr
ipt
A
uthor Man
uscr
ipt
A
uthor Man
uscr
ipt
A
uthor Man
uscr
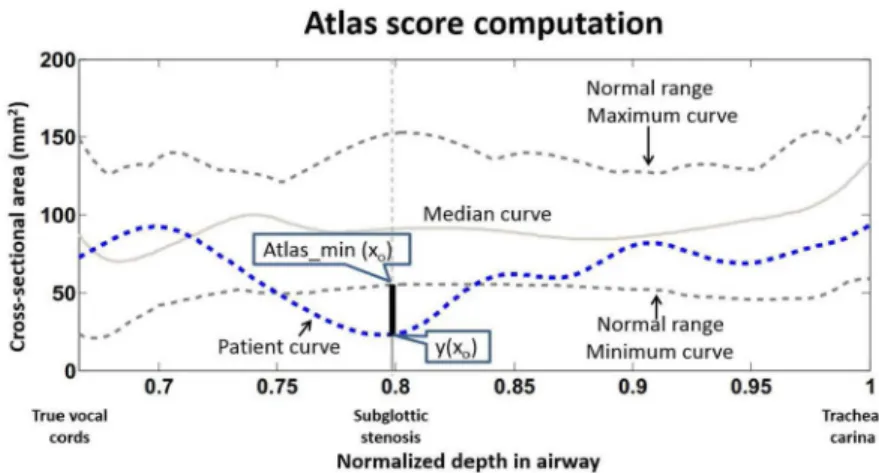
other than airway problems were reviewed to insure that the airways were normal prior to construction of geometries, landmarking, and database entry. The minimal curve of the atlas is considered the minimal cross-sectional area of a normal airway at that age. For the Atlas Score (AS), we take the minimal curve as the baseline. We assign a negative value to the Atlas Score to a testing subject when part of the cross-sectional area is below the minimal curve. We assign a positive Atlas Score value to a testing subject when the cross-sectional areas is above the minimal curve. A positive Atlas Score implies an airway geometry completely within the normal range for age group. Specifically, the atlas score is defined as AS(y) = min ((y(x)-atlas_min(x))/atlas_min(x)), where the minimum is computed over all positions, x, between the true vocal cords and the carina, atlas_min(x) denotes the minimum curve in the age-adapted atlas and y(x) denotes either the cross-sectional area along the airway (see Figure 1 and Figure 2).
e. PR(ASG): predicted percent relative reduction of the subglottis. Similar to the Cotton-Myer score, this value measures the reduction of the measured subglottis relative to a predicted, healthy subglottis measurement for the patient. In this case the prediction is based on the measurement of the patient’s healthy trachea.
First, a median subglottic-tracheal ratio ( ) was computed from the atlas. Then, for each patient, the actual subglottis measurement (ASG) is compared to a subglottis measurement predicted by and the actual trachea measurement (AMT).
for a database on N Healthy Patients.
f. ASG,FN: The values of the cross section are normalized for the weight and age of
the patient through the use of the established dependency of the flow rate on weight and age.
Fluid Dynamics
Fluid dynamics is fundamental to airway function. We employed the hydraulic diameter, (defined by D = 4A/P where P is the perimeter of the opening), to account for its affect on airflow. The hydraulic diameter is convenient to represent, with a single number, the effect that a complex sectional shape has on impeding flow. For a non-circular cross-sectional area, the hydraulic diameter corresponds to the diameter of a circular pipe that would result in the same pressure drop. The variables DSG (the average hydraulic diameter of a 1.5mm-long airway segment centered at a user-placed subglottis landmark), DMT (the average hydraulic diameter of a 15mm-long airway segment centered at the midpoint between the subglottis and the carina), RDSG (subglottic-tracheal ratio, the ratio of the hydraulic diameter at subglottis to that at mid-trachea), AS(Dsg) (atlas score for the hydraulic diameter of the subglottis) and PR(DSG) (predicted percent relative reduction of
A
uthor Man
uscr
ipt
A
uthor Man
uscr
ipt
A
uthor Man
uscr
ipt
A
uthor Man
uscr
the subglottis hydraulic diameter) all follow the definitions as described above for the cross sectional areas.
Computation of airway flow can be challenging due to the complicated geometry and transitional turbulence. Direct numerical simulation of the Navier-Stokes equations, large eddy simulation, and various Reynolds-averaged models (RANS) have been used to extract airway pressures [5, 6], and are typically found to be within 20% of measured values. Such methods require significant computer resources (often requiring many hours of simulation time). Therefore, it is of practical clinical interest to develop methods that can provide medically relevant information with a fast turnaround time. To this end, a
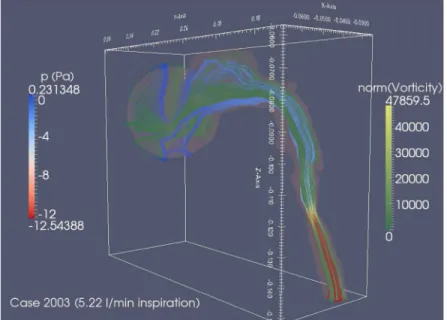
graphics-processing unit (GPU) implementation of a lattice Boltzmann method (LBM) was developed and tested against the criterion of accurate estimation of the severity of a stenosis (Figure 3). By comparison to commercially available Navier-Stokes solvers (e.g. Fluent, Ansys Inc.) that may require 3–12 hours for a converged airway simulation using a RANS model, the LBM method developed for this current study provides a qualitative prediction of airway flow patterns and pressure losses in 10–15 minutes (Figure 3) [7]. A further description is provided in Supplemental Information.
We employed our CFD to calculate the pressure at various airway locations under steady prescribed flow rate. We defined two pressure drop ratios: η1, (the ratio of the pressure drop across the stenosis divided by the pressure drop from the carina to the base of the tongue; and η2, (the ratio of the pressure drop across the stenosis divided by the pressure drop from below the stenosis to the tongue base).
Normalization of Geometric and CFD measures for age and weight using flow characteristics
We hypothesized that the measures of the airway of a patient would better correlate with pathology if the patient’s age and weight were taken into account. We therefore normalized several measures of patient airway geometry and pressure drops to a population using the published dependence of airflow rate on age and weight. See Supplemental Information.
Polysomnography (PSG)
The PSG recordings included EEG, electrooculogram, submental electromyography (EMG), nasal-oral temperature, nasal pressure, chest and abdominal respiratory inductive
plethysmography, pulse oximetry, end tidal CO2 or transcutaneous CO2, and anterior tibialis EMG. All studies were staged and events scored according to standard American Academy of Sleep Medicine 2007 scoring guidelines for pediatrics by a registered PSG technologist who was blinded to the treatment status of the child and all scoring was reviewed by a Board Certified Sleep Specialist [8].
Statistics
For each measurement, means and standard deviations were computed separately for those undergoing intervention and for those not undergoing intervention. A two-sample t-test was used to evaluate the statistical significance of the differences in the means for those with and without intervention. Uncorrected p-values were calculated, with statistical significance
A
uthor Man
uscr
ipt
A
uthor Man
uscr
ipt
A
uthor Man
uscr
ipt
A
uthor Man
uscr
assessed using both an unadjusted .05 threshold and a threshold adjusted using the Bonferroni correction, .05/17 = 0.00294. Area under the curve (AUC) was calculated for quantifying the strength of the relationship between the measurement and intervention status, along with a 95% confidence interval. Optimal thresholds for measurements that were significantly different between those with and without intervention (t-test p-value < .05) were determined for maximizing the sum of sensitivity and specificity (i.e. Youden’s index) for discriminating subjects with and without intervention.
All subjects with available measurements were utilized in these analyses; subjects having missing data for a particular measurement excluded from that analysis.
Results
Seventeen subjects were evaluated for this study. Four subjects received surgical intervention while 13 did not. All had geometric and CFD modeling. Fifteen had polysomnograms completed; 2 did not due to urgent need for airway management. Mean age of the subjects was 60.5 months; 47% were male. There was no significant difference in patients who underwent intervention versus those who did not with respect to prematurity, age, BMI, chronic lung disease, gastro-esophageal reflux disease, or other health problems. See Supplemental Information.
A number of geometric variables significantly discriminated those who received surgical intervention compared to those who did not: ASG (the cross-sectional area of the subglottis), RASG (the ratio of the cross-sectional area of the subglottis to the midtrachea); AS(ASG) (the atlas score of the ASG ) and the PR (ASg) (predicted percent relative reduction of the ASG) (Table 1). The two parameters most sensitive at discriminating the need for
intervention after Bonferoni correction were the RASG and PR(ASG ), p = 0.0002 for both parameters.
All of the CFD variables discriminated those who received intervention versus those who did not (Table 2). After the Bonferoni correction, the PR(DSG), (predicted percent relative reduction of the DSG), was most effective at discriminating the need for intervention.
Statistically, sleep studies were poor discriminators for surgical intervention (Table 3). The only sleep parameter that was sensitive at detecting the need for intervention was the respiratory effort related arousals index, but this did not maintain significance after the Bonferoni correction (p = 0.0109),
Discussion
The most common method of grading the severity of SGS in the pediatric population is the Cotton-Myer system[9]. This endoscopically based system classifies subglottic stenosis into 4 grades: Grade I, 0–50% stenosis; Grade II, 50–70% stenosis, Grade III, 70–99% stenosis, and Grade IV, 100% stenosis. This system is semi-quantitative as the airway is sized by placing sequentially sized endotracheal tubes into the stenotic region, providing an
approximate measure of airway diameter in 0.6–0.8 mm increments (typical size differences between endotracheal tube sizes for pediatric patients) [9]. The aim of our study was to
A
uthor Man
uscr
ipt
A
uthor Man
uscr
ipt
A
uthor Man
uscr
ipt
A
uthor Man
uscr
identify novel, objective, quantitative measures as part of clinical practice and determine if these measures correlate with current treatment decision making.
We have presented several computational methods that offer possible alternatives or enhancements to the Cotton-Myer score. First, we calculated the intra-patient ratio of the child’s sub-glottic area to that of the mid-trachea, (RASG). The RASG is essentially a CT based, quantitative Cotton-Myer score utilizing the patient’s own mid-trachea as a surrogate for the expected normal subglottis. We note that the trachea of a SGS patient may not be the same size of the subglottis in normal patients and may therefore not exactly duplicate the Cotton-Myer measurement or estimation performed by the clinician. It is not surprising that this RASG score was smaller in patients who received surgery versus those who did not.
In an effort to use population based normative data for comparison to diseased subjects, we created the Pediatric Airway Atlas. This is a compilation of airway geometries from radiographically normal children who received regional CT scans for reasons other than airway problems. We used this database to create two additional measures: the Atlas Score of the Cross-sectional Area of the Subglottis (AS(ASG)) and the Predicted Percent Relative Reduction of the Area of the Subglottis (PR(ASG)). In this study we found that most population-normalized measures failed to achieve the significance of the simple geometric ratio RASG. The exception was the PR(ASG) score, which also reached the level of
significance with the Bonferoni correction. This may be a reflection of the small size of the study (need for an increased number of patients with SGS and/or control patients). It may also be that the AUC or sensitivity for RASG at 0.98 is difficult if not practically improbable to improve upon without employing extraordinary means.
CFD results also significantly correlated with treatment decisions, with population based CFD-derived PR(DSG) displaying statistical significance. Interestingly, the PR(DSG) had a correlation superior to the simple ratio RDSG, suggesting that population based methods of comparison may be useful and deserve further study. Ultimately, we are interested in establishing measures that improve and help standardize decision making in patients with airway obstruction; follow up studies will need to be designed to correlate our measures across broader populations and with patient outcomes.
The majority of the PSG parameters did not correlate with the determination for intervention in this study. The only parameter that differentiated the two groups was the respiratory effort related arousals index (p = 0.0109). This correlation did not maintain significance after Bonferroni correction while geometric and CFD measures maintained significance. This study is small and the number of variables examined large. It is possible that larger numbers of subjects or investigations which focus on polysomnography may impact or modify these findings.
Assessment of SGS is classically performed utilizing endoscopy with or without airway sizing utilizing endotracheal tubes of known diameter. The final classification (whether utilizing the Cotton-Myer, McCaffrey or other grading system) is, at best, semi-quantitative and at times subjective. In addition, the decisions regarding surgical intervention for SGS can vary widely based on physician, facility, and patient factors. While there are published
A
uthor Man
uscr
ipt
A
uthor Man
uscr
ipt
A
uthor Man
uscr
ipt
A
uthor Man
uscr
series on surgical outcomes for lesions of varying severity mainly from single institutions [10, 11], there are clearly no guidelines or consensus on how best to manage these children based on objective measures. Objective, discrete data regarding the airway could potentially aid in decision making in the care of children with SGS.
In the current study, imaging tools (CT scans of the neck) were used for the creation of 3-dimensional airway models and computational fluid dynamic modeling. Preliminary, putative cutoffs were determined and parameters were set that defined which patients received surgical intervention. Computational modeling has the potential to provide objective measurements that guide decision making; however, the current data represent a small, single site, retrospective study. Further study is needed involving multiple centers to provide additional information regarding the utility of this tool and others as a possible aid to treatment decision making.
An additional limitation of this study is that the measurements were performed in a static state and not dynamic. Given that the majority of subglottic stenoses are due to
predominantly fixed and not dynamic lesions, this limitation is less likely an issue for the current study. We attempted to ameliorate the effects of a dynamic trachea by measuring over a range of mid-trachea and utilizing population based methods. Other forms of airway obstruction are dynamic in nature, and it remains to be seen which imaging modality (or combination of modalities) including cine-MRI, cine-CT, anatomic Optical Coherence Tomography, and/or quantitative endoscopy will provide the best method to quantitatively characterize the dynamic airway. Finally, selection bias may exist based on the study inclusion criteria in that patients had to be scheduled for endoscopic airway evaluation (thereby eliminating those with more severe or very mild disease) and the ability to comply with study visits and procedures (possibly leading to selection of patients with higher socio-economic status).
Conclusion
A number of geometric and CFD variables were sensitive at determining which patients with subglottic stenosis received surgical intervention versus those who did not.
Polysomnography was less helpful at making this discrimination. This study is limited by its small, retrospective, single institution nature. Nonetheless, discrete, quantitative assessment of the pediatric airway was performed, yielding preliminary data regarding possible objective thresholds for surgical versus non-surgical treatment of disease. Further studies to validate these findings and possibly optimize treatment threshold recommendations are warranted. In addition, the application of these technologies utilizing other imaging and/or quantitative data capturing techniques, especially with the myriad forms of airway obstruction, are warranted.
Supplementary Material
Refer to Web version on PubMed Central for supplementary material.
A
uthor Man
uscr
ipt
A
uthor Man
uscr
ipt
A
uthor Man
uscr
ipt
A
uthor Man
uscr
References
1. Bluestone CD, Stool SE, Alper CM, Arjmand EM, Casselbrant ML, Dohar JE, Yellon RF, et al. Pediatric Otolaryngology (4). 2002; 1165:1519–20.
2. Hong, Y., et al. A pediatric airway atlas and its application in subglottic stenosis. 2013 Ieee 10th International Symposium on Biomedical Imaging; 2013; p. 1206-1209.
3. Ramsay, JO., Silverman, BW. Functional Data Analysis. New York: Springer; 2005. 4. Hong Y, et al. Statistical atlas construction via weighted functional boxplots. Medical Image
Analysis. 2014; 18(4):684–698. [PubMed: 24747271]
5. Mylavarapu G, et al. Validation of computational fluid dynamics methodology used for human upper airway flow simulations. Journal of Biomechanics. 2009; 42(10):1553–1559. [PubMed: 19501360]
6. Mihaescu M, et al. Large Eddy Simulation and Reynolds-Averaged Navier-Stokes modeling of flow in a realistic pharyngeal airway model: An investigation of obstructive sleep apnea. Journal of Biomechanics. 2008; 41(10):2279–2288. [PubMed: 18514205]
7. Mitran, S. qPAFlow. 2014. http://mitran-lab.amath.unc.edu:8081/subversion/VirtualLung/qPAflow/
8. Iber, C., et al. AASM Manual for the Scoring of Sleep and Associated Events: Rules, Terminology and Technical Specifications. 1. Westchester, Illinios: American Academy of Sleep Medicine; 2007. 9. Myer CM, Oconnor DM, Cotton RT. Proposed grading system for subglottic stenosis based on
endotracheal-tube sizes. Annals of Otology Rhinology and Laryngology. 1994; 103(4):319–323. 10. White DR, et al. Pediatric cricotracheal resection - Surgical outcomes and risk factor analysis.
Archives of Otolaryngology-Head & Neck Surgery. 2005; 131(10):896–899. [PubMed: 16230593] 11. Hartnick CJ, et al. Surgery for pediatric subglottic stenosis: Disease-specific outcomes. Annals of
Otology Rhinology and Laryngology. 2001; 110(12):1109–1113.
A
uthor Man
uscr
ipt
A
uthor Man
uscr
ipt
A
uthor Man
uscr
ipt
A
uthor Man
uscr
Figure 1. 1090 Cross-Section 2
Segmented airway geometry from a control patient CT scan with computed centerline locations displayed as black dots. Cross-sectional areas used in this study were computed at the subglottis (ASG) and midtrachea (AMT). These locations also serve for the derived hydraulic diameters DSG and DMT.
A
uthor Man
uscr
ipt
A
uthor Man
uscr
ipt
A
uthor Man
uscr
ipt
A
uthor Man
uscr
Figure 2. Atlas Score Computation
The Pediatrics Airways Atlas is used to compare the patient airway geometry against the geometry of a normal population, with segmentation for age provided. The cross sectional area of the patient airway (blue dashed line) is plotted along the path length extending from the true vocal cords to the tracheal carina [4], while the maximum, minimum and median curves for the age-normalized population are plotted as grey curves. These are used to evaluate the patient geometry through the measures Atlas Score (AS) and Predicted Percent Relative Reduction (PR), as described in text.
A
uthor Man
uscr
ipt
A
uthor Man
uscr
ipt
A
uthor Man
uscr
ipt
A
uthor Man
uscr
Figure 3. Computational Fluid Dynamics (CFD) Outline
Typical GPU-implemented lattice Boltzmann method (LBM) result showing pressure drops and vorticity along flow streamlines. Streamlines start from lines traversing a spherical region enclosing the nose on the surface of which ambient pressure boundary conditions are imposed. The increase in vorticity and associated pressure drop in the stenotic region is readily apparent.
A
uthor Man
uscr
ipt
A
uthor Man
uscr
ipt
A
uthor Man
uscr
ipt
A
uthor Man
uscr
A
uthor Man
uscr
ipt
A
uthor Man
uscr
ipt
A
uthor Man
uscr
ipt
A
uthor Man
uscr
ipt
T ab le 1 Intervention after scan: Y
es vs. No for Geometrical measures.
Inter
v
ention - Y
es
Inter
v
ention - No
Raw Z scor e Raw Z scor e t-test p-v alue sig . A
UC (95% CI)
Optima l cutoff Inter
v - Y
es mean sd mean sd mean sd mean sd ASG 11.58 11.15 −1.10 0.75 32.94 12.11 0.34 0.82 0.0196 * 0.90 (0.70–1.00) <9.72 RA SG 0.29 0.05 −1.09 0.32 0.53 0.15 0.34 0.89 0.0002 ** 0.98 (0.93–1.00) <0.37 ASG,FN −0.71 0.73 −0.74 0.75 0.22 0.95 0.23 0.98 0.0796 0.83 (0.62–1.00) <0.15 AS(A SG ) −0.65 0.22 −1.14 0.56 −0.06 0.32 0.35 0.83 0.0038 * 0.96 (0.87–1.00) <−0.32 PR(A SG ) 0.66 0.06 1.10 0.31 0.37 0.18 −0.34 0.88 0.0002 ** 0.98 (0.93–1.00) >0.57 * signif
icant at .05, not at .05/17 = 0.00294
**
signif
icant at .05/17 = 0.00294
ASG
Cross-sectional area of the subglottis, A
MT
cross-sectional area of the midtrachea, RA
SG
cross-sectional area ratio: A
SG
to A
MT
, A
SG,FN
Cross-sectional area of the subglottis, Flo
w Normalized,
AS(A
SG
) atlas_score of the A
SG
, PR(A
SG
) predicted percent relati
v
e reduction of the A
SG
Note: FN of quantity cited is the statistical analysis applied after remo
ving age and weight (tar
get flo
w rate)
ef
fect. See te
A
uthor Man
uscr
ipt
A
uthor Man
uscr
ipt
A
uthor Man
uscr
ipt
A
uthor Man
uscr
ipt
T ab le 2 Intervention after scan: Y
es vs. No for computational fluid dynamics v
ariables
Inter
v
ention - Y
es
Inter
v
ention - No
Raw Z scor e Raw Z scor e t-test p-v alue sig . A
UC (95% CI)
Optimal cutoff Inter
v - Y
es mean sd mean sd mean sd mean sd
η1FN
1.03 0.54 1.06 0.56 −0.32 0.85 −0.33 0.88 0.0055 * 0.92 (0.77–1.00) >0.41
η2FN
0.65 0.37 0.68 0.39 −0.20 1.01 −0.21 1.05 0.0237 * 0.79 (0.56–1.00) >0.08 DSG 3.17 1.51 −1.21 0.84 6.02 1.29 0.37 0.72 0.0231 * 0.90 (0.70–1.00) <3.31 RD SG 0.50 0.08 −0.92 0.78 0.71 0.10 0.28 0.90 0.0039 * 0.96 (0.87–1.00) <0.60 DSG,FN −0.90 0.76 −1.21 0.59 0.28 0.87 0.37 0.78 0.0419 * 0.85 (0.63–1.00) <−0.73 AS(D SG ) −0.43 0.22 −1.15 0.81 −0.02 0.21 0.35 0.77 0.0232 * 0.94 (0.81–1.00) <−0.11 PR(D SG ) 0.48 0.08 1.23 0.56 0.25 0.11 −0.38 0.77 0.0025 ** 0.96 (0.87–1.00) >0.37 * signif
icant at .05, not at .05/17 = 0.00294
**
signif
icant at .05/17 = 0.00294
η1FN
η
1 flo
w normalized,
η2FN
η
2 flo
w normalized, D
SG
h
ydraulic diameter of the subglottis, D
MT
h
ydraulic diameter of the midtrachea,
DSG,FN
Hydraulic Diameter of the subglottis, Flo
w
Normalized, RD
SG
h
ydraulic diameter ratio of the D
SG
to D
MT
, AS(D
SG
) Atlas score of the D
SG
, PR(D
SG
) predicted percent relati
v
e reduction of the D
A
uthor Man
uscr
ipt
A
uthor Man
uscr
ipt
A
uthor Man
uscr
ipt
A
uthor Man
uscr
ipt
T ab le 3 Intervention after scan Y
es vs. No for Polysomnograph
y measures.
Inter
v
ention - Y
es
Inter
v
ention - No
mean sd mean sd t-test p-v alue A
UC (95% CI)
Optimal cutoff Inter
v - Y
es AHI 1.05 0.21 3.13 4.8 0.1454 0.59 (0.32–0.87) <0.85 RERA_inde x 0.55 0.07 0.24 0.3 0.0109 * 0.79 (0.56–1.00) >0.45 max_etco2 56 4.24 49.72 5.66 0.2343 0.83 (0.52–1.00) >52.5 avg_sao2 97 0.28 96.44 1.38 0.2212 0.48 (0.19–0.77) >97.25 min_spo2 90 0 89.49 3.64 0.6241 0.54 (0.28–0.80) >89.45 * signif
icant at .05, not at .05/17 = 0.00294
**
signif
icant at .05/17 = 0.00294
AHI apnea/h
ypopnea inde
x per hour
, RERA inde
x respiratory e
v
ent related arousals inde
x, max_etco2 maximum end tidal CO2 in torr
, a
vg_sao2 a
v