Cover Page
The handle http://hdl.handle.net/1887/29023 holds various files of this Leiden University dissertation
Author: Bashlakov, Dmytro
Title: Interaction of oxygen and carbon monoxide with Pt(111) at intermediate pressure and temperature : revisiting the fruit fly of surface science
Interaction of Oxygen and Carbon Monoxide with
Pt(111) at Intermediate Pressure and Temperature:
Revisiting the Fruit Fly of Surface Science
Proefschrift
ter verkrijging van
de graad van Doctor aan de Universiteit Leiden,
op gezag van de Rector Magnificus prof. mr. C.J.J.M. Stolker, volgens besluit van het College voor Promoties
te verdedigen op dinsdag 14 october 2014 klokke 11:15 uur
door
Dmytro Bashlakov
geboren te Ossora
Promotiecommissie
Promotor: prof. dr. M.T.M. Koper Co-promotors: dr. A.I. Yanson
dr. L.B.F. Juurlink
Overige leden: dr. I.M.N. Groot
prof. dr. B.E. Nieuwenhuys prof. dr. J. Brouwer
prof. dr. B. Dam (TU Delft)
Contents
Chapter 1 Introduction and literature overview……… 1.1. Introduction………. 1.2. Catalysis……….. 1.3. Surface science approach……… 1.3.1. Oxygen interaction with Pt(111)……….. 1.3.2. Carbon monoxide interaction with Pt(111)……….. 1.3.3. CO oxidation on Pt(111)………...
Chapter 2 Experimental instruments and techniques……… 2.1. Omicron system………... 2.1.1. Vacuum system………. 2.1.2. Auger electron spectroscopy………. 2.1.3. Low energy electron diffraction……… 2.1.4. Scanning tunneling microscopy………... 2.1.5. Sample preparation………... 2.2. Lionfish……….……….. 2.2.1. Vacuum system………. 2.2.2. Temperature programmed technique………... 2.2.3. Sample preparation……….
Chapter 3 Subsurface oxygen on Pt(111)………. 3.1. Introduction………. 3.2. Experimental section………... 3.3. Results and discussion………
Chapter 4 Carbon monoxide oxidation on the Pt(111) surface at room temperature: STM and LEED studies……. 4.1. Introduction………. 4.2. Experimental section………... 4.3. Results and discussion………
4.3.1. STM and LEED………... 4.3.2. Mass spectrometry………... 4.3.3. Effect of CO poisoning on oxygen adsorption……. 4.4. Conclusions………...
Chapter 5 Correlating surface activity and STM current transients during CO oxidation on Pt(111)... 5.1. Introduction………... 5.2. Measurement approach and technique….………... 5.3. Experiment and Results……….………... 5.4. Discussion………... 5.5. Summary………...
Summary………
Samenvatting………...
Curriculum Vitae………..
53 54 55 58 58 65 67 69
73 74 75 77 84 85
89
91
Chapter 1
1.1. Introduction
Evolution and industrialization of human society is tightly connected to the use of metals. The first countries in the modern meaning of this word (distinct borders, defined policy and society organization) appear in the Bronze Age, when humans learned how to smelt and handle copper. Since then, metals began to be used not only for “primitive work” but also for specific “smart” applications. Besides being good construction materials due to their strength and plasticity, their unique electronic properties allow then to be used in functional devices. It is hard to imagine the functioning of the Large Hadron Collider without the niobium-titanium alloy used in the superconducting magnets or the development of modern computers without hard disc drives employing the giant magneto-resistance effect for information storage.
The application of metals as catalysts revolutionized the emerging chemical industry as well. Steam reforming is one of many examples of current industrial scale production of chemicals. Here, nickel is used for the production of hydrogen from fossil fuels and water. This reaction is the main source of hydrogen for ammonia production in the Haber-Bosch process [1]. In this nitrogen fixation reaction, NH3 is synthesized from
nitrogen and hydrogen with the help of iron as a catalyst. As the initial component for artificial fertilizers, ammonia now “feeds” the continually growing population of the planet. A major advantage of using metals in industrial catalysis is that they are present as a solid during the reaction. It simplifies technological processes for the separation of products, which are typically present in the gas or liquid phase.
Platinum is part of the puzzle for developing a closed materials cycle- renewable energy system. Its application in fuel cells already provides an alternative for combustion engines for transportation. In dye-sensitized solar cells platinum is used as a cathode. These cells are more attractive for household applications than semiconductor analogs due to the number of advantages such us smaller weight, lower production costs, and ability to work al low light intensity [3]. The real challenge for fundamental science now is to answer the question: “Why are some materials so unique?” Fully understanding the physics and chemistry may eliminate the need for expensive catalytic materials such as platinum by substitution with cheaper analogs providing similar performance.
This thesis uses the surface science approach to address questions regarding the interaction of oxygen with platinum and its subsequent reaction with carbon monoxide. A Pt(111) single crystal surface is used as a model for the catalyst. Chapter 1 provides an overview of the literature on the subject. The description of employed experimental techniques and their backgrounds are presented in Chapter 2. Chapter 3 discusses the adsorption of oxygen on Pt(111) at various temperatures and its role in the oxidation of carbon monoxide. Chapter 4 gives an atomic scale insight into the reaction between adsorbed oxygen and carbon monoxide for different ratios of oxygen and carbon monoxide pressures. In Chapter 5, the reaction between CO and oxygen on Pt(111) was used to register noise in tunneling current due to diffusion and recombination of molecules on the catalytically active surface, to draw conclusions on the most likely rate-limiting step in the process.
1.2. Catalysis
As stated previously, catalysis plays a major role in the industrial production of chemicals. The additional component needed to increase the reaction rate is called “catalyst”. A catalyst is involved temporarily in the chemical path of the reaction but does not appear as a final product. The principal scheme of a catalytic reaction can be described with the potential energy diagram (Figure 1.1) where the initial and the final states of the system are presented for the reactants A and B and the reaction product PAB,
respectively. In a non-catalyzed reaction, the final state is reached by overcoming a potential energy barrier with activation energy Ea. The
reaction with smaller activation energy Ea. In such case, a single reaction
event proceeds via binding both or one of the reactants A and B to the catalyst first. Subsequently, reaction between reactants occurs with an activation energy smaller than for the non-catalyzed reaction. Finally, the formed product PAB detaches from the catalyst so that the latter returns to its
initial state and the next binding-reaction-detaching cycle can proceed.
Figure 1.1. Potential energy diagram for a non-catalyzed and catalyzed reaction (reproduced from [4]).
There is a continuous search for better catalysts in order to optimize existing chemical processes as well as to introduce new ones. The performance of the catalyst is characterized by its activity, selectivity and stability. The meaning of these properties can also be explained by using the simple picture of the potential energy diagram:
i. Activity of the catalyst describes how much product can be produced in the catalytic reaction over a period of time. The amount of product is determined by the activation energy Ea in such a way that the time
needed for a single reaction reduces with the lowering of Ea. As a
consequence, a catalyst with lower activation energy will convert more species A and B into PAB over a certain period of time and will show
ii. If the desired product of reaction is the chemical PAB, formation of
different species (PBB, PAA, PABA, etc.) leads to an ineffective use of the
feedstock. If the catalyst serves to reduce the activation energy only for the desired product (PAB) while the reaction path for other species
remains unchanged or becomes more difficult, the catalyst selectively
accelerates the reaction for useful product.
iii. Stability indicates how long a catalyst can serve before loosing its
catalytic properties. Theoretically, the reaction
cycle can be repeated indefinitely, however, the side products (like P AB catalyst
P
B
A
BB,
PAA, PABA, etc.) can also bind to the catalyst. If this chemical bond is
strong, all active sites will be blocked after some time by the side products and the catalyst will loose its activity. A stable catalytic performance can also be influenced by the morphological changes of a catalyst.
The field of catalysis can be roughly divided in two parts. In homogeneous catalysis the reactant and catalyst are present in the same phase. In heterogeneous catalysis the catalyst and reactants are in different phases. To a large extent, industrial catalysis relies on heterogeneous catalysis where metal surfaces serve to bind reactants from the gaseous or liquid phase. A concept first introduced by Irving Langmuir [5] states that the surface serves as a two-dimensional lattice for molecular adsorption. The adsorbed molecules or atoms can diffuse across the surface approaching each other for reaction or desorb back into the gas/liquid. The rate of reaction strongly depends on the adsorption energy (i.e. the energy levels of adsorbed A and B in Figure 1.1) of the molecules to the surface and is described by the Sabatier principle [1]: The interaction of the adsorbants and the surface should be just right to obtain maximum reaction rate (activity). If the molecules are bound too weakly, they can leave the surface before reaction occurs. For very high adsorption energies, molecules will accumulate on the surface and block the active sites for adsorption of the new reactants, thus causing deactivation of the catalyst.
1.3. Surface science approach
of reaction (temperature, pressure, reactants composition, etc.). The whole system, however, remains a “black box” for understanding fundamental steps of reaction. This is mostly due to the complex structure of the catalyst. Catalytically active nanoparticles are not uniform and are generally deposited onto an inactive support that often has little or no long-range structure. It is difficult to separate the contributions to the overall reaction rate from different crystal facets of the nanoparticles. The surface science approach studies catalytic reactions on well defined single crystal surfaces (Figure 1.2). In case of reactants present in the gas phase, the single crystal is cleaned and stored under UHV conditions (~10-10 mbar) prior to its exposure to the reactants.
Figure 1.2. Potential energy diagram in direction perpendicular to the surface (bottom left) and along the surface (bottom right) for an adsorbate on a single crystal surface (top right), reproduced from [7].
chemical bond between molecules/atoms and surface (chemisorption). The position of the minimum in the energy diagram defines the distance of a molecule from the surface in the adsorbed state, while the decrease in the potential energy relative to the state for infinite distance z between adsorbate and the surface can be seen as the adsorption energy Ea of this
molecule.
The binding energy of an adsorbate depends on its position on the surface [8]. The surface can be seen as a matrix of adsorption sites with largest adsorption energies (lowest potential energies) separated by a potential energy barrier (Ed). To move across the surface, an adsorbate has
to jump over this potential barrier. Figure 1.2 represents a potential energy surface for the diffusion of an adsorbate along the x direction. The average time τ an adsorbate stays in one adsorption site can be estimated as [7]:
)
exp(
~
kT
E
d
,so, that at low temperatures (kT<<Ed), an adsorbate will stay in the
adsorption site almost indefinitely. For kT≥Ed the residence time of
adsorbate is limited and it can move across the surface if the nearest adsorption sites are not all occupied. If an adsorbed particle is surrounded by others, it will stay in the same adsorption site, unless it has energy higher than Ea to return into the gas phase (desorb) or react with a neighbor. When
all adsorption sites are occupied, the surface has reached the saturation coverage θ=na/ns, where na and ns are the maximum density of adsorbed
particles and the density of atoms on the surface of the catalyst, respectively. The previous description is valid if there is no possibility for recombinative desorption or other forms of reaction. Otherwise, when Ea>kT≥Ed adsorbed molecules/atoms can approach and react with each
other by forming a new molecule. The latter will leave the surface if the condition Eanew molecule<kT is valid.
As mentioned above, the research subjects of this thesis are the adsorption of oxygen and the reaction between oxygen and carbon monoxide on the Pt(111) surface. Detailed knowledge about adsorption sites of O and CO and the mechanism of chemisorption is essential to understand the reaction path of O and CO reacting to CO2. A brief summary of the
1.3.1. Oxygen interaction with Pt(111)
The interaction of molecular oxygen with platinum can be illustrated with the energy diagram of Figure1.3a [6, 9]. In the final state of adsorption O2 dissociates into two atoms by going through the intermediate state of
chemisorbed O2. Indirectly, this path was observed first in TPD experiments
for a cold Pt(111) surface exposed to O2 [10, 11]. A subsequent linear
increase of the sample temperature showed two desorption peaks for oxygen. The first desorption peak at 160 K was assigned to molecularly chemisorbed oxygen. A second broad peak with a maximum at ~750 K was assigned to recombinative desorption of atomic oxygen. Using electron energy loss spectroscopy (EELS) it was confirmed that two different types of oxygen are present on Pt(111) at temperatures above 160 K [12-14]. Insight into the dissociation mechanism was delivered later by STM experiments. These showed that O2 adsorbs on bridge sites of platinum prior
to dissociation and that oxygen atoms occupy three-fold hollow fcc sites after dissociation [15-17].
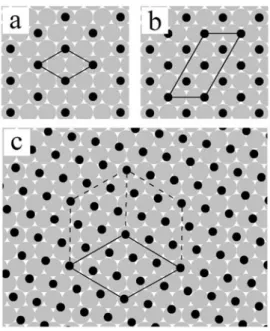
Figure 1.3. a) Energy diagram for dissociative adsorption of diatomic molecule (O2). b) O-p(2x2)-Pt(111) surface structure with 0.25 ML coverage for the layer of atomic oxygen (black circles) dissociatively adsorbed onto the (111) platinum crystal plane (grey circles).
agreement with STM measurements [15] showing that oxygen atoms prefer to organize into p(2x2) islands indicating “an indirect attractive O-O interaction mediated through the electronic system of the substrate” [7].
Above room temperature, the mobility of platinum atoms starts to play a role in the interaction of platinum with oxygen [21, 22]. STM measurements showed significant restructuring (roughening) of Pt(110) and Pt(111) surfaces in an oxygen atmosphere of 1 bar at temperatures above 400 K [23, 24]. XRD studies reveal the formation of α-PtO2 on both
crystallographic surfaces at identical conditions [25, 26]. This oxide structure on Pt(111) was found to be stable for O2 pressures down to 1 mbar
[26] indicating that not only temperature but also oxygen pressure is important for the oxide formation. Although most studies for the O2-Pt(111)
system performed under high vacuum conditions did not focus on oxygen adsorption at temperatures above 300 K, some reported that at enhanced temperatures the amount of oxygen adsorbed on the Pt(111) surface is three to five times higher then expected from the O-p(2x2) layer [27-29]. Since platinum is a primary catalyst for oxidation reactions [1], an understanding of the alteration of catalytic properties of Pt(111) by high levels of surface oxidation is required [30, 31].
1.3.2. Carbon monoxide interaction with Pt(111)
Carbon monoxide chemisorbs on platinum as a diatomic molecule without dissociation [32] via formation of a chemical bond between carbon and platinum atoms [33]. The energy of this bond is rather low compared to the adsorption energy for atomic oxygen [34, 35]. Carbon monoxide desorbs from the Pt(111) surface at temperatures between 320-350 K, as derived from temperature programmed desorption (TPD) experiments [36-38]. EELS [38, 39] and infrared spectroscopy measurements [40, 41] reveal two types of adsorption sites: on-top of platinum atoms and on bridge sites between two platinum atoms. The difference between the CO adsorption energy for on-top and bridge sites is small [34, 42]. This causes high mobility of carbon monoxide on the platinum surface [34, 37]. The latter was noticed first in LEED experiments [32, 36]: the diffraction patterns from an unsaturated CO-(√3x√3)R30º-Pt(111) layer (Fig.1.4a) with 1/3 ML coverage became visible only after the sample was cooled sufficiently (150-170 K) [43]).
coverage of ~0.7 ML can be reached, depending on the adsorption conditions [36]. At high vacuum conditions (10-8-10-7 mbar) and room
temperature, the equilibrium saturation coverage is 0.5 ML. The CO layer is ordered into a commensurate c(4x2) structure. This was initially concluded from LEED data [33] and later confirmed by scanning tunneling microscopy (STM) measurements [45]. In this structure, equal numbers of CO molecules adsorb on two high symmetry sites (on-top and bridge) as illustrated in Figure 1.4b. A coverage of CO molecules above 0.5 ML can be obtained under the high vacuum conditions by cooling the platinum surface below 170 K in a CO atmosphere [36, 38, 41] or by increasing the CO pressure above 10-6 mbar at room temperature [46]. Such treatment leads to restructuring of the c(4x2) layer into an incommensurate layer in which CO molecules are compressed closer to one other [47, 48] and the repulsive CO-CO interaction forces them to move from the high symmetry adsorption sites [47-49], as shown in Figure 1.4c.
Figure 1.4. Platinum surface (grey circles) with carbon monoxide (black circles) adsorbed into: a) (√3x√3)R30º structure with 1/3 ML coverage; b) c(4x2) structure with 0.5 ML coverage; c) incommensurate structure with CO coverage ≈ 0.56 ML.
1.3.3. CO oxidation on Pt(111)
adsorbed on the surface when the reaction occurs. The reaction steps can be described with following three equations:
CO→COads (1.1);
O2→2Oads (1.2);
Oads+COads→CO2 (1.3).
Reaction step (1.2) is sensitive to the presence of CO on the surface in the way that increasing the CO coverage inhibits oxygen dissociation [52]. On the other hand, the oxygen-covered Pt(111) surface is open for CO adsorption [53, 54]. Therefore, in coadsorption/titration experiments oxygen is the first component to be adsorbed on the surface [50, 53-58]. Gland and Kollin [55] were the first to demonstrate that reaction step (1.3) is thermally activated. The formation of CO2 happens at temperatures above 250 K. The
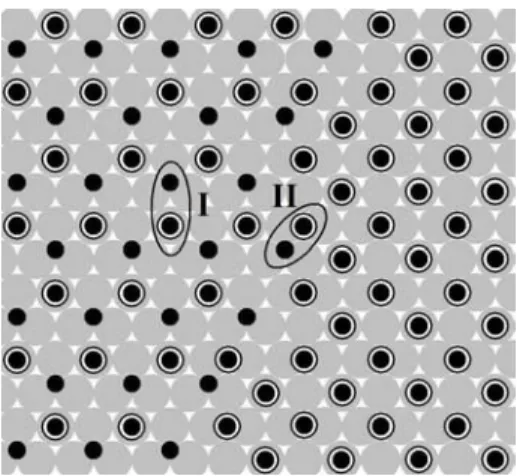
activation energy for this reaction step was found to be different for a high oxygen coverage (Ea≈0.5 eV) compared to a low coverage of oxygen and CO (Ea≥1eV) [50, 54-58]. Using DFT calculations Alavi et al. [59] obtained a potential barrier of 1eV for the recombination reaction between CO and the oxygen atom adsorbed in the configuration (I) shown in Figure 1.5.
Figure 1.5. p(2x2) oxygen layer coadsorbed with CO (left part) in contact with c(4x2) layer of CO (right part) The oxygen atoms and CO molecules are shown by small black circles and white and black circles, respectively.
This brief overview shows that the general mechanism for the CO oxidation is well understood: two species pre-adsorbed on specific adsorption sites come together and associate. However, several aspects require more attention to form a complete atomistic picture, such as how the formation of the platinum surface oxide at elevated temperature [30, 31] impacts on CO oxidation and how the CO poisoning [53-58] ceases the steady state oxidation reaction.
Chapter 3 deals with the first question. The experiment, which combines Temperature Programmed Reaction Spectroscopy (TPRS), Low Energy Electron Diffraction (LEED) and Scanning Tunneling Microscopy (STM) measurements, demonstrates that the Pt(111) surface can dissociatively adsorb more oxygen then 0.25 ML. This happens when the surface is exposed to oxygen at high vacuum conditions and elevated temperatures (400-600 K). Part of the oxygen migrates into the subsurface region. Interestingly, subsurface oxygen shows a much lower reactivity toward the oxidation of co-adsorbed CO, and moreover it does not influence the oxidation properties of the surface-bound oxygen.
In Chapter 4 oxidation of CO is studied at room temperature with STM and LEED for different ratios of oxygen and CO pressures in the gas phase. It will be shown there that the difference in the adsorption mechanisms of O2 and CO, leads to a different dynamics of CO poisoning
of the Pt(111) surface. For ratios close to the CO poisoning regime, the surface reaction causes the formation of a complex surface structure consisting of separated islands of ordered oxygen atoms and disordered regions containing carbon monoxide. With excess CO in the gas mixture, the surface becomes covered by a CO layer which blocks O2 dissociation.
With excess O2, the surface is covered by a p(2x2) oxygen layer, which
remains active for CO→CO2 conversion.
The attempt to measure the noise signature in the tunneling current during the surface reaction is described in Chapter 5. Based on the idea that recombination and diffusion of adsorbed species should cause changes in the local density of states on the surface, it was assumed that a higher noise level will be detected for the platinum surface brought in contact with gaseous mixture of CO and O2 than for the platinum surface in vacuum.
Indeed, an enhanced noise level compared to bare surface was observed experimentally for a Pt(111) surface in contact with O2 and with a mixture
of CO and O2, suggesting that the mobility of O on the surface is
References:
[1] B. K. Hodnett, F. J. J. G. Janssen, J. W. Niemantsverdriet, V. Ponec, R. A. van Santen, and J. A. R. van Veen, Catalysis: An Intagrated Approach, Elsevier Science, Amsterdam, 2000.
[2] J. N. Armor, Applied Catalysis A: General 176 (1999) 159. [3] M. Gratzel, Nature 414 (2001) 338.
[4] I. Chorkendorff and J. W. Niemantsverdriet, Concept of modern catalysis and kinetics, Wiley-VSH, Weinheim, 2003.
[5] I. Langmuir, Journal of the American Chemical Society 40 (1918) 1361. [6] J. E. Lennard-Jones, Transactions of the Faraday Society 28 (1932) 333. [7] G. Ertl, Reactions at solid surfaces, Wiley, Berlin, 2009.
[8] K. W. Kolasinski, Surface Science: Foundation of Catalysis and Nanoscience, Wiley, West Chester, 2008.
[9] H. P. Bonzel and R. Ku, Surface Science 40 (1973) 85. [10] J. L. Gland, Surface Science 93 (1980) 487.
[11] P. R. Norton, Surface Science 47 (1975) 98.
[12] N. R. Avery, Chemical Physics Letters 96 (1983) 371. [13] P. Nolan, The Journal of Chemical Physics 111 (1999) 3696.
[14] H. Steininger, S. Lehwald, and H. Ibach, Surface Science 123 (1982) 1. [15] B. C. Stipe, M. A. Rezaei, and W. Ho, The Journal of Chemical Physics
107 (1997) 6443.
[16] J. Wintterlin, R. Schuster, and G. Ertl, Physical Review Letters 77 (1996) 123.
[17] T. Zambelli, J. V. Barth, J. Wintterlin, and G. Ertl, Nature 390 (1997) 495. [18] K. Mortensen, C. Klink, F. Jensen, F. Besenbacher, and I. Stensgaard,
Surface Science 220 (1989) L701.
[19] P. R. Norton, J. A. Davies, and T. E. Jackman, Surface Science 122 (1982) L593.
[20] J. Yoshinobu and M. Kawai, The Journal of Chemical Physics 103 (1995) 3220.
[21] A. K. Galwey, P. Gray, J. F. Griffiths, and S. M. Hasko, Nature 313 (1985) 668.
[22] C. Ellinger, A. Stierle, I. K. Robinson, A. Nefedov, and H. Dosch, Journal of Physics-Condensed Matter 20 (2008) 5.
[23] B. L. M. Hendriksen and J. W. M. Frenken, Physical Review Letters 89 (2002) 046101.
[24] S. C. Bobaru, Ph.D., Leiden University, The Netherland, Leiden, 2006, p. 129.
[26] M. D. Ackermann, Ph.D., Leiden University, The Netherland, Leiden, 2007, p. 192.
[27] D. Neuhaus, F. Joo, and B. Feuerbacher, Physical Review Letters 58 (1987) 694.
[28] G. N. Derry and P. N. Ross, Surface Science 140 (1984) 165.
[29] G. N. Derry and P. N. Ross, Journal of Chemical Physics 82 (1985) 2772. [30] W. X. Li and B. Hammer, Chemical Physics Letters 409 (2005) 1.
[31] F. Gao, S. M. McClure, Y. Cai, K. K. Gath, Y. Wang, M. S. Chen, Q. L. Guo, and D. W. Goodman, Surface Science 603 (2009) 65.
[32] H. Hopster and H. Ibach, Surface Science 77 (1978) 109.
[33] D. F. Ogletree, M. A. Van Hove, and G. A. Somorjai, Surface Science 173 (1986) 351.
[34] M. Lynch and P. Hu, Surface Science 458 (2000) 1.
[35] Y. Y. Yeo, L. Vattuone, and D. A. King, The Journal of Chemical Physics 106 (1997) 392.
[36] G. Ertl, M. Neumann, and K. M. Streit, Surface Science 64 (1977) 393. [37] C. T. Campbell, G. Ertl, H. Kuipers, and J. Segner, Surface Science 107
(1981) 207.
[38] H. Steininger, S. Lehwald, and H. Ibach, Surface Science 123 (1982) 264. [39] H. Froitzheim, H. Hopster, H. Ibach, and S. Lehwald, Applied Physics A:
Materials Science & Processing 13 (1977) 147.
[40] H. Krebs and H. Lüth, Applied Physics A: Materials Science & Processing 14 (1977) 337.
[41] B. N. J. Persson, M. Tushaus, and A. M. Bradshaw, The Journal of Chemical Physics 92 (1990) 5034.
[42] E. Schweizer, B. N. J. Persson, M. Tüshaus, D. Hoge, and A. M. Bradshaw, Surface Science 213 (1989) 49.
[43] J. S. McEwen, S. H. Payne, H. J. Kreuzer, M. Kinne, R. Denecke, and H. P. Steinruck, Surface Science 545 (2003) 47.
[44] R. T. Vang, E. Laegsgaard, and F. Besenbacher, Physical Chemistry Chemical Physics 9 (2007) 3460.
[45] M. O. Pedersen, M.-L. Bocquet, P. Sautet, E. Legsgaard, I. Stensgaard, and F. Besenbacher, Chemical Physics Letters 299 (1999) 403.
[46] S. R. Longwitz, J. Schnadt, E. K. Vestergaard, R. T. Vang, I. Stensgaard, H. Brune, and F. Besenbacher, The Journal of Physical Chemistry B 108 (2004) 14497.
[47] E. Kruse Vestergaard, P. Thostrup, T. An, E. Lægsgaard, I. Stensgaard, B. Hammer, and F. Besenbacher, Physical Review Letters 88 (2002) 259601.
[48] M. Montano, K. Bratlie, M. Salmeron, and G. A. Somorjai, Journal of the American Chemical Society 128 (2006) 13229.
[50] C. T. Campbell, G. Ertl, H. Kuipers, and J. Segner, The Journal of Chemical Physics 73 (1980) 5862.
[51] G. Ertl, Surface Science 299–300 (1994) 742.
[52] M. Ehsasi, M. Matloch, O. Frank, J. H. Block, K. Christmann, F. S. Rys, and W. Hirschwald, The Journal of Chemical Physics 91 (1989) 4949.
[53] J. L. Gland and E. B. Kollin, Surface Science 151 (1985) 260.
[54] M. Kinne, T. Fuhrmann, J. F. Zhu, C. M. Whelan, R. Denecke, and H. P. Steinruck, The Journal of Chemical Physics 120 (2004) 7113.
[55] J. L. Gland and E. B. Kollin, The Journal of Chemical Physics 78 (1983) 963.
[56] I. Nakai, H. Kondoh, K. Amemiya, M. Nagasaka, T. Shimada, R. Yokota, A. Nambu, and T. Ohta, The Journal of Chemical Physics 122 (2005) 134709. [57] F. Zaera, J. Liu, and M. Xu, The Journal of Chemical Physics 106 (1997) 4204.
[58] J. Wintterlin, S. Volkening, T. V. W. Janssens, T. Zambelli, and G. Ertl, Science 278 (1997) 1931.
Chapter 2
In surface science, experiments are conducted in a well-controlled environment. Ultra high vacuum (UHV) conditions are often used for sample preparation and characterization. Results presented in this thesis were collected using two UHV instruments: The “Omicron” system (Chapters 3, 4 and 5) and the “Lionfish” system (Chapter 3). Both systems contain equipment for cleaning of single crystal surfaces and for characterization with surface sensitive techniques. These techniques are described in this chapter. High purity 16O2 (Messer 5.0), Ar (Messer 5.0),
CO (Air Liquide 4.7), and 18O2 (Cambridge Isotope Laboratories, 97%
isotope purity and ≥99.9 chemical purity) were used for sample cleaning and gas dosing.
2.1 The Omicron system
The Omicron system’s principal surface sensitive technique is Scanning Tunneling Microscopy (STM). Auger Electron Spectroscopy (AES) and LEED are supporting techniques used for surface characterization. The system consists of two UHV chambers, one load lock and a set of manipulators for sample/tip transfer. A custom made gas mixing manifold is connected by separate dosing lines to each of the UHV chambers. The pressure in the gas lines can be reduced to below 10-3 mbar prior to filling them with gases.
2.1.1 Vacuum system
ionization pumps were switched off during sample cleaning and experiments involving oxygen doses.
The preparation chamber is equipped with leak valves and an ion gun for sample cleaning. This includes sputtering with argon ions and subsequent annealing of the sample. Single crystals are mounted in a sample holder with a built-in tungsten filament that faces the back side of the sample. The filament has electrical contacts which are isolated from the rest of the sample holder. It allows for radiative heating and electron bombardment heating from room temperature up to 1200 K. To this purpose, the preparation chamber has a manipulator with electrical connections to the sample holder’s filament and thermocouple.
The analysis chamber is equipped with an Omicron variable temperature (VT) STM, a rear view LEED apparatus (VG RVL-900), an electron gun (VG LEG 63), a hemispherical electron analyzer for Auger spectroscopy (VG 100 AX), and a storage unit for six sample/tip holders. Two leak valves connected to the O2 and CO gas lines allow for separate
dosing of these gases in the analysis chamber. In addition, an initially prepared O2:CO gas mixture with required composition can be dosed by
expansion from the small volume separated from the analysis chamber using a valve. An x,y,z-manipulator with 360º rotation is used for proper positioning of the sample for LEED and AES measurements.
2.1.2 Auger electron spectroscopy
AES is a surface sensitive technique used to characterize chemical composition of a sample’s (near) surface. The mechanism of Auger electron emission is as follow. When surface atoms are bombarded by high energy electrons or photons, they can eject an electron from a core level of an atom and create a hole. This hole is filled by an electron from a higher energy level. The released energy may be transferred to a third electron, If this one is ejected into vacuum, it is called an Auger electron. The energy of Auger electrons depends only on the nature of the atom that emits them. Therefore, elemental analysis can be performed by measuring the energy spectrum of Auger electrons and comparing it to handbook spectra [1, 2].
0.5 ML of CO. The lower sensitivity range was not determined due to the poor control over the dosing for smaller coverage. That is why a final evaluation of the surface quality was done with STM.
2.1.3 Low energy electron diffraction
In contrast to Auger spectroscopy, LEED technique is based on the elastic scattering of electrons. These electrons have a de Broglie wavelength
λ defined by
mE
h
2
, (2.1)where h is Plank’s constant, m is the mass of an electron and E is the electron energy. To calculate the wavelength in nanometers, equation (2.1) is also used in the form
)
(
5
.
1
)
(
eV
E
nm
. (2.2)Therefore, for electrons with energies between 50 and 200 eV, which is typical in diffraction experiments, λ=0.2-0.1 nm. This is comparable to interatomic distances. In LEED, the primary beam of electrons with fixed energy impinges onto a single crystal surface. Back-scattered electrons pass through electrostatic grids that select only the elastically scattered electrons. These are visualized on a hemispherical phosphorous screen. Constructive interference between the electrons results in a diffraction pattern on the screen. The pattern represents an image of the reciprocal lattice of the real surface. In reciprocal space, diffraction from a periodic structure follows the Laue condition, which is expressed in the following form for a two dimensional lattice [3]:
*
*
||
||
k
m
a
l
b
k
, (2.3)Here,
a
*
andb
*
are the ba is vectors of the surface in reciprocal space,m and l are integers,
s
||
k
andk
||
are the components of a wave vectorparallel to the surface for incident and scattered electrons, respectively. In the case of elastic scattering:
2
k
The basis vectors of the reciprocal lattice expressed via the real space basis
vectors
a
,b
and the unit vector normal to the surfacen
:)
(
2
*
n
b
a
n
b
a
and)
(
2
*
n
b
a
a
n
b
, (2.5)or:
)
sin(
2
*
*
b
a
a
a
a
and)
sin(
2
*
*
b
a
b
b
b
. (2.6)The
sin(
a
b
)
S
reflects the symmetry of the surface lattice, which can be rectangular (S=1) or hexagonal (S=√3/2). In case of an incident electron beam normal to the surface for the (10) diffraction spot (m=1, l=0) the combination of equations (2.3), (2.4) and (2.6) gives:aS
2
)
sin(
2
, oraS
sin(
)
(2.7)Therefore, the unit cell of an unknown surface lattice can be calculated from the LEED image, since the electron wave length (λ) is given by equation 2.2, S can be assumed from the symmetry of the LEED image, and sin(θ) for the diffraction spots is defined from the dimensions of LEED optics. In case the sample is placed in the geometrical center of the hemispherical LEED screen (Figure 2.1a):
R
C
)
sin(
; (2.8)where R is the radius of curvature of the LEED screen and C is the distance from the center of LEED image to the diffraction spot. This equation cannot be applied if the sample is displaced from the geometrical center of the LEED optics as illustrated in Figure 2.1c. In Chapter 4 the period for the CO adlayer on the Pt(111) surface is calculated. The platinum diffraction pattern is used to calculate the displacement of the sample D=L-X (Figure 2.1b). By using the distance between platinum atoms (a=2.77 Å), equation (2.7),
)
3
2
arcsin(
a
, (2.9)and trigonometric equations
L
A
and
2 2
A
R
X
, (2.11)the displacement D can be calculated from:
2 2
))
3
2
(arcsin(
A
R
a
tg
A
D
(2.12)The angle θ for the diffraction maximum of an unknown structure C’
(Figure 2.1c) can be calculated from
)
(
2 2C
R
D
C
arctg
. (2.13)In Chapter 4, the described expression (2.13) of a reflection angle θ placed into equation (2.7) is used to determine the period of a Moiré pattern for the CO adlayer.
Figure 2.1 Schematic representation of a LEED experiment for a sample placed in the center of the LEED optics (a), or displaced by the distance D from it (b, c). The large arrows mark the incoming and the back-scattered beams of electrons.
2.1.4 Scanning tunneling microscopy
surface structure can be visualized locally with atomic resolution, thus any ambiguity about the adsorbate’s arrangement can be ruled out [4]. The STM technique employs the effect of tunneling of electrons through the potential barrier created between an atomically sharp metal tip and a conductive surface. The tunneling current It can be detected when the tip approaches
the surface and some voltage Vt is applied between them. The conductivity G of the tunnel barrier is [5]:
)
,
(
)
2
exp(
t Ft
t
z
r
E
V
I
G
, (2.14)where z is the tip-to-sample distance,κ is the decay constant for the electron wave function in vacuum and ρ is the local density of states of the surface at the Fermi level (EF) in the position of the tip rt. Spatial changes in the local
electron density of states follow the arrangement of the surface atoms. By moving the tip across the surface in x,y direction while adjusting the tip position to keep the tunnel current constant (constant current mode) and recording the z position of the tip, the topography of the surface can be measured with atomic resolution.
The sensitivity of the STM technique is governed by decay constant κ:
1 11 2 nm h m
, (2.15)were h is Planck’s constant, m is the mass of an electron and Φ is the height of the potential barrier, which is equivalent to the work function of materials used in the STM experiment [6]. Using this value for the decay constant in equation (2.14), the tunnel current ratio at the same x,y tip position for different tip-to-surface distances is
))
(
22
exp(
I II IIt I
t
z
z
I
I
, (2.16)was realized by mounting the UHV set-up on a special floor that is decoupled from the rest of the building. Additional damping of vibrations was realized with an Eddy current damping stage on the STM scanner. It is hanging on springs inside the UHV chamber. Electronic crosstalk from external sources was effectively screened by the UHV chamber serving as a Faraday cage. In addition, grounding of electronic equipment to a common ground point prevents parasitic crosstalk into the tunnel current measurement circuit from the rest of the system.
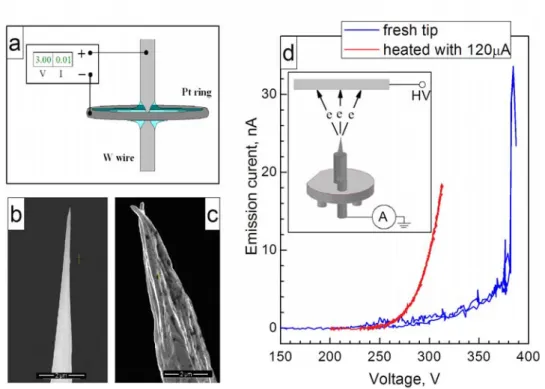
Beside external factors that influence resolution, a highly important factor is the interaction of the tip with the surface. It has been observed experimentally that the ability to resolve every single atom on the surface depends on the tip state and geometry [6]. Preparation of an atomically sharp tip is an intricate part of the STM experiment itself. The results presented in Chapters 3, 4 and 5 were obtained with self-prepared tungsten tips. These tips were electrochemically etched in the loop-meniscus configuration (Figure 2.2a) from a 0.25 mm tungsten wire in a 2M solution of NaOH and with a platinum counter electrode. The bottom part of the wire was caught and used as a tip. The shape of the prepared tips was characterized in a scanning electron microscope (FEI Nova SEM). An etching routine of applying a DC voltage ≥3V gave the most reproducible results: a single tip apex of 10-50 nm radius and a smooth finish of the tungsten surface (Figure 2.2b). At the same time, etching with a DC voltage <2V or with an AC voltage often led to the formation of a rough tungsten surface, probably due to the uneven etching speed along different crystal planes. As a result, multiple apex tips were regularly produced, as shown in Figure 2.2c. The sharpest tips were selected and mounted into the tip holder shown in the inset of Figure 2.2d.
The tungsten oxide formed during etching has to be removed prior to using tips for scanning [7]. The tip apex was heated in an UHV environment by an emission current up to 200 μA. This treatment yields a stable electron emission current in the 0-20 nA range, as shown in Figure 2.2d and a stable tunnel current under tunneling conditions.
Subsequent conditioning of the tips included scanning of an Au(100) single crystal surface. The advantage of using a gold sample is twofold:
- the gold surface stays almost indefinitely clean under UHV conditions;
All tips that showed stable emission current were able to resolve the reconstruction on the gold surface. To improve the spatial resolution further, pulses of a voltage of 2-3 V were applied over the tunnel junction. This treatment leads to restructuring of atoms on the tip apex and to improvement of the tip resolution. Tip conditioning was performed daily until the fine structure of the Au(100) surface was observed (Figure 2.3c).
2.1.5 Sample preparation
Au(100)
A 1 mm thick flat gold single crystal with a 5x7 mm2 elliptical shape exposing a polished (100) plane [9] was cleaned in the UHV system by several cycles of
- argon sputtering for 10 min at 600eV ion energy and 5-8 μA ion current;
- annealing in vacuum at 700-720 K for 5 min.
This procedure removes the initial contamination (carbon and sulfur, Figure 2.3a) and gives an STM-grade clean surface as shown in Figures 2.3 b and c.
Pt(111)
STM data presented in Chapters 3-5 were collected using a 1 mm thick 6 mm diameter circular single crystal mechanically polished along a (111) plane [9]. The sample was cleaned with several cycles of
- argon sputtering for 10 min at 800-1000 eV ion energy and 8-12 μA ion current;
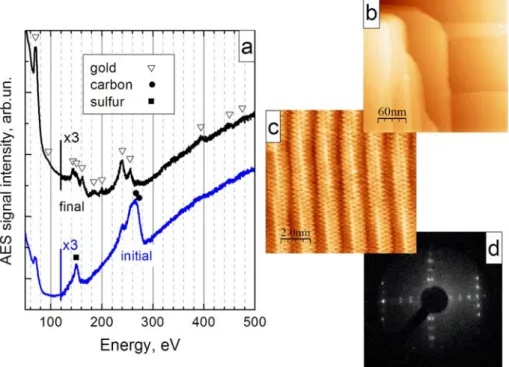
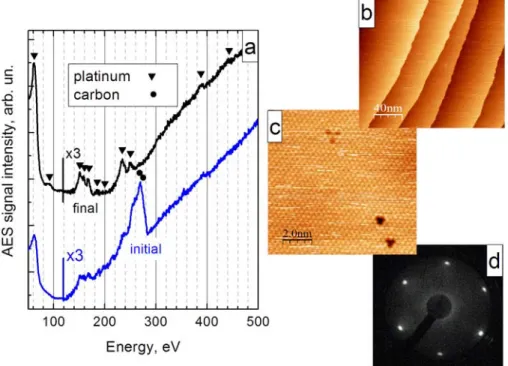
- heating for 10-30 min in 3-6x10⁻⁷ mbar of oxygen at 800-900 K to remove carbon, or annealing to 1100-1200 K in vacuum for 5 min. The quality of the cleaning procedure was first verified by Auger spectroscopy (Figure 2.4a). After contamination levels dropped below the detection level of AES, the quality of the surface was monitored with STM. Sputtering-annealing cycles were repeated until an atomically-resolved, STM-clean surface was observed (Figure 2.4c). The daily cleaning routine included annealing in oxygen for half an hour and flashing to 1200 K in vacuum.
2.2. Lionfish
2.2.1 Vacuum system
The results of the TPD and temperature programmed reaction spectroscopy (TPRS) measurements, described in Chapter 3, were obtained using a home-build instrument named “Lionfish”. The system has a base pressure <2x10⁻¹⁰ mbar which is achieved using two turbo molecular pumps placed in series (Pfeiffer TMU 521 and TMH 071) and a rotary vane pump (Pfeiffer Duo 10). The system hosted a 10 mm diameter and 1 mm thick platinum single crystal with one side polished to <0.1º precision of (111) plane [9]. The sample was mounted on the differentially pumped manipulator with cooling by liquid nitrogen. The sample temperature was measured by a K-type thermocouple spot-welded to the side of the crystal. The filament was placed on the back side of the crystal. Radiative heating and electron bombardment were used for the sample heating with a PID controller (Eurotherm 2416). In combination with LN2, cooling this yielded
accurate control of sample temperature between 85 and 1300 K. The system is equipped with a quadrupole mass spectrometer (Balzers Prisma 200), a rear view LEED (LK Technologies RVL2000/8/R), a sputtering gun and leak valves for background dosing.
2.2.2 Temperature programmed techniques
TPD and TPRS belong to a class of techniques in which a reaction is monitored while the temperature of a sample changes [10]. These techniques allow to evaluate the surface coverage and activation energy for desorption/recombination of surface-bound species. During an experiment, the surface is first covered with adsorbates. Then the temperature of the sample is linearly increased while the reaction products are monitored with a mass spectrometer. The concept of temperature programmed measurements is related to the Arrhenius equation for the reaction rate, r
)
exp(
kT
E
A
r
, (2.17)The desorption processes is described by the Polanyi-Wigner equation [11]:
) exp( ) ( ) ( RT E t dt d t
r n , where
T
T
t
0 , (2.18)
where r is the rate of desorption, t is time, ν is the pre-exponential factor, θ
P relative to the steady state background partial pressure in the vacuum system for the molecule of interest
ΔP(t)~r(t).
As can be seen from (2.18), the pressure will increase first since the probability for the molecules to leave the surface increases while the temperature rises. At some point, the decrease in the surface coverage ceases to allow further pressure rise. ΔP goes through a maximum and drops to zero when all adsorbed species have left the surface. The position of the maximum and the shape of the TPD spectra contain information about the activation energy and the order of the desorption process [12]. The area under the TPD spectrum is proportional to the surface coverage:
_max max
0 max _ 0 ) ( ~ T To t t PdT dt t P dt dt d
. (2.19)Hence, with the proper system calibration, the surface coverage of the adsorbed species can be determined from the measured spectrum. In Chapter 3, various coverages of atomic oxygen were determined from the area of TPD spectra by comparing them to the TPD peak area of the O-p(2x2)Pt(111) layer with 0.25 ML coverage.
2.2.3 Sample preparation
The (111) surface of this Pt single crystal was cleaned with repeated cycles of Ar sputtering (600eV, 0.2-0.3 μA) for 15 min, annealing in oxygen atmosphere (1-3x10⁻⁷ mbar) at 900-1000 K for 5 min and annealing in vacuum at 1200 K for 5 min. LEED from the clean surface revealed a hexagonal diffraction pattern similar to what had been observed for a clean Pt(111) surface in the Omicron system (Figure 2.5).
No additional structure was detected, although the diffraction spots show some elongation. This is ascribed to imperfect focusing of the electron beam.
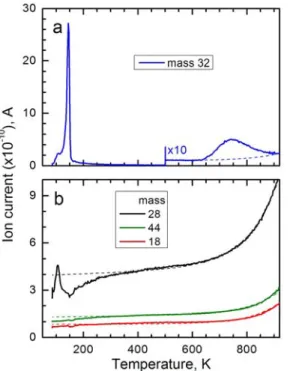
The chemical quality of the surface was checked by tracing the TPD signals of CO, CO2 and water after the surface was exposed to oxygen at 85
K. This procedure verifies for the absence of main contaminants on the platinum surface, which are residual carbon or CO and H2 adsorbed from
the residual gas in the UHV chamber. These sources of contamination will react with oxygen and form CO, CO2 and H2O which desorb from the
surface in temperature intervals 300-500 K, 200-350 K and 150-200 K, respectively. None of such desorption peaks were detected (Figure 2.6 b). A peak in the CO signal at 100 K is due to CO desorption from the filament. The same is true for a peak observed near 100 K for oxygen in Figure 2.6a.
All three masses in Figure 2.6b demonstrate a gradual increase with temperature. This is ascribed to increased heat transfer from the filament to the manipulator, which stimulates desorption of condensed residual gas and therefore increases the partial pressure of these molecules. From Figure2.6b one can see that above 300 K the increase of the background signal can be fitted with the formula:
A
BT
T
C
T
Bg
(
)
exp(
)
, (2.20)where C, B, and A are fitting parameters. This formula is used in Chapter 3 to subtract the background signal from the oxygen TPD spectra.
References:
[1] P. W. Palmberg, G. E. Riach, R. E. Weber, and N. C. MacDonald, Handbook of Auger Electron Spectroscopy, Physical Electronics Industries, Inc., Minneapolis, 1972.
[2] K. W. Kolasinski, Surface Science: Foundation of Catalysis and Nanoscience, Wiley, West Chester, 2008.
[3] F. Jona, J. J. A. Strozier, and W. S. Yang, Reports on Progress in Physics 45 (1982) 527.
[4] K. Heinz and L. Hammer, The Journal of Physical Chemistry B 108 (2004) 14579.
[5] F. Besenbacher, Reports on Progress in Physics 59 (1996) 1737.
[6] C. J. Chen, Introduction to Scanning Tunneling Microscopy, Oxford University Press, New York, 2008.
[7] S. Ernst, S. Wirth, M. Rams, V. Dolocan, and F. Steglich, Science and Technology of Advanced Materials 8 (2007) 347.
[8] C. Bombis and H. Ibach, Surface Science 564 (2004) 201.
[9] Single crystals supplied by Surface Preparation Laboratory (http://www.surface-prep-lab.com/)
[10] J. W. Niemantsverdriet, Spectroscopy in Catalysis: An introduction, Wiley-VCH Verlag GmbH, Eindhoven, 2000.
[11] D. A. King, Surface Science 47 (1975) 384.
Chapter 3
Subsurface oxygen on Pt(111)
11This chapter is based on: D.L. Bashlakov, L.B.F. Juurlink, M.T.M. Koper and A.I.
3.1 Introduction
Platinum is a primary catalyst for many oxidation reactions from fuel cells to automotive exhausts. The industrial and technological importance is reflected in the efforts by the scientific community to understand the interaction between the platinum surface and gas phase oxygen over the last four decades [1-11]. Although this effort has yielded a wealth of information, we show in this chapter that even the most intensely studied system, O2/Pt(111), can still yield surprising results that affect our view of
the catalytic action under realistic conditions.
Studies of the interaction of the Pt(111) surface with molecular oxygen under UHV conditions show that if dosed at temperatures below 100 K, O2
adsorbs molecularly into the (√3/2x√3/2)R15º structure and a 0.44 ML O2
per Pt coverage. When temperature increases, adsorbed O2 partially desorbs
and partially dissociates into chemisorbed atomic oxygen. While the desorbing O2 signal appears at 150 K during TPD measurements [1, 2, 4, 6],
remaining atomic oxygen forms the p(2x2) structure on the surface, clearly visible by LEED [6]. This adsorbed atomic oxygen recombinatively desorbs at much higher temperatures with a maximum near 750 K on TPD spectra [1, 2, 4, 6] .
The p(2x2) structure obtained by dissociating molecularly bound O2
can also be obtained by dosing O2 at room temperature [6, 8-10]. It has been
shown that the dissociative adsorption of molecular oxygen on Pt(111) requires two next nearest unoccupied fcc threefold-hollow sites [11]. This limits the maximum coverage of a well-ordered overlayer to 0.25 ML of atomic oxygen, where O occupies every fourth fcc site [9, 10]. This overlayer has been extensively studied with UHV techniques and is often used as a starting point in studies of oxidation reactions on Pt(111) [3-5, 7-10, 12-14].
In contrast to O2, other oxygen sources require only one fcc site for
dissociation [15]. Therefore, coverages up to 0.75 ML of atomic oxygen can be achieved by dissociation of NO2 on Pt(111) at 400 K [3, 16-18]. Even
higher coverages (up to 2.5-2.9 ML) can be produced by exposure to more aggressive oxidants, such us ozone [19] and atomic oxygen [20, 21]. In combination with DFT calculations, it has been shown that oxygen adsorption on Pt(111) up to the coverage of 0.4-0.5 ML precedes the growth of a thicker platinum oxide layer [22-24].
relatively high pressure of (up to) 1 atm. Under these conditions, a thin layer of platinum oxide forms on the surface in the temperature range of 450-600 K [25]. Furthermore, apparently the platinum oxide surface has a higher turnover rate for CO oxidation then the metallic surface [26]. This oxide has been identified by X-ray diffraction as α-PtO2 [27, 28]which decomposes at
temperatures between 700 and 800 K [29]. These results differ from those obtained in UHV studies as no oxide formation has been observed on platinum in a similar temperature range [1, 4, 6, 30-32]. It is also opportune to note that the formation of platinum “oxide” state has been reported previously, albeit at considerably higher temperatures (900-1100 K) [33]. The same authors, however, had shortly thereafter re-assigned this effect to the oxidation of Si impurities in their platinum single crystals [34].
In this work we show that the 0.25 ML coverage limit for O2
dissociative adsorption on Pt(111) can be overcome even at high vacuum conditions, if oxygen exposure is conducted in the catalytically relevant temperature range 400-600 K. Our results indicate that oxygen adsorbs not only on the surface, but also migrates to the sub-surface region, so that additional oxygen is stored underneath the conventional 0.25 ML surface layer. While this subsurface oxygen has lower reactivity towards CO oxidation, its presence does not alter the reactivity of the surface-bound oxygen layer.
3.2 Experimental section
Experiments were performed with two separate UHV systems using two Pt(111) single crystals. The detailed description of these systems and the procedures for Pt(111) surface preparation was given in the previous chapter. The Pt(111) samples were exposed to O2 (Messer 5.0) and CO (Air
Liquide 4.7) by background dosing at 3-6x10⁻⁷ and 1x10⁻⁸ mbar, respectively. For every individual TPD measurement, Ar sputtering and annealing the crystal to 1200 K in vacuum preceded oxygen adsorption in the Lionfish UHV instrument. In the Omicron UHV system, the crystal surface was checked by STM in every experiment prior to O2 adsorption.
Only when atomic resolution of a clean surface was achieved, the sample was transferred to the preparation chamber, exposed to O2 and placed back
in the STM stage.
obtained by exposing a clean Pt(111) surface to 400 L of molecular O2 at
various temperatures, and to 2.2 L of CO at 90 K unless noted otherwise (1 L= 1x10⁻⁶ Torr∙s). In all measurements O2 dosing was stopped and system
was pumped down before cooling the crystal.
3.3 Results and discussion
3.3.1. Oxygen adsorption at various temperatures
Figure 3.1. O2TPD spectra of Pt(111) exposed to 400 L O2 at various temperatures taken at 2 K/s heating rate. All spectra have been corrected for rising backgrounds at higher temperatures using formula (2.20).
Figure 3.1 shows TPD spectra obtained after exposing the Pt(111) surface to 400 L O2 at different temperatures in the range 300-800 K. As the
peak areas in these spectra are a direct measure of the amount of O adsorbed on the surface prior to the temperature ramp, it is clear that this amount depends non-linearly on the temperature at which the surface was exposed to O2. The TPD peak area increases with substrate temperature up to 500 K,
dosing oxygen at temperatures above 600 K simply leads to concomitant O2
desorption from the surface.
Figure 3.2a shows the integrated TPD peak areas versus adsorption temperature. The error bars reflect one standard deviation obtained from multiple TPD measurements convoluted with the estimated error resulting from background subtraction. The black line only serves to guide the eye.
Figure 3.2 a) Amount of adsorbed O as a function of adsorption temperature after the exposure of Pt(111) to 400 L of oxygen. b) The O uptake curve for dozing at 300 K (squares) and 500 K (circles).
The area of the TPD peaks is normalized to saturation coverage of atomic oxygen obtained at 300 K as shown in Figure 3.2b (black squares). The data points were fitted with an uptake curve calculated from the adsorption rate for Langmuirian dissociative adsorption:
2 0
(
1
)
f
s
dt
d
, (3.1)
where δ equals the relative coverage, s0 is the initial sticking probability,
and f is the normalized flux of molecules to the surface. Equation (3.1) can be transformed into a simple differential equation:
2 0
(
1
)
)
1
(
fs
dt
d
, (3.2)
1
0 0
ft
s
ft
s
. (3.3)By definition,
SAT
where θ is absolute coverage and θSAT is saturationcoverage of adsorbents in the ML, and product of flux f and time t gives the exposure L. Thereby, expression (3.3) transforms into:
1
0 0
L
s
L
s
SAT
. (3.4)The black line in Figure 3.2b is calculated from (3.4) for an initial sticking probability s0=0.05 and θSAT=0.25 ML. It shows that exposure of Pt(111) to
400 L of O2 results in (near) saturation for oxidation at 300K.
Figure 3.2a demonstrates that by increasing the substrate temperature, the total amount of adsorbed O on Pt(111) can be at least twice as high as the 0.25 ML obtained for oxidation at 300K. This result seems to be at odds with most results from previous UHV experiments as 0.25 ML was considered the maximum coverage when dosing molecular oxygen on Pt(111) [8-10, 13, 14]. However, the result is simultaneously not surprising considering recent reports of formation of an oxide layer on platinum single crystals and polycrystalline platinum during oxidation at atmospheric pressures (0.1-1 bar) in the temperature range 420-650 K [27, 28, 35]. Also, Derry and Ross reported a similar observation for Pt(111) and Pt(100) surfaces [36]. In their studies, platinum surfaces were exposed to ~40 L and ~3000 L O2 at 370 K and 570 K respectively. While in the former case they
obtained a coverage of ~0.2 ML, in the latter the amount of adsorbed oxygen was reported 3-5 times higher, which is very similar to our observations for Pt(111). We must also note that if we significantly increase the dose of O2 at 500 K, the desorption signal will exceed the ~0.5 ML, as
shown for the O uptake curve on Figure 3.2b (green circles). We conclude that even at UHV conditions oxygen dosing well above room temperature allows the Pt(111) surface to take up considerably more than the equivalent of 0.25 ML of atomic oxygen.
In this light it is interesting to note that the exposure of platinum to 400 L O2 at 700 K leads to the adsorption of roughly the same amount of
active toward further oxygen adsorption when cooled back to room temperature. To demonstrate this, the surface was first exposed to 400 L of O2 at 700 K, then cooled to room temperature and exposed to the same
amount of oxygen again at 300 K. The consecutively recorded TPD trace is shown as a black line in Figure 3.3. The TPD peak area for the 700+300 K dose corresponds to an O coverage of 0.48 (±0.04) ML. As 0.25 ML is the maximum coverage that can be obtained for dissociation of O2 at 300 K, we
conclude that during the initial high-temperature exposure, oxygen is adsorbed in positions that do not block sites for consecutive dissociative adsorption of O2 at 300 K.
Figure 3.3 TPD spectra of oxygen adsorbed at 300K (green line) and 700K (red line) on clean Pt(111) and of oxygen dosed at 700 K and 300 K consecutively (black line). Heating rate is 4 K/s.
Enhanced oxygen coverage was previously obtained on Pt(111) in a number of TPD studies in which NO2, O3 or O where used as the source of
atomically adsorbed oxygen [19, 21, 37]. For low doses, oxygen adsorbs into the same p(2x2) structure as for O2 dosing at room temperature [8, 17,
37]. Higher doses lead to the formation of p(2x1) domains with a local 0.5 ML coverage [17]. TPD traces from these higher coverages show an additional O2 desorption peak at 500 K. The lower desorption temperature is
additional peak at 500 K, even at oxygen coverage corresponding to ~0.5 ML. Instead, we observe an increase in the peak intensity at 710 K. These observations indicate that the oxygen-loaded surface resulting from exposure to O2 at higher temperatures is different from the p(2x1)
overlayers observed in the O/O3/NO2 experiments.
3.3.2. Surface structure
To investigate the surface structure of these high oxygen-covered platinum surfaces, we use LEED and STM. Figure 3.4 shows LEED patterns for Pt(111) exposed to O2 at 300 (a), 500 (b) and 700 K (c).
Diffraction spots resulting from the clean Pt(111) surface are encircled. Although considerably weaker in Figure 3.4c, all three images show an additional diffraction pattern that corresponds to a (2x2) structure [8]. We note that the Pt(111) surface covered mostly with p(2x1) oxygen domains yields a similar LEED pattern, while having twice the amount of oxygen on the surface [20, 21, 37]. Therefore, using LEED alone we cannot unambiguously identify the structure.
To visualize the surface structure locally, we have performed STM topography measurements. Images in Figure 3.5 were obtained for oxygen adsorbed on Pt(111) at 300 K (a) and 500±50 K (b). Figures 3.5a and 3.5b both show the same p(2x2) structure of 0.25 ML of adsorbed atomic oxygen known from previous STM studies [13, 14]. This means that, although TPD data in Figure 3.2 show that the amount of oxygen adsorbed at 500 K is twice that for 300 K, it is not found in the top layer. Therefore we are left to conclude that additional oxygen created by exposure to O2 at elevated
temperatures is stored below the surface of the metal. We note that contrary
to the reported step-edge facilitated oxidation on Rh(111) at elevated temperatures [38], our STM study did not reveal surface buckling near the step edges corresponding to oxide growth [39]. We would like to emphasize that by using the term “subsurface oxygen” we refer only to the location of this additional oxygen. We prefer to avoid the terms “subsurface oxide” or “bulk oxide” prior the additional studies of a surface structure, despite that oxides exist for most of the transition metals [40, 41]. Finally, we note that the strongly faded (2x2) diffraction pattern observed after dosing oxygen at elevated temperatures (Figure 3.4c) may result from small amounts of O remaining at the surface or from a (2x2) structure of O in subsurface sites.
![Figure 1.1. Potential energy diagram for a non-catalyzed and catalyzed reaction (reproduced from [4])](https://thumb-us.123doks.com/thumbv2/123dok_us/8248918.2185773/9.721.109.627.260.591/figure-potential-energy-diagram-catalyzed-catalyzed-reaction-reproduced.webp)
![Figure 1.2. Potential energy diagram in direction perpendicular to the surface (bottom left) and along the surface (bottom right) for an adsorbate on a single crystal surface (top right), reproduced from [7]](https://thumb-us.123doks.com/thumbv2/123dok_us/8248918.2185773/11.721.155.556.345.692/figure-potential-direction-perpendicular-adsorbate-crystal-surface-reproduced.webp)