Prediction of Remaining Useful Life for Lithium-Ionbattery
with Multiple Health Indicators
ZHENG Yu-qiao
1, CHEN
Hong-jing2, SU Chun21. School of Mechanical and Electrical Engineering, Lanzhou University of Technology, Lanzhou 730050,
China
2. School of Mechanical Engineering, Southeast University, Nanjing 211189, China
Corresponding author: SU Chun, Professor, phD; Tel: +86-13851875437; E-mail: [email protected]
Abstract: The remaining capacity can only be measured with offline method. This
bringsgreat challenge for the online prediction of Li-ion battery’s RUL. A novel online prediction method for Li-ion battery’s RUL was proposed, which is based on multiple health indicators (HIs) and can be derived from the batteries’ historical operation data. Firstly, four indirect HIs were built according to the battery’s operation current, voltage and temperature data respectively. On that basis, a generalized regression neural network (GRNN) was developed to estimate the battery’s remaining capacity, and the non-linear autoregressive approach (NAR) was utilized to predict the battery’s RUL based on the estimated capacity value. Furthermore, to reduce the interference, twice wavelet denoising were performed with different thresholds. A case study is conducted with a NASA batterydataset to demonstratethe effectivenessof the method. The result shows that the proposed method can obtain Li-ion batteries’ RUL effectively.
Keywords: lithium-ion (Li-ion) battery; remaining useful life (RUL); health indicator (HI); generalized regression neural network (GRNN); non-linear autoregressive (NAR)
1 Introduction
Nowadays lithium-ion (Li-ion) battery has become a primary energy form for a variety of engineering
equipments.Lithium-ion (Li-ion) battery is the key power unit for a variety of engineering equipments,including portable computer, electric automobile, satellite, and spacecraft, etc. However, with the increased cycles of charge-discharge, the battery’s capacity will deteriorate gradually, and when the capacity is inferior to a given
threshold, failure may occur. This phenomenon will reduce the equipment’s reliability and even lead to catastrophic failures. Therefore, it is crucial to timely forecast Li-ion battery capacity as well as its remaining
useful life (RUL).For Li-ion battery, its RUL can be defined as the number of remaining charge-discharge cycles before the battery capacity deteriorates to a predetermined failure threshold [1]. The prediction methods
for battery RUL can be categorized into three types, i.e. model-based approach, data-driven approach and hybrid approach [2].Model-based approaches adopt mathematical representation or failure physics model to describe the degradation process of battery capacity, including electrochemical model [3-5], equivalent circuit
model and empirical model [6], etc. Among them, electrochemical modelaims to quantify the factors that affect battery performance and obtain the description of performance’s evolution. Equivalent circuit model can simulate battery dynamic characteristics. However, considering the interactions among the various factors as well as the calculation of the parameters, it is not easy to establish a reliable and accurate prediction model for
Foundation item: Project 51965034/71671035 supportedbytheNationalNaturalScienceFoundationofChina; Project ( 2018-RC-25) supported by Lanzhou city Innovation and Entrepreneurshipof Lanzhou Technology DevelopmentProgram.
the above two approaches. Conversely, by fitting a large amount of degradation data, empirical model is easier to be established. Based on batteries’ historical operational data, data-driven approach can extract the feature information and obtain the inherent degradation tendency. As a kind of data-driven approach, time series
analysis has been widely used in RUL prediction, including auto-regressive (AR) , auto-regressive and moving average (ARMA) , auto-regressive integrated moving average (ARIMA) and the improved models [7-8]. In
recent years, artificial intelligence (AI) algorithm becomes a hot point in data-driven approaches due to its powerful ability in self-learning and data mining. The frequently-used AI algorithms include artificial neural network (ANN) [9], support vector machine (SVM) [10, 11], relevance vector machine (RVM) [12], etc.
In most existing studies, the Li-ion battery’s RUL is predicted with static capacity data. In fact, the battery’s remaining capacity can only be measured when it is out of service. Furthermore, it also requires strict testing conditions and environment. Therefore, this kind of approach is difficult to be applied in engineering practice. To solve thisproblem, some other discriminant criteria can be used to estimate the battery’s remaining
capacity as well as its RUL, e.g. internal resistance [13, 14], incremental capacity analysis (ICA) [15, 16], open circuit voltage (OCV), entropy [17-18], etc. Here, we call them the health indicators (HIs).
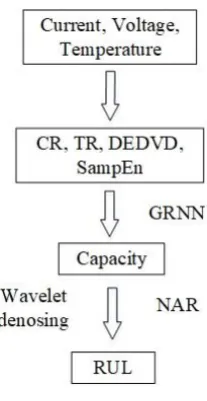
In this work, on the basis of battery’s operation data, a novel hybrid approach is proposed for estimating
Li-ion battery RUL, and multiple HIs are adopted concurrently. Generally, there are three steps in it. Fig. 1
shows the basic procedure of the proposed approach.
Step 1: Calculating HIs. Based on the data, including battery current, voltage as well as working temperature, four types of HIs are built accordingly. They are calculated resistance (CR), rate of temperature change (TR), duration time of equal discharging voltage difference (DEDVD) and sample entropy of discharge
voltage (SampEn) respectively.
Step 2: Estimating the remaining capacity. On that basis, a generalized regression neural network (GRNN)
with cross-validation is applied to estimate the battery’s remaining capacity. To reduce the interference and improve the accuracy of the estimation, the wavelet denoising is performed for two times and with different thresholds.
Step 3: RUL prediction. With the estimated remaining capacity, the battery’s RUL is predicted via the non-linear autoregressive (NAR) method.
The remainder of this article is organized as follows. Section 2 introduces the four HIs respectively. Section 3 illustrates the basic theory of GRNN, NAR and wavelet denoising. Based on the Li-ion battery data from NASA, Section 4 conducts a case study of Li-ion battery RUL prediction, and the effectiveness of the
proposed approach is illustrated. Conclusions and future works are given in Section 5.
2 Health indicators
To illustrate the discharging characteristics of the battery changing with the number of the charge cycles, in
this study four HIs are extracted, they are CR, TR, DEDVD and SampEn respectively. The value of the above four HIs will change with the increase of cycles, and the corresponding calculation methods are described as the
follows.
2.1 Calculation of CR
For Li-ion battery, its internal resistance is closely related to the battery remaining capacity. CHANG Yang et al [19] found that the remaining capacity of Li-ion batteries is linearly related to the sum of their electrolyte
impedance and the charge transfer impedance. Therefore, the internal resistance can be used to estimate the battery remaining capacity.
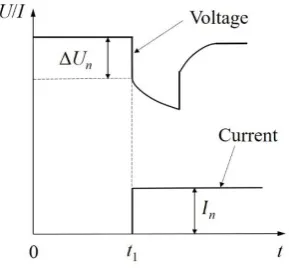
CR is the measured internal resistance, which can be obtained with battery terminal voltage and current during its operating state. Fig. 2 depicts the voltage and current’s change at the instant of battery discharge. As
shown in Fig. 2, when a constant DC current passes through the battery, the terminal voltage changes ΔUn at the time t1. At that time, the polarization effect has not occurred in the battery, therefore the voltage change is caused by ohm resistance. In this paper, the CR refers to the ohmic resistance Rn. According to Ohm’s Law, it
can be obtained as
(1)
where ΔUn is the voltage change caused by ohmic resistance of cycle n; In is the load current in cycle n; and N is the total cycle life of the battery.
Fig. 2 Pulse discharge response of the battery
2.2 Calculation of TR
During the discharging process, the battery’s internal temperature will change. Here we define TR as the rate that the temperature changes in the discharge process. TR will increase with the increase of cycles. In cycle n,TR can be calculated as follows:
1, 2, ,
n n
n
U
R n N
I
(2)
where TRn denotes the rate of temperature change in cycle n; TPenis the end temperature of cycle n; TPsnis the
initial temperature of cycle n; and tn is the duration time of cycle n’s discharge process.
2.3 Calculation of DEDVD
For Li-ion battery, the time for full discharge will be shortened gradually with the increase of the cycles.
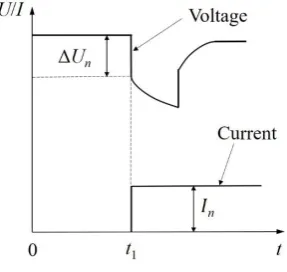
Therefore, the duration time of equal discharging voltage difference (DEDVD) will also be shortened with the increase of the cycles’ number. For a constant voltage interval [UL, UH]. We define as the duration time in cycle n when the voltage is reduced from UH to UL, as shown in Fig. 3.
(3)
where denotes the duration time of equal discharging voltage difference in cycle n; denotes the moment
that the discharge voltage is UH in cycle n; and denotes the moment that the discharge voltage is UL in
cycle n.
Fig. 3 Duration time of equal discharging voltage difference
2.4 Calculation of SampEn
Sample entropy (SampEn) was firstly proposed by Richman and Mooman to measure the complexity of
time series [20]. In this study, we regard the discharging process as a time series, and the SampEn of discharge voltage is used as an HI for the Li-ion battery.
For a given embedding dimension m, tolerance r as well as the number of data point T, we can obtain a
time-series data set X
x x x1, 2, 3,...,xT
with a constant time interval τ. Here we define a template vector oflength m, Xm( )
x( ), ( x1),..., (x m 1)
1,2,...,T m 1. The distance between two template vectors of and is define as . It can be any types of distancefunctions, including Euclidean distance, or Chebyshev distance.
( )
m
V is definedas the number of , and the definition of the function is as the follows [21]:
( n n) / 1, 2, ,
n e s n
TR TP TP t n N
n D
t
1, 2, ,
n n n
D H L
t t t n N
n D
t
t
Hnn L
t
( )
m
X Xm( ) dm[Xm( ), Xm( )] ( )
[ ( ), ( )] ( )
m m m
1
1, 2,..., 1 1
m m
B r V T m
T m
(4)
(5)
where represents the probability that two sequences will match for m points. Similarly, we can obtain
. Hence, the sample entropy can be defined as:
(6)
3 Methodology
In this work, the battery’s remaining capacity is estimated with the proposed HIs. On that basis, by
analyzing the degradation trend of the remaining capacity, the battery’s RUL is predicted.
As shown in Fig. 1, GRNN is used to establish the mapping relationship between the HIs and the battery’s
capacity, and hereafter to estimate the remaining capacity. Here, NAR model is used to demonstrate the degeneration of battery capacity. Moreover, wavelet denoising is applied to reduce the interference of the
estimated capacity. Here, we illustrate the basic theories for GRNN, NAR and wavelet denoising as the follows.
3.1 Theory of GRNN
With a flexible network structure, GRNN model has strong ability for non-linear mapping. Therefore, it is suitable for solving non-linear problems [22].
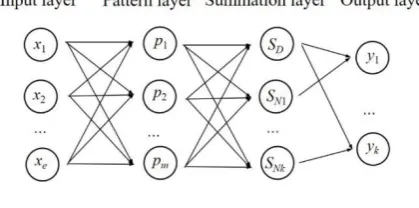
Generally, there are four layers in GRNN, i.e. input layer, pattern layer, summation layer, and output layer,
as shown in Fig. 4. The input of the network is X=
x x1, 2,...,xe
T, and its output is Y=
y y1, 2,...,yk
T. d is the dimension of the input vector, k is the dimension of the output sample, and m is the number of the learning sample.Fig. 4 Basic structure of the GRNN
(1) Input layer: It is responsible for the input data into the model. Among it, each neuron is a simple distribution unit, which will transfer the input variable directly to the pattern layer. In addition, the number of
the input neurons in a GRNN equals to the dimension of the input vector e.
(2) Pattern layer: The number of neurons equals to the number of learning sample m. Each neuron corresponds to a different sample, and the neurons transfer function can be calculated as :
1 1 ( ) ( ) -T m m m
B r B r
T m
( ) m B r 1 ( ) m B r1 ( )
( , , ) ln
( )
m
m
B r
SampEn r m T
B r
(7)
where is the smoothing parameter; X is the input variable; and Xi is the corresponding learning sample of neuron i.
(3) Summation layer: It sums the output of the pattern layer.
In this layer, two types of neurons are used for summation. The simple summation of the pattern outputs is
determined with:
(8)
And, the weighted summation of the pattern output can be determined by
(9)
where yij is the weight of the i-th neuron in the pattern layer, which is connected to the summation layer.
(4) Output layer: Based on the results calculated in the summation layer, the corresponding results will be sent to the output layer. The number of neurons is equal to the dimension k of the output vector in the sample.
The output of the neurons is calculated as follows:
(10)
where yi is the output of the j-th node in the output layer.
In this study, the cross-validation is used to gain the optimized parameters.
3.2 Theory of NAR
Here, by combining the variable’s information during the early time, NAR model is used to describe the variable information at a particular time. It is a form of time series [23]:
(11)
where p is the delay time, namely the order of the NN; and is the model of NAR.
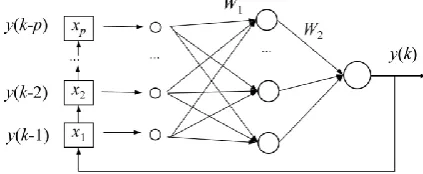
The structure of NAR-DNN is shown as in Fig. 5. It is consisted of four layers, i.e. input layer, hidden layer, output layer as well as the delay function.
In Fig.5, xu(1 u p) is the input; y(k) is the output; W1 is the connection weight between the input layer
and the hidden layer; W2 is the connection weight between the hidden layer and the output layer; and p is the delay time of the output.
2
exp 1, 2, ,
2
T
i i
i
p i m
X X X X
1 m D i i S p
11, 2, , m
Nj ij i i
S y p j k
1, 2, , Nj
j
D S
y j k
S
( ) [ ( 1), ( 2), , ( )] y t f y t y t y tp
Fig. 5 Structure of NAR-DNN
The output of the node v in the hidden layer is
1 1
( ) 1, 2, ,
p
v uv u v
u
h g w x c v V
(12)where g1( ) is the activation function of the hidden nodes; V is the number of the hidden nodes; is the u-th
delay output of the output signal y; is the connection weight between the hidden node u and the delay node v; and is the v-th neural threshold of the hidden layer.
The output of NAR is
2 1 ( ) V v v v
y g w h d
(13)where wv is the connection weight between the hidden node v and the output node; and d is the neural
threshold of the output layer.
3.3 Wavelet denoising
Wavelet analysis is a kind of method for signal analysis, which can separate the noise signals and extract effective data from the noise-mixed data. In wavelet analysis, the data can be decomposed into two parts with the expansion and translation of the mother wavelet, i.e. approximate part and detail part [24].
Let H(x) denote the measured signal mixed with noise, the wavelet transform with the mother wavelet ψ(x) can be expressed as:
(14)
where a and b are the expansion and translation parameters of the mother wavelet respectively; and c(a, b) is the wavelet coefficient of H(x).
During the process of wavelet denoising, the selection of wavelet denoising threshold is closely related to
the consequence of noise reduction. In this study, a twice denoising method with different thresholds is proposed.
The first denoising threshold is made by the Sqtwolog method [25]:
(15)
The second denoising threshold is finished by the minimax method [25]:
u x uv w v c , 1
( , ) ( ), a b( ) ( ) (x b)
c a b H x x H x
(16)
where N is the number of signal H(x), and in this paper, it equals to the cycle life of the battery.
The threshold of the above two methods are different. Normally, the threshold of the Sqtwolog method is larger than that of the minimax method. Therefore, the first wavelet denoising can remove the lager noise signal,
while the second wavelet denoising can remove the smaller noise signal. By using twice wavelet denoising with different thresholds, the interference among the measured data can be reduced effectively.
3.4 Implementation of the proposed approach
Here, the training batteries are used to establish the mapping relationship between the HIs and the battery capacity. The basic steps for estimating battery RUL are described as follows:
(1) Based on the historical operation data, the HIs of the training batteries and testing batteries are
calculated respectively.
(2) By using the training batteries, train a GRNN model to establish the mapping relationship between the HIs and the battery’s capacity.
(3) Based on the well-trained GRNN model and the HIs data of testing batteries in the previous cycles, the capacity of the testing batteries is estimated accordingly.
(4) The wavelet denoising is applied to deduce the noising of the estimated capacity.
(5) With the established capacity sequence and by using the NAR model, the remaining capacity and RUL
of the testing battery can be predicted
4 Prognostics Experiment
4.1 Experiment Data and the Procedure
In this section, a case study is conducted to demonstrate the effectiveness and efficiency of the proposed approach, where the Li-ion battery data come from the data repository of the NASA Ames Prognostics Center
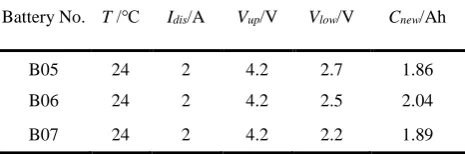
of Excellence (PCoE) [ ]. Here, three groups of batteries are taken as examples, i.e. B05, B06 and B07. Among them, B05 and B06 are used as the training batteries, and B07 is used as the target battery. The
experimental parameters of the discharge process are listed as in Table 1.
Table 1 Discharging parameters of the NASA batteries
Battery No. T /℃ Idis/A Vup/V Vlow/V Cnew/Ah
B05 24 2 4.2 2.7 1.86
B06 24 2 4.2 2.5 2.04
B07 24 2 4.2 2.2 1.89
The capacity’s degradation trends with the cycles are shown as in Fig. 6. Obviously, the battery capacity shows a non-monotonic decline with the increase of the cycles. Meanwhile, the degradation is accompanied
with the phenomena of capacity self-regeneration as well as local fluctuations. Therefore, it is essential to develop an effective prognostic approach to accurately estimate the capacity and predict its RUL by overcoming
min 0.3936 0.1829log2
N
the uncertainty fluctuation.
Fig. 6 Capacity degradation of tested batteries
4.2 Calculating HIs
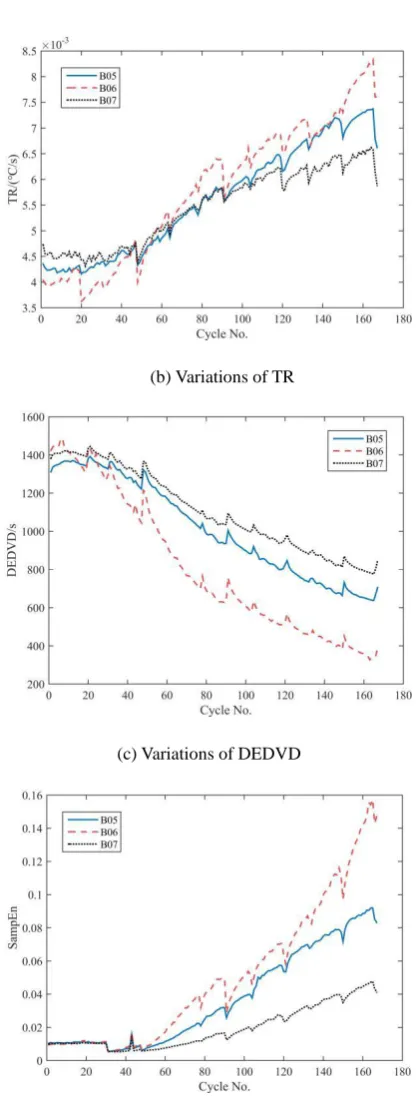
In this section, by using the batteries’ historical operation data (including current, voltage and temperature) during the discharging process, we calculate the HIs for batteries of B05, B06 and B07 respectively. Fig. 7
shows the variation of the four HIs with the increase of cycles respectively.
(b) Variations of TR
(c) Variations of DEDVD
(d) Variations of SampEn
Fig. 7 Variations of the four HIs changing with the charging cycles
Next, we calculate the Pearson correlation coefficient between the four HIs and the original capacity of Li-ion batteries, as shown in Table 2. Obviously, the HIs have a close correlation with the capacity. Furthermore, the DEDVD has a negative correlation with the capacity, while the other three HIs are in positive correlation.
Battery No. B05 B06 B07
CR -0.9791 -0.9893 -0.9658
TR -0.9947 -0.9819 -0.9901
DEDVD 0.9988 0.9957 0.9990
SampEn -0.9522 -0.8936 -0.8876
4.3 Establishing GRNN model
With the obtained HIs data, GRNN model is used to train and establish the mapping relationship between
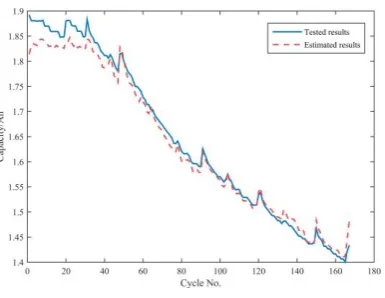
the HIs (input) and the capacity (output). In this study, the data of B05 and B06 batteries are used for training. On that basis, the well-trained GRNN model is used to estimate B07’s capacity with B07’s HIs. The predicted
results are shown in Fig. 8.
As shown in Fig. 8, the proposed method has a relatively high prediction accuracy concerned with the
capacity in the long-term trend. However, the predicted result is not so good for the first 40 points. The reason is that the HIs is not so stable during the early stage. Therefore, the first 40 points can be removed to get a more accurate prediction result.
Fig. 8 The estimated and tested capacity of B07
Moreover, the indicators, including root means square error (RMSE), the maximum estimation error and the maximum covariance (cov) value, are utilized to evaluate the accuracy of the estimation results, as shown in
Table 3. Obviously, the capacity estimation is with high accuracy.
Table 3 Accuracy analysis of the capacity estimation
Indicators All points Remove the first 40 points
RMSE 0.2002 0.0140
Max error 0.0823 0.0267
4.4 RUL prediction
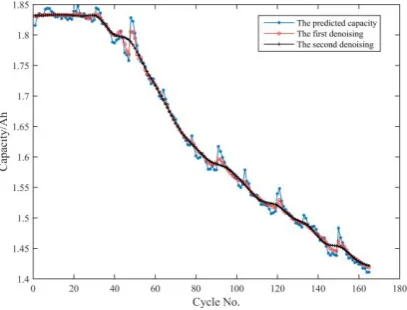
To remove the influence of self-regeneration phenomena and local fluctuations, a twice wavelet denoising is implemented with different thresholds. The result is shown as in Fig. 9.
In this case, the threshold of Sqtwolog method is larger than that of minimax method. As shown in Fig. 9, the first denoising can only eliminate the large noise signal, and the second denoising can eliminate the smaller noise signal. Thus, with the proposed twice wavelet denoising, the noise can be eliminated more thoroughly and
a more accurate prediction can be obtained.
Fig. 9 The predicted capacity of B07
Based on the historical operation data, we can estimate the remaining capacity for each past cycle with the
above steps. In addition, by selecting the obtained data points as the input set, the future degraded capacity can be predicted with the NAR model. On that basis, we can obtain the corresponding value of the RUL. Here, the
number of the hidden layer is set as 1, the delay time is 20. It is supposed that the failure threshold of the battery capacity is 1.45Ah, and the total cycle life of B07 is 142. Here, we predict the B07’s RUL when the operated cycles (M) are 110, 120, 130 respectively. In addition, considering that there is randomness in the training
model, the predicted RUL will change with the experiments, thus we repeat the experiments for 100 times. Fig. 10 and Table 4 show some of the predicted results.
(b) M=120
(c) M=130
Fig. 10 Predictions for B07’s RUL under different M
Table 4 The predicted results of B07’s RUL
M Actual EOL Actual RUL Predicted RUL Percentage Error/%
110 142 32 28 14.3
120 142 22 23 4.3
130 142 12 14 14.3
Set the range of the 100 predicted results as the RUL uncertainty bound (RUB). For the battery of B07, the
RUB is shown as in Table 5.
Table 5 The RUB of B07 battery
110 142 32 [28, 55] 27
120 142 22 [23, 45] 22
130 142 12 [14, 35] 21
With the above predicted results, we can conclude that the proposed methods can obtain the decline
tendency of the Li-ion battery capacity with a high accuracy. However, the RUL’s predicted result is not so stable. The possible reason is that the tested life cycle of the battery is not long enough. Therefore, the training data are not sufficient. Furthermore, considering that the capacity change during each cycle is too small, and a small error in capacity prediction may lead to a larger error in the RUL’s prediction. It can also be found that the range of RUB will be narrowed down with the increase of the input cycles. It shows that the RUL prediction is
sensitive to the number of input data. Therefore, by increasing the number of the training samples, the stability and robustness of the predictions can be improved.
ARIMA model is also widely uses in battery RUL prediction. To compare the characteristics of different
prediction models, here we make a comparison for RUL prediction with the ARIMA model. For the same input, the ARIMA method has a unique prediction result. Thus, the prediction results do not have a RUB. The RUL
predicted results with ARIMA model are shown as in Table 6.
Table 6 Predicted RUL results based on ARIMA model
M Actual RUL Predicted RUL Error Percentage Error/%
110 32 38 6 18.9
120 22 28 6 27.3
130 12 18 6 50.0
By comparing the three predicted results of different M, it can be found that for different M,the errors keep
the same. It means that the prediction accuracy is not sensitive to the number of input cycles.
Comparing Table 4 and Table 6, it can be found that the predicted results of NAR model are more accurate than the results of ARIMA model. However, the predicted results are not as stable as the results of ARIMA
model. Furthermore, NAR model is sensitive to the number of the input data, the proposed NAR method is more suitable for large data set.
5 Conclusions
An innovative hybrid data-driven method is proposed to predict Li-ion battery’s RUL, which is based on multiple HIs, including CR, TR, DEDVD and SampEn. Furthermore, the GRNN model, NAR model and twice wavelet denoising are integrated. Case study shows that the proposed method can achieve Li-ion battery’s RUL
prediction with a high accuracy. Compared with ARIMA model, NAR model is more sensitive to the size of training samples. Furthermore, the proposed method is established on the basis of battery historical data, it can
method does not concern the physical and chemical reactions in the battery, therefore it is well suitable for other kinds of batteries.
References
[1] YANG Chang, FANG Hua-jing, ZHANG Yong. A new hybrid method for the prediction of the remaining useful life of a lithium-ion battery [J]. Applied Energy,2017, 206: 1564-1578.
[2] HUANG Wen-qiang, LIU Gui-hua, LIU Peng. Equilibrium concentration of lithium ion in sodium
aluminate solution [J]. Journal of Central South University, 2019, 26:304–311.
[3] CHAO, Lyu. LAI Qingzhi. GE A lead-acid battery’s remaining useful life prediction by using
electrochemical model in the particle filtering framework [J]. Energy, 2017,120:975-984.
[4] WAAG, Wladislaw, KAEBITZ, STEFAN, tefan, Experimental investigation of the lithium-ion battery impedance characteristic at various conditions and aging states and its influence on the application [J].
Applied Energy, 2013,102: 885-897.
[5] PRASAD, Githin K,RAHN, Christopher D. Model based identification of aging parameters in lithium ion
batteries [J]. Power Sources, 2013, 232 :79-85.
[6] HU, Xiao-song, LI Sheng-bo, PENG Hui. A comparative study of equivalent circuit models for Li-ion batteries [J]. Power Sources , 2012, 198 :359-367.
[7] YU Jin-song, TANG, Wei-qi, TANG, Di-yin. An approach to predicpt discharge voltage of lithium-ion batteries under dynamic loading conditions [J].Journal of Ambient Intelligence and Humanized Computing,
2019,10:923-936
[8] TANG Sheng-jin, YU Chuan-qiang, FENG Yong-bao.Remaining useful life estimation based on Wiener
degradation processes with random failure threshold [J]. Journal of Central South University, 2016,
23:2230-2241.
[9] XING Yin-jiao, MA EdenW.M., TSUI Kwork-Leung. An ensemble model for predicting the remaining
useful performance of lithium-ion batteries [J]. Microelectron Reliability, 2013, 53(6): 811-820.
[10]LIU Da-tong, LUO Yue, LIU Jie. Lithium-ion battery remaining useful life estimation based on fusion
nonlinear degradation AR model and RPF algorithm [J]. Neural Computing and Applications, 2014,
25(3-4): 557-572.
[11]ZHOU Ya-peng, Huang Miao-hua. Lithium-ion batteries remaining useful life prediction based on a
mixture of empirical mode decomposition and ARIMA model [J]. Microelectronics Reliability, 2016(65):
625-273.
[12]LONG Bing, XIAN Wei-ming, LIU Jian. An improved autoregressive model by particle swarm
optimization for prognostics of lithium-ion batteries [J]. Microelectronics Reliability, 2013, 53(6):
821-831.
[13]WU Ji, ZHANG Chen-bing, CHEN Zong-hai. An online method for lithium-ion battery remaining useful
[14]SBARUFATTI Claudio, CORBETTA Matteo, GIGLIO Marco, et al. Adaptive prognosis of lithium-ion
batteries based on the combination of particle filters and radial basis function neural networks [J]. Journal
of Power Sources, 2017, 344: 128-140.
[15]PATIL Meru. A, TAGADE Piyush, HARIHARAN Krishnan. S, et al. A novel multistage support vector
machine based approach for Li ion battery remaining useful life estimation [J]. Applied Energy, 2015,159:
285-297.
[16]ZHENG Xiu-juan, FANG Hua-jing. An integrated unscented kalman filter and relevance vector regression
approach for lithium-ion battery remaining useful life and short-term capacity prediction [J]. Reliability
Engineering System Safety, 2015,144: 74-82.
[17]FENG Jing, KVAM Paul, TANG Yan-zhen. Remaining useful lifetime prediction based on the damage mar
-er bivariate degradation model: A case study on lithium-ion batteries used in electric vehicles [J].
Engineering Failure Analysis, 2016,70: 323-342.
[18]SONG Yu-chen, LIU Da-tong, YANG Chen, et al. Data-driven hybrid remaining useful life estimation
approach for spacecraft lithium-ion battery [J]. Microelectronics Reliability, 2017,75: 142-153.
[19]CHANG Yang, FANG Hua-jing, ZHANG Yong. A new hybrid method for the prediction of the remaining
useful life of a lithium-ion battery [J]. Applied Energy, 2017,206: 1564-1578.
[20]KIM Jonghoon, LEE Seongjun, CHO B. H. Complementary cooperation algorithm based on DEKF
combined with pattern recognition for SOC/capacity estimation and SOH prediction [J]. IEEE
Transactions on Power Electronics, 2011, 27(1): 436-451.
[21]WENG Cai-hao, CUI Yu-jia, SUN Jing. On-board state of health monitoring of lithium-ion batteries using
incremental capacity analysis with support vector regression [J]. Journal of Power Sources, 2013, 235(4):
36-44.
[22]WENG Cai-hao, SUN Jing, Peng Huei. Model parametrization and adaptation based on the invariance of
support vectors with applications to battery state-of-health monitoring [J]. IEEE Transactions on Vehicular
Technology, 2015, 64(9):3908-3917.
[23]WIDODO Achmad, SHIM Min-Chan, CAESARENDRA Wahyu, et al. Intelligent prognostics for battery
health monitoring based on sample entropy [J]. Expert Systems with Applications, 2011,
38(9):11763-11769.
[24]HU Xiao-song, LI Shengbo-ben, JIA Zhen-zhong, et al. Enhanced sample entropy-based health management of Li-ion battery for electrified vehicles [J]. Energy, 2014,64: 953-960.
[25]CHEN Lu-ping,XU Liang-jun, ZHOU, Yi-lin.Novel approach for lithium-ion battery on-Line remaining useful life prediction based on permutation entropy [J]. Energies, 2018, 11(4) :820.
[26]B. Sahaand, K. Goebel. Battery Data Set, NASA ames prognostics data repository, 2007, NASA Ames