Transport Infrastructure
Asset Management Plan
(Incorporating - Sealed and Unsealed Roads – Footpaths – Kerb and Gutters)
Scenario 1 Version 5 (S1_V5) August 2014
Document Control
Rev No Date Revision Details Author Reviewer Approver
1 01/10/2012 Initial Draft T. Pollard
2 20/02/2013 Final Draft T. Pollard
3 26/08/2014 Revision – Adopted by Council T. Pollard
© Copyright 2013 – All rights reserved.
The Institute of Public Works Engineering Australia.
1. EXECUTIVE SUMMARY ... 1
Context ... 1
What we will do ... 1
The Next Steps ... 1
2. INTRODUCTION ... 2
2.1 Background ... 2
2.2 Goals and Objectives of Asset Management ... 3
2.3 Plan Framework ... 3
2.4 Core and Advanced Asset Management... 5
3. LEVELS OF SERVICE ... 5
3.1 Customer Research and Expectations ... 5
3.2 Strategic and Corporate Goals ... 5
3.3 Legislative Requirements... 6
3.4 Current Levels of Service ... 6
3.5 Desired Levels of Service ... 9
4. FUTURE DEMAND ... 11
4.1 Demand Drivers ... 11
4.2 Demand Forecast... 11
4.3 Demand Impact on Assets ... 11
4.4 Demand Management Plan ... 12
4.5 Asset Programs to meet Demand ... 13
5. LIFECYCLE MANAGEMENT PLAN ... 14
5.1 Background Data ... 14
5.2 Infrastructure Risk Management Plan ... 15
5.3 Routine Operations and Maintenance Plan... 16
5.4 Renewal/Replacement Plan ... 21
5.5 Creation/Acquisition/Upgrade Plan... 24
5.6 Disposal Plan... 26
5.7 Service Consequences and Risks ... 27
6. FINANCIAL SUMMARY ... 28
6.1 Financial Statements and Projections ... 28
6.2 Funding Strategy ... 31
6.3 Valuation Forecasts ... 31
6.4 Key Assumptions made in Financial Forecasts ... 33
7. PLAN IMPROVEMENT AND MONITORING ... 34
7.1 Status of Asset Management Practices ... 34
7.2 Improvement Program ... 35
7.3 Monitoring and Review Procedures ... 35
7.4 Performance Measures ... 35
8. REFERENCES ... 36
9. APPENDICES ... 37
Appendix A Road Hierarchy descriptions ... 38
Appendix B Projected Upgrade/Exp/New 10 year Capital Works Program ... 41
Appendix C Budgeted Expenditures Accommodated in LTFP ... 44
Appendix D Abbreviations ... 45
1.
EXECUTIVE SUMMARY
ContextGlamorgan Spring Bay Council’s (GSBC) network of public roads, including kerbs and footpaths, is infrastructure provided to the community to facilitate a safe, convenient and defined means for transporting people and goods around and through the municipal area.
Transport access to Glamorgan Spring Bay area is via the Tasman Highway from north and south and via the Lake Leake Road to the west. There is no airport or rail link to the area.
Of the permanent population, 70% live in the towns of Bicheno, Coles Bay, Swansea, Triabunna and Orford. The remainder of the population is spread over the rural hamlets of Buckland, Cranbrook, Spring Beach, Swanwick and the large rural holdings that form the backbone of the rural sector.
Population growth in the Council resulting in an increase in any of the road infrastructure assets is unlikely under present circumstances in the foreseeable future. It is also considered that the capacity of the road network is sufficient to meet current and future demands for short term use excluding extraordinary demands.
Council’s Transport Service
GSBC Transport network comprises: Sealed Roads – 169 kms Unsealed Roads – 188 kms Footpaths – 22 kms Kerb and Gutter – 71 kms
Asset Valuation Summary ($000)
Current Replacement Cost $73,797
Depreciable Amount $25,492
Depreciated Replacement Cost $48,304
Annual Depreciation Expense $959
Rate of Annual Asset Consumption 3.8%
Rate of Annual Asset Renewal 3.7%
Rate of Annual Asset Upgrade 1.4%
Rate of Asset Upgrade (Including Contributed Assets) 1.4%
Asset renewals as percentage of consumption 97.5% Percentage Increase in asset stock 1.4%
What we will do
We plan to provide Road Infrastructure services for the following:
Operation, maintenance, renewal and upgrade of Sealed roads, unsealed roads, footpaths and kerb and gutters to meet service levels set in annual budgets.
The Next Steps
Actions resulting from this Asset Management Plan are:
Road Network Inspection regime - Develop a road network asset inspection regime covering inspection program and reporting and recording mechanism.
What does it Cost?
Executive Summary ($000)
10 year total cost [10 yr Ops, Maint, Renewal and Upgrade Proj Exp] $19,723
10 year average cost $1,972
10 year total LTFP budget [10 yr Ops, Maint, Renewal and Upgrade LTFP
Budget] $19,405
10 year average LTFP budget $1,941
10 year AM financial indicator 98% 10 year average funding shortfall $-32
2.
INTRODUCTION
2.1 BackgroundThis Asset Management Plan has been developed to demonstrate responsive management of assets (and services provided from assets), compliance with regulatory requirements, and to communicate funding needed to provide the required levels of service over a 20 year planning period.
The Asset Management Plan follows the format for AM Plans recommended in Section 4.2.6 of the International Infrastructure Management Manual.
The Asset Management Plan is to be read with Council’s Asset Management Policy, Asset Management Strategy and the following associated planning documents:
Glamorgan Spring Bay Council Strategic Plan 2012 - 2020
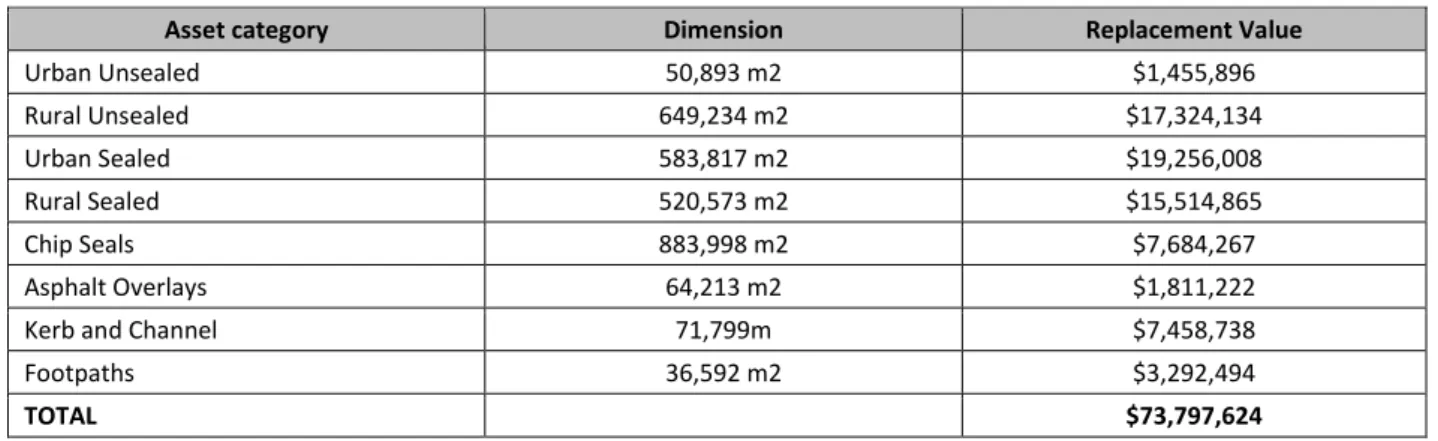
The infrastructure assets covered by this asset management plan are shown in Table 2.1. These assets are used to provide transport services to our community.
Table 2.1: Assets covered by this Plan
Asset category Dimension Replacement Value
Urban Unsealed 50,893 m2 $1,455,896
Rural Unsealed 649,234 m2 $17,324,134
Urban Sealed 583,817 m2 $19,256,008
Rural Sealed 520,573 m2 $15,514,865
Chip Seals 883,998 m2 $7,684,267
Asphalt Overlays 64,213 m2 $1,811,222
Kerb and Channel 71,799m $7,458,738
Footpaths 36,592 m2 $3,292,494
TOTAL $73,797,624
The Plan is intended to demonstrate to stakeholders that Council is managing its roads and the road related assets responsibly.
The key community/stakeholder groups involved, who are both users of the road network and/or are affected by it include for example:
The community in general (for recreation, sport, leisure and business); Residents and businesses adjoining the road network;
Pedestrians (including the very young, those with disabilities, and the elderly with somewhat limited mobility);
Users of a range of miscellaneous smaller and lightweight vehicles such as pedal cyclists, motorised buggies, wheel chairs, prams, etc;
Vehicle users using motorised vehicles such as trucks, buses, commercial vehicles, cars and motor cyclists;
Local agricultural and commercial producers; Tourists and visitors to the area;
Emergency agencies (Police, Fire, Ambulance); Managers of the road network;
2.2 Goals and Objectives of Asset Management
Council’s core business is to provide services to its community. Some of these services are provided by infrastructure assets. We have acquired infrastructure assets through purchase, contract, construction by our staff and by donation of assets constructed by developers and others to meet increased levels of service.
Our goal in managing infrastructure assets is to meet the defined level of service (as amended from time to time) in the most cost effective manner for present and future consumers. The key elements of
infrastructure asset management are:
Providing a defined level of service and monitoring performance
Managing the impact of growth through demand management and infrastructure investment Taking a lifecycle approach to developing cost-effective management strategies for the long-term that meet the defined level of service
Identifying, assessing and appropriately controlling risks
Having a long-term financial plan which identifies required, affordable expenditure and how it will be financed.1
2.3 Plan Framework Key elements of the plan are
Levels of service – specifies the services and levels of service to be provided by Council, Future demand – how this will impact on future service delivery and how this is to be met, Life cycle management – how we will manage our existing and future assets to provide defined levels of service,
Financial summary – what funds are required to provide the defined services, Asset management practices,
Monitoring – how the plan will be monitored to ensure it is meeting the organisation’s objectives, Asset management improvement plan.
1
A road map for preparing an Asset Management Plan is shown below.
Road Map for preparing an Asset Management Plan
Source: IPWEA, 2006, IIMM, Fig 1.5.1, p 1.11. IS THE PLAN
AFFORDABLE? CORPORATE PLANNING
Confirm strategic objectives and establish AM policies, strategies & goals.
Define responsibilities & ownership. Decide core or advanced AM Pan. Gain organisation commitment.
REVIEW/COLLATE ASSET INFORMATION Existing information sources
Identify & describe assets. Data collection Condition assessments Performance monitoring Valuation Data
ESTABLISH LEVELS OF SERVICE Establish strategic linkages Define & adopt statements Establish measures & targets Consultation
LIFECYCLE MANAGEMENT STRATEGIES Develop lifecycle strategies
Describe service delivery strategy Risk management strategies Demand forecasting and management
Optimised decision making (renewals, new works, disposals)
Optimise maintenance strategies
FINANCIAL FORECASTS Lifecycle analysis Financial forecast summary Valuation Depreciation Funding
IMPROVEMENT PLAN Assess current/desired practices Develop improvement plan
ITERATION
Reconsider service statements Options for funding
Consult with Council Consult with Community
DEFINE SCOPE & STRUCTURE OF PLAN
IN F O R M A T IO N M A N A G E M E N T , a n d D A T A I M P R O V E M E N T AM PLAN REVIEW AND AUDIT IMPLEMENT IMPROVEMENT STRATEGY
ANNUAL PLAN / BUSINESS PLAN IN F O R M A T IO N M A N A G E M E N T , a n d D A T A I M P R O V E M E N T
2.4 Core and Advanced Asset Management
This Asset Management Plan is prepared as a ‘core’ Asset Management Plan over a 20 year planning period in accordance with the International Infrastructure Management Manual2. It is prepared to meet minimum legislative and organisational requirements for sustainable service delivery and long term financial planning and reporting. Core asset management is a ‘top down’ approach whereby analysis is applied at the
‘system’ or ‘network’ level.
Future revisions of this Asset Management Plan will move towards ‘advanced’ asset management using a ‘bottom up’ approach for gathering asset information for individual assets. This is done to support the optimisation of activities and programs to meet agreed service levels.
3.
LEVELS OF SERVICE
3.1 Customer Research and Expectations
Council has not carried out any research on customer expectations. This will be investigated for future updates of our Asset Management Plan.
3.2 Strategic and Corporate Goals
This asset management plan is prepared under the direction of Council’s vision, mission, goals and objectives.
Our vision is:
In 2020 Glamorgan Spring Bay will be: Proud of our united inclusive community
Responsible for our environment, health, education, heritage And the arts
With a diverse progressive and prosperous economy An attractive lifestyle,
In a beautiful place
Values to guide future choices
In all that we do, across Glamorgan Spring Bay, we will: Work together and take an East Coast view
Be honest and self reliant
Take the initiative and be creative Build community spirit and pride
Move forward but retain what is good from the past
2
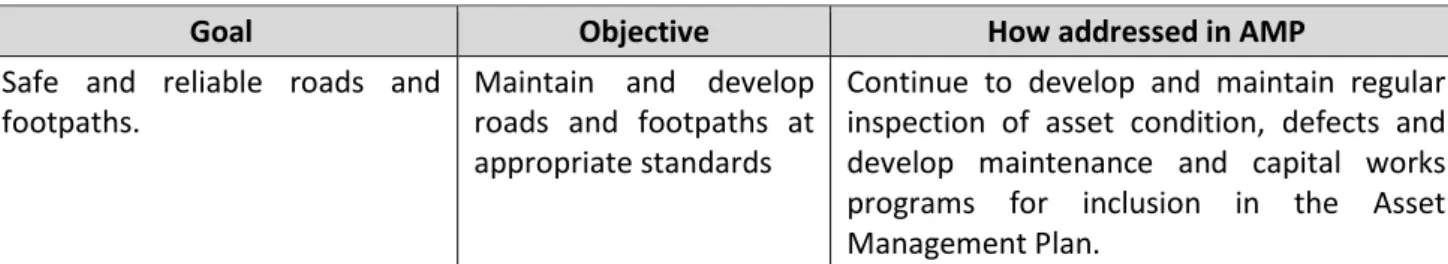
Relevant organisation goals and objectives and how these are addressed in this Asset Management Plan are:
Table 3.2: Council Goals and how these are addressed in this Plan
Goal Objective How addressed in AMP
Safe and reliable roads and footpaths.
Maintain and develop roads and footpaths at appropriate standards
Continue to develop and maintain regular inspection of asset condition, defects and develop maintenance and capital works programs for inclusion in the Asset Management Plan.
Council will exercise its duty of care to ensure public safety in accordance with the Infrastructure Risk Management Plan prepared in conjunction with this AM Plan. Management of infrastructure risks is covered in Section 5.2
3.3 Legislative Requirements
We have to meet many legislative requirements including Australian and State Legislation and State Regulations. These include:
Table 3.3: Legislative Requirements
Legislation Requirement
Local Government Act Sets out role, purpose, responsibilities and powers of local governments including the preparation of a long term financial plan supported by asset management plans for sustainable service delivery.
Road Traffic Act Sets out the rules to be followed and responsibilities of users of the road system and how the rules are enforced.
Occupational, Health and Safety Act and Regulations
Sets out the roles and responsibilities to secure the health, safety and welfare of persons at work.
Road and Jetties Act Provides for the appointment of a Commissioner of Highways and provisions for the construction and maintenance of roads and associated assets.
Australian Road Rules The Australian Road Rules are incorporated into the State Traffic Regulations under the Road Traffic Act.
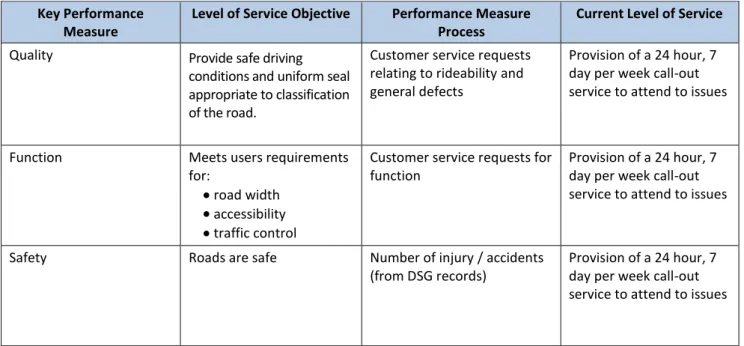
3.4 Current Levels of Service
We have defined service levels in two terms.
1) Community Levels of Service measure how the community receives the service and whether the organisation is providing community value.
Community levels of service measures used in the Asset Management Plan are: Quality How good is the service?
Function Does it meet users’ needs? Capacity/Utilisation Is the service over or under used?
Community Service level Expectations
Council officers have traditionally worked towards the provision of a level of service that is assumed to be the community’s expectation.
During any future consultation process Council will test this assumption to ensure that it is correct or amend it accordingly. The assumptions are that the road network will provide for:
reasonably direct traffic routes between important centres of community interest; ease of access to major traffic routes;
normal heavy vehicle traffic to be limited where possible to Arterial Roads managed by the State through Department of State Growth (DSG);
access to the municipal road network by heavy vehicles to be limited to those necessarily using the municipal roads (ie for business within the municipal area) and then for them to use only Link and Collector Roads other than when immediately accessing properties in order to minimise maintenance on local access roads;
limited through access along residential streets;
minimal conflict between various road user groups/vehicle types (eg cars, trucks, motor cyclists, bicyclists, pedestrians, children and people with disabilities);
suitable traffic control devices in dangerous locations especially where there is potential conflict between user groups (eg pedestrian crossings, road and street intersections);
people with disabilities, the aged, adults with children, etc in relation to potential hazards and obstructions such as road crossings, location of street furniture, light poles, sign posts, etc.
road surfaces that create minimal adverse noise conditions in residential areas, are smooth riding, accessible and safe in all the prevailing local weather conditions (ie non-slippery when wet) and free-draining;
street lighting in urban areas provides good visibility at night for all road users;
all road structures (eg. pavement base, surface, bridges, and traffic devices) to be maintained in a safe, workable condition;
street and roadside trees selected to maximise aesthetic benefit but with minimal ongoing problems e.g. hazards caused by root movement and fruit droppings;
nature strips to be suitable for easy maintenance by adjoining property owners; town street signage adequate to facilitate access for non-locals.
2) Technical Levels of Service
Supporting the community service levels are operational or technical measures of performance. These technical measures relate to the allocation of resources to service activities that the organisation undertakes to best achieve the desired community outcomes and demonstrate effective organisational performance.
Technical service measures are linked to annual budgets covering:
Operations – the regular activities to provide services such as opening hours, cleansing frequency, mowing frequency, etc.
Maintenance – the activities necessary to retain assets as near as practicable to an appropriate service condition (eg road patching and unsealed road grading),
Renewal – the activities that return the service capability of an asset up to that which it had originally (eg frequency and cost of road resurfacing and pavement reconstruction),
Upgrade – the activities to provide a higher level of service (eg widening a road, sealing an unsealed road) or a new service that did not exist previously.
Asset Management Plans, implement and control technical service levels to influence the customer service levels.3
Our current service levels are detailed in Table 3.4.
Table 3.4: Current Service Levels Road Network
Key Performance Measure
Level of Service Objective Performance Measure Process
Current Level of Service
Quality Provide safe driving conditions and uniform seal appropriate to classification of the road.
Customer service requests relating to rideability and general defects
Provision of a 24 hour, 7 day per week call-out service to attend to issues
Function Meets users requirements for:
road width accessibility traffic control
Customer service requests for function
Provision of a 24 hour, 7 day per week call-out service to attend to issues
Safety Roads are safe Number of injury / accidents (from DSG records)
Provision of a 24 hour, 7 day per week call-out service to attend to issues
Review of levels of Service
A level of service review has to be undertaken in the context of the: object of good road management;
rights of users of local streets and pathways;
ensuring that the local road and pathway network and infrastructure are as safe for users as is reasonably practicable;
priorities and social, environmental and economic needs of the community and of road users; analysis of the annual asset condition survey results, maintenance standards and asset performance targets;
analysis of fatal and serious road crashes; special needs of any sector of the community; Council’s overall policy and budgetary position;
relevant environmental, economic, social or financial policies or objective of the Tasmanian Government in relation to road management;
volume and nature of usage of local roads and pathways;
seeking to secure the most efficient and effective management and use of the local road and pathway network and infrastructure to meet the needs of the community and road users;
ensuring the most efficient use of the resources available for local road and pathway management;
3
3.5 Desired Levels of Service
Functional requirements of maintenance are outlined in the following table Table 3.5: Maintenance Functional Requirements
Asset Feature Goals / Objectives
Pavement Maintenance
Sealed Surface
Provide safe driving conditions, uniform seal appropriate to classification of the road.
Minimise rate of deterioration of the pavement.
Unsealed Road Provide safe driving conditions and ride-ability appropriate to the classification of the road.
Operational Servicing Provide timely emergency response to assist the public and minimise disruption caused by temporary loss of use of the asset.
Roadside Maintenance
Road Furniture
Signs:
Provide clear messages to motorists during both day and night conditions which are aesthetically sound.
Guard Fence:
Provide required structural resistance to errant vehicles to minimise accident severity.
Paved Islands and Footpaths:
Provide safer travel for pedestrians and be aesthetically sound. Road Markings:
Provide clear delineation of the road and traffic movements.
Vegetation
Street Trees and other Decorative Plantings:
Provide for safe travel and aesthetically pleasing environment. Roadside Verges:
minimise weed infestations, sight distance hazards, fire hazard while recognising important roadside vegetation environmental issues.
Operational Servicing
Street Lighting:
Provide prompt reporting of non-working streetlighting to Aurora.
Council’s organisational structure for service delivery from infrastructure assets is detailed below:
Customer / Officer Request
Periodic Asset Condition Inspection Risk / Defect Inspection
Customer Request System
Created in Council’s Dataworks System. Inspect & respond
within 20 days
IN
S
P
E
C
T
IO
N
S
Record Formal InspectionsIs a Priority Response Required?
MAKE SAFE (Signs, Barriers, etc)
Can remedial work be undertaken
immediately?
Carry out remedial works
Inspection Record
Defect below intervention level Maintenance intervention Priority intervention Capital work (renewal, etc)
Maintenance Defect Works (Prioritised) Implement Maintenance Program Implement Capital Works Program Capital Works Program (Prioritised) Completed work
Recorded in Asset Category of Records System.
C o m p le te d w o rk r e c o rd e d a g a in s t In s p e c ti o n r e c o rd Yes Yes No No
4.
FUTURE DEMAND
4.1 Demand DriversDrivers affecting demand include, but are not limited to: population change, changes in demographics, seasonal factors, vehicle ownership rates, consumer preferences and expectations, technological changes, economic factors, agricultural practices and environmental awareness.
4.2 Demand Forecast
The present position and projections for demand drivers that may impact future service delivery and utilisation of assets were identified and are documented below.
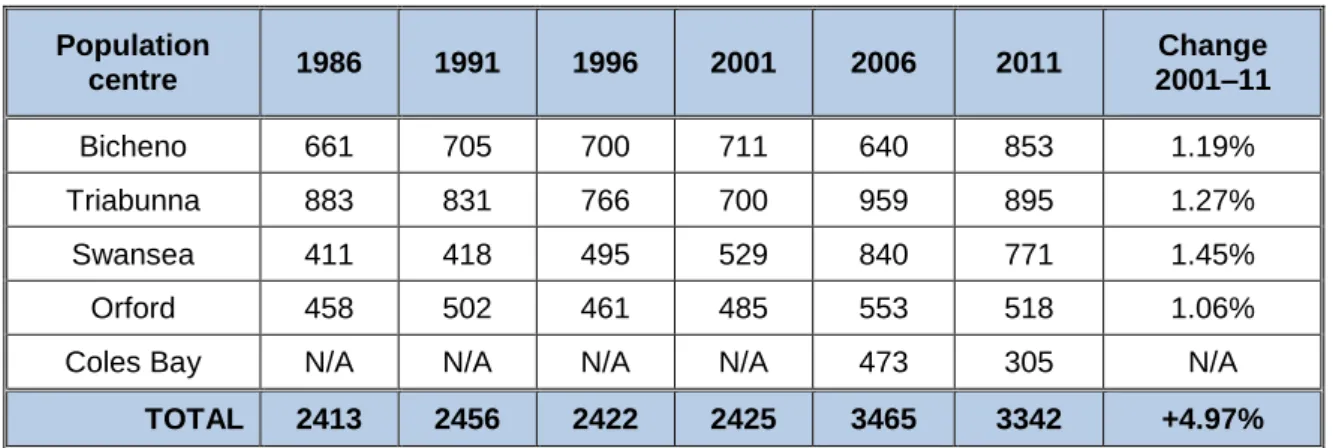
Population of the Glamorgan Spring Bay Local Government Area is estimated to be 4,905 as at June 2021. The most recent Census was conducted in 2011 with data released in June 2012. Data is added every 5 years.
The following table has been taken from ABS records through the State of the Environment Report 2003 by the Tasmanian Government. It shows the population trends of mid-size urban centres (200–19,999
people), 1986–11 for the four main Glamorgan Spring Bay towns. The following figures relate to 2011 Census.
Table 4.2: Summary of population numbers per town from 1986 – 2011.
Population
centre 1986 1991 1996 2001 2006 2011
Change 2001–11
Bicheno 661 705 700 711 640 853 1.19%
Triabunna 883 831 766 700 959 895 1.27%
Swansea 411 418 495 529 840 771 1.45%
Orford 458 502 461 485 553 518 1.06%
Coles Bay N/A N/A N/A N/A 473 305 N/A
TOTAL 2413 2456 2422 2425 3465 3342 +4.97%
Analysis of these figures show that overall the net change in these key towns is minimal. The change is +4.97% for the four town combined total over the last 10 year period from 2001 to 2011.
It is anticipated that at this rate, there will be little need for change to the adopted ‘Levels of Service’. However, there may be a general expectation within the community for ongoing improvements to basic services. Consultation is the prime means of establishing this.
4.3 Demand Impact on Assets
Demand forecasting population growth in the Council resulting in a significant increase in any of the road infrastructure assets is unlikely under present circumstances for the foreseeable future.
It is considered that the capacity of the road network is sufficient to meet current and future demands for at least the short term for other than extraordinary demands.
However, there are several specific issues of concern to Council at present:
(a) Forest harvesting – this is where the harvesting of forests generates significant increased volumes of heavy vehicles on specific roads. The additional loadings placed on some specific sections of the road network is of a real concern as it results in increased maintenance costs and the premature failure of pavements especially in wet periods.
As of 2012 the Triabunna Chip Mill is closed. The issues mentioned above have become largely irrelevant, but should remain listed in the event the industry recommences in the municipal area. Due to the past additional loadings, a number of road pavements, kerbs and footpaths are experiencing accelerated deterioration with isolated failures becoming more apparent in the Triabunna area.
(b) Impact of a National Park – where access to it has significantly increased traffic volumes on what were either Local Access or Limited Local Access Roads.
In this instance, the Douglas-Apsley National Park has caused a ‘Limited Local Access Roads’ road to effectively carry the traffic volumes of a Link or Collector Road with the subsequent increase in maintenance costs. The design standard of the road is also below what is required of its ‘new’ status. However, no rate income or any other direct form of income has been provided to council to offset the additional costs. It is a similar situation to forest harvest roads in that it has disadvantaged Council through imposition of additional road maintenance requirements.
(c) Maintenance of access roads to and across single properties – this is where Council maintains that section of road located on the actual property due to the dwelling being sited remote from the property boundary. Such a situation involves additional cost that it would if the access road was maintained only to the nearest point of the property. 4.4 Demand Management Plan
Demand for new services will be managed through a combination of managing existing assets, upgrading of existing assets and providing new assets to meet demand and demand management. Demand
management practices include non-asset solutions, insuring against risks and managing failures.
Non-asset solutions focus on providing the required service without the need for Council to own the assets and management actions including reducing demand for the service, reducing the level of service (allowing some assets to deteriorate beyond current service levels) or educating customers to accept appropriate asset failures (4). Examples of non-asset solutions include providing services from existing infrastructure such as aquatic centres and libraries that may be in another community area or public toilets provided in commercial premises.
Opportunities identified to date for demand management are shown in Table 4.4. Further opportunities will be developed in future revisions of this Asset Management Plan.
Table 4.4: Demand Management Plan Summary
Demand Driver Demand Management Plan
Urban Roads Identify and promote major transport routes with road hierarchy matched to service levels.
Rural Roads Review existing road hierarchy with matched service levels for patrol grading and resheet cycles of unsealed road network.
Identify existing rural sealed roads for possible conversion back to an unsealed pavement.
4
4.5 Asset Programs to meet Demand
The new assets required to meet growth will be acquired free of cost from land developments and constructed/acquired by the organisation. New assets constructed/acquired by the organisation are discussed in Section 5.5. The cumulative value of new contributed and constructed asset values are summarised in Figure 1.
Figure 1: Upgrade and New Assets to meet Demand (Note: Contributed Assets are minimal and do not appear on graph)
Acquiring these new assets will commit Council to fund ongoing operations, maintenance and renewal costs for the period that the service provided from the assets is required. These future costs are identified and considered in developing forecasts of future operations, maintenance and renewal costs in Section 5.
5.
LIFECYCLE MANAGEMENT PLAN
The Lifecycle Management Plan details how the organisation plans to manage and operate the assets at the agreed levels of service (defined in Section 3) while optimising life cycle costs.
5.1 Background Data
5.1.1 Physical parameters
The assets covered by this Asset Management Plan are shown in Table 2.1.
The road lengths are distributed generally throughout the urban and rural sectors of the municipality comprising approximately 1,100,000 square metres of rural sealed and unsealed pavements and 600,000 square metres of urban pavements.
The upgrade of urban streets over recent years has seen the installation of kerb and channel and footpaths which aligns a significant portion of these asset categories within the early stages of their life cycles.
5.1.2 Asset capacity and performance
Council’s services are generally provided to meet design standards where these are available. Known service performance deficiencies are listed by location in Table 5.1.2.
Table 5.1.2: Known Service Performance Deficiencies
Location Service Deficiency
Unsealed road network Resulting from complaints from users relating to rideability etc, resulting from poor cross-sectional formation and/or pavement thickness.
Sealed road network Resulting from complaints from users relating to potholes and isolated failures.
5.1.3 Asset condition
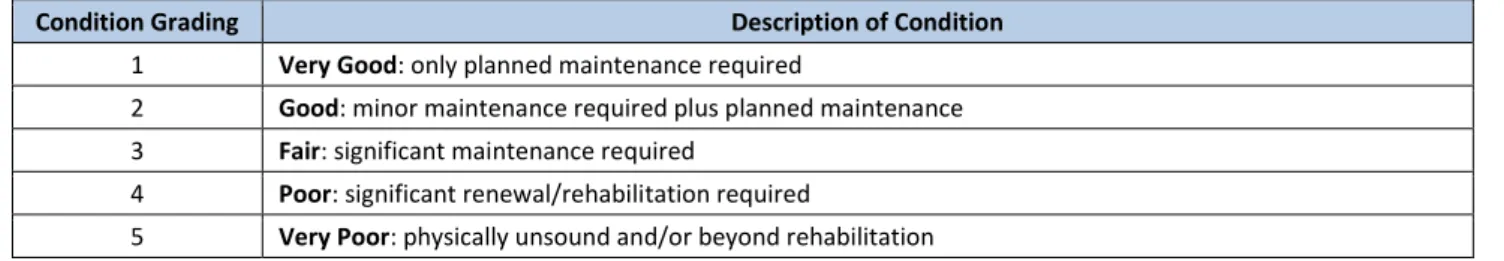
Condition is monitored using the 1 – 5 rating system as detailed in Table 5.1.3
Table 5.1.3: Simple Condition Grading Model
Condition Grading Description of Condition
1 Very Good: only planned maintenance required
2 Good: minor maintenance required plus planned maintenance 3 Fair: significant maintenance required
4 Poor: significant renewal/rehabilitation required
5.1.4 Asset valuations
The value of assets recorded in the asset register as at 30/06/2014 covered by this Asset Management Plan is shown below. Assets were last revalued at 30 June 2014. Assets are valued using the Brownfield rates.
Current Replacement Cost $73,797,624
Depreciable Amount $25,492,811
Depreciated Replacement Cost5 $48,304,812 Annual Depreciation Expense $959,616
Useful lives were reviewed in 2014 as part of this AMP process.
Various ratios of asset consumption and expenditure have been prepared to help guide and gauge asset management performance and trends over time.
Rate of Annual Asset Consumption 3.76% (Depreciation/Depreciable Amount)
Rate of Annual Asset Renewal 3.65% (Capital renewal exp/Depreciable amount)
Rate of Annual Asset Upgrade/New 1.43% (Capital upgrade exp/Depreciable amount)
Rate of Annual Asset Upgrade/New 1.43% (including contributed assets)
In 2014-15 Council plans to renew assets at 3.65% of the rate they are being consumed and will be increasing its asset stock by 1.43% in the year.
5.2 Infrastructure Risk Management Plan
An assessment of risks6 associated with service delivery from infrastructure assets has identified critical risks that will result in loss or reduction in service from infrastructure assets or a ‘financial shock’ to Council. The risk assessment process identifies credible risks, the likelihood of the risk event occurring, the
consequences should the event occur, develops a risk rating, evaluates the risk and develops a risk treatment plan for non-acceptable risks.
Critical risks, being those assessed as ‘Very High’ - requiring immediate corrective action and ‘High’ – requiring prioritised corrective action identified in the Infrastructure Risk Management Plan, together with the estimated residual risk after the selected treatment plan is operational are summarised in Table 5.2. These risks are reported to the General Manager and Council.
5
Also reported as Written Down Current Replacement Cost (WDCRC). 6
Refer GSBC Risk Management Strategy
Residual Value Depreciable
Amount
Useful Life Current
Replacement Cost
End of reporting
period 1
Annual Depreciation
Expense
End of reporting
period 2 Accumulated Depreciation Depreciated
Replacement Cost
Table 5.2: Critical Risks and Treatment Plans Service or Asset at
Risk
What can Happen Risk Rating (VH, H)
Risk Treatment Plan Treatment Costs
Unsealed road network
Reduction in number of roads with all weather access
H Review road hierarchy and match service levels to available funds
Staff time
Sealed road network
Increase in pavement failures and road roughness due to wearing of sealed surfaces
H Address resealing frequencies and develop pavement rehabilitation plan
To be determined
5.3 Routine Operations and Maintenance Plan
Operations include regular activities which provide services such as public health, safety and amenity, e.g. street sweeping, grass mowing and street lighting.
Routine maintenance is the regular on-going work that is necessary to keep assets operating, including instances where portions of the asset fail and need immediate repair to make the asset operational again.
5.3.1 Operations and Maintenance Plan
Operational activities affect service levels including quality and function through street sweeping and grass mowing frequency, intensity and spacing of street lights.
Maintenance includes all actions necessary for retaining an asset as near as practicable to an appropriate service condition including regular ongoing day-to-day work necessary to keep assets operating, eg road patching but excluding rehabilitation or renewal. Maintenance may be classified into reactive, planned and specific maintenance work activities.
Reactive maintenance is unplanned repair work carried out in response to service requests and management/supervisory directions.
Planned maintenance is repair work that is identified and managed through a maintenance management system (MMS). MMS activities include inspection, assessing the condition against failure/breakdown experience, prioritising, scheduling, actioning the work and reporting what was done to develop a maintenance history and improve maintenance and service delivery performance.
Specific maintenance is replacement of higher value components/sub-components of assets that is undertaken on a regular cycle including repainting, replacing air conditioning units, etc. This work falls below the capital/maintenance threshold but may require a specific budget allocation.
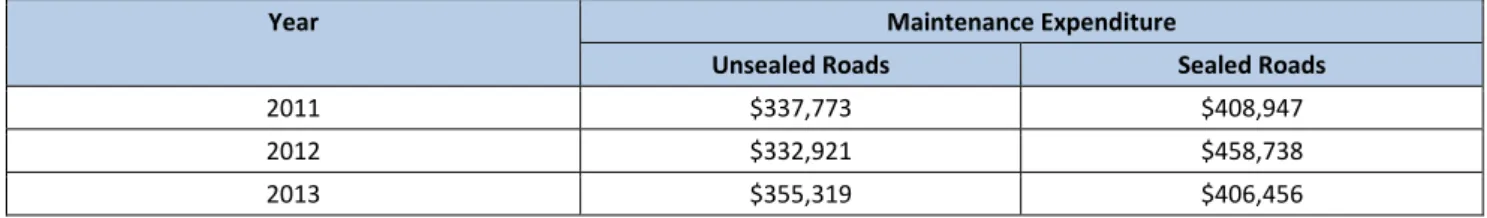
Actual past maintenance expenditure is shown in Table 5.3.1.
Table 5.3.1: Maintenance Expenditure Trends
Year Maintenance Expenditure
Unsealed Roads Sealed Roads
2011 $337,773 $408,947
2012 $332,921 $458,738
Maintenance expenditure levels are considered to be adequate to meet projected service levels, which may be less than or equal to current service levels. Where maintenance expenditure levels are such that will result in a lesser level of service, the service consequences and service risks have been identified and service consequences highlighted in this AM Plan and service risks considered in the Infrastructure Risk Management Plan.
Assessment and prioritisation of reactive maintenance is undertaken by Council staff using experience and judgement.
5.3.2 Operations and Maintenance Strategies
The organisation will operate and maintain assets to provide the defined level of service to approved budgets in the most cost-effective manner. Operation and maintenance activities include:
Scheduling operations activities to deliver the defined level of service in the most efficient manner, Undertaking maintenance activities through a planned maintenance system to reduce maintenance costs and improve maintenance outcomes.
Undertake cost-benefit analysis to determine the most cost-effective split between planned and unplanned maintenance activities,
Maintain a current infrastructure risk register for assets and present service risks associated with providing services from infrastructure assets and reporting Very High and High risks and residual risks after treatment to management and Council,
Review current and required skills base and implement workforce training and development to meet required operations and maintenance needs,
Review asset utilisation to identify underutilised assets and appropriate remedies, and over utilised assets and customer demand management options,
Maintain a current hierarchy of critical assets and required operations and maintenance activities, Develop and regularly review appropriate emergency response capability,
Review management of operations and maintenance activities to ensure Council is obtaining best value for resources used.
5.3.3 Assets Not Maintained by Council
There are a number of assets within the road reserve that Council does not have an obligation to maintain. However Council has a duty of care to ensure that these assets are in a safe condition for the public in general and may serve a notice on the property owner to have defects repaired. They are often a point of conflict with residents who have an expectation that Council will maintain them as they are within the road reserve.
These assets and the responsibility for addressing their defects are as follows:
Vehicle crossings/driveways
The portion of a vehicle crossing located between the carriageway and the property boundary is the responsibility of the adjoining property owner to maintain.
This area should only be repaired by Council if Council activities have caused damage to it or it is part of a reinstatement operation. Works carried out on a vehicle crossing at the owners’ request shall be treated as private works.
Responsibility for defect rectification
Where, any of these areas within the road reserve for which Council has a responsibility, there is a defect that is liable to cause any injury to a member of the public it must be repaired.
In such instances, the owner must be notified and directed to make the area safe and repair the defect within a period of 2 weeks and that in the event that the defect is not repaired Council will repair it as a charge against the property. Where the owner does not undertake the work in the timeframe allowed, appropriate remedial measures action must be followed up as a matter of urgency.
Utility/Agency/Business Assets
There are also assets located in the road reserve that are clearly the responsibility of other agencies. These include:
Utility assets such as telecommunications and electricity.
5.3.4 Ownership Responsibilities
Council has a number of key missions in the delivery of a transportation system, including: Ensuring cost-effective lifecycle management of assets
Providing levels of service that satisfy users and meet demand needs and safety requirements
Meeting all of these responsibilities effectively requires the availability and allocation of asset management resources.
Key current issues in relation to these functions include:
The satisfactory control of excavations and works on the road reserve by utility operators and contractors
Management systems for controlling access to the network by over-weight / over-dimensional vehicles.
5.3.5 Road Asset hierarchy
An asset hierarchy provides a framework for structuring data in an information system to assist in collection of data, reporting information and making decisions. The hierarchy includes the asset class and component used for asset planning and financial reporting and service level hierarchy used for service planning and delivery.
In developing the desired levels of service, Glamorgan Spring Bay Council has defined the hierarchies for the road network which consists of road pavements as shown in Table 5.3.5a.
The hierarchy takes into account existing and future traffic volumes and uses of the road.
The purpose of developing hierarchy categories is to enable works to be prioritised and programmed in a rational manner when undertaking maintenance and remedying defects. It provides a framework in which information on road network assets is collected, reported, and decisions made.
Arterial Roads are State Highways and Main Roads and they are the responsibility of the State Road Authority, Department of State Growth (DSG).
Table 5.3.5a: Road Asset Hierarchy Glamorgan Spring Bay Hierarchy
1. Link Roads
2. Collector Roads
3. Local Access Roads
4. Limited Local Access Roads
Appendix A provides more detail on the Glamorgan Spring Bay Road Hierarchy.
Inspection Frequencies
Inspection frequencies for the various categories within the Road Hierarchy have been nominated. These are based on what has been deemed achievable within the constraints of Council’s current funding budget. Council’s proposed service hierarchy programme. (to be developed), is shown is Table 5.3.5b.
Table 5.3.5b: Hierarchy Inspection Frequency
Road Classification
Road Defect Inspection
Footpath Inspection Link 6 monthly 6 monthly
Collector 6 monthly 6 monthly
Local Access 12 monthly 12 monthly
Limited Local
Access 12 monthly 12 monthly
Defect Inspections
Defect inspection frequencies have regard to potential hazard, the road classification and available resources. The purpose of defect inspections is to ensure that the road assets do not deteriorate beyond the tolerable defect level.
All inspections of the road assets will be conducted on the following basis:
Hazard Inspections
Hazard or safety inspections will be conducted in response to a perceived hazard or potential risk reported through Council’s Customer Action Request System or by officer or maintenance report.
An inspection will be carried out the same day the report is received by the inspecting officer and action taken to make safe, or provide appropriate warning, and to program the works in accordance with the assessed risk and the maintenance targets. Council also relies upon periodic random supervisor or staff inspections and notification by members of the public.
For road classifications upon which inspections are undertaken, random inspections and notification by members of the public shall be relied upon in between formal inspections. Council’s “Service Request” system is outlined in this Road Plan.
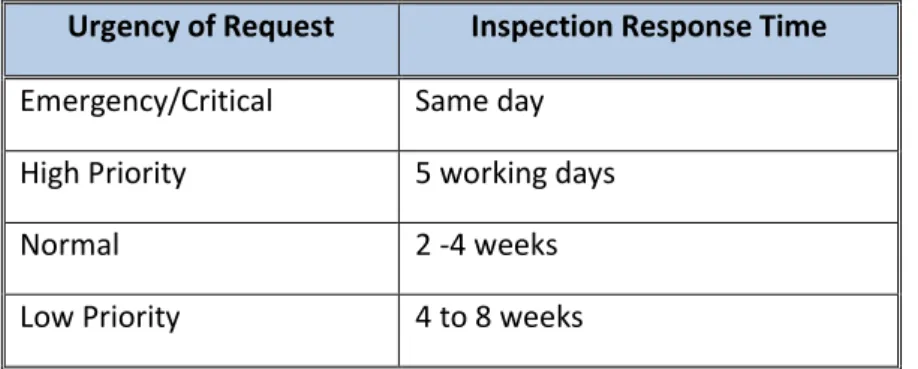
Customer Service Inspections
Requests from the public will be inspected according to the following schedule:
Urgency of Request Inspection Response Time
Emergency/Critical Same day High Priority 5 working days
Normal 2 -4 weeks
Low Priority 4 to 8 weeks
Standards and specifications
Maintenance work is carried out in accordance with the following Standards and Specifications. Council Municipal Standard Drawings
5.3.6 Summary of future operations and maintenance expenditures
Future operations and maintenance expenditure is forecast to trend in line with the value of the asset stock as shown in Figure 4. Note that all costs are shown in current 2014 dollar values (ie real values).
Assumed Inflation Rate of 2.80 %
Figure 4: Projected Operations and Maintenance Expenditure
Deferred maintenance, (ie works that are identified for maintenance and unable to be funded), are to be included in the risk assessment and analysis in the Infrastructure Risk Management Plan.
Maintenance is funded from the operating budget where available. This is further discussed in Section 6.2. 5.4 Renewal/Replacement Plan
Renewal and replacement expenditure is major work which does not increase the asset’s design capacity but restores, rehabilitates, replaces or renews an existing asset to its original or lesser required service potential. Work over and above restoring an asset to original service potential is upgrade/expansion or new works expenditure.
5.4.1 Renewal plan
Assets requiring renewal/replacement are identified from one of three methods provided in the ‘Expenditure Template’.
Method 1 uses Asset Register data to project the renewal costs using acquisition year and useful life to determine the renewal year, or
Method 2 uses capital renewal expenditure projections from external condition modelling systems (such as Pavement Management Systems), or
Method 3 uses a combination of average network renewals plus defect repairs in the Renewal Plan
and Defect Repair Plan worksheets on the ‘Expenditure template’.
All Methods were referenced as part of the preparation of this Asset Management Plan to establish the method which best represented renewal demand over the forecast period.
The useful lives and unit replacement rates of assets used to develop projected asset renewal expenditures are shown in Table 5.4.1. Asset useful lives were last reviewed on June 2014 as part of the AMP
preparation. Consideration was also given to lives and unit replacement rates adopted by similar Councils through a benchmarking exercise undertaken via the LGAT Asset Management Reform Project.
Table 5.4.1: Useful Lives and Unit Replacement Rates of Assets
Asset (Sub)Category Useful life (years) Unit Replacement Rates
Rural Sealed 60 $11.50 / m2
Rural Unsealed 30 $6.00 / m2
Urban Sealed 90 $14.50 / m2
Urban Unsealed 80 $8.00 / m2
Chip Seals 15 $6.70 / m2
Asphalt Overlays 40 $70.00 / m2
Footpaths 70 $110 / m2
Kerb and Channel 70 $100 / m
5.4.2 Renewal and Replacement Strategies
The organisation will plan capital renewal and replacement projects to meet level of service objectives and minimise infrastructure service risks by:
Planning and scheduling renewal projects to deliver the defined level of service in the most efficient manner,
Undertaking project scoping for all capital renewal and replacement projects to identify:
o the service delivery ‘deficiency’, present risk and optimum time for renewal/replacement, o the project objectives to rectify the deficiency,
o the range of options, estimated capital and life cycle costs for each options that could address the service deficiency,
o and evaluate the options against evaluation criteria adopted by Council, and o select the best option to be included in capital renewal programs,
Using ‘low cost’ renewal methods (cost of renewal is less than replacement) wherever possible, Maintain a current infrastructure risk register for assets and service risks associated with providing services from infrastructure assets and reporting Very High and High risks and residual risks after treatment to management and Council,
Review current and required skills base and implement workforce training and development to meet required construction and renewal needs,
Maintain a current hierarchy of critical assets and capital renewal treatments and timings required , Review management of capital renewal and replacement activities to ensure Council is obtaining best value for resources used.
5.4.3 Renewal ranking criteria
The general renewals strategy is to rehabilitate or replace assets when justified by assessing:
Risk: The risk of failure and associated financial and social impact justifies action (e.g. impact and extent of resulting inability to achieve access along the road, probable extent of damage to business, any health risk arising from the impediment to access).
Asset performance: Renewal of an asset when it fails to meet the required level of service. Non-performing assets are identified by the monitoring of asset reliability, capacity and efficiency during planned maintenance inspections and operational activity.
Indicators of non-performing assets include constant closures due to impassability; roughness causing damage to vehicles and produce; and risk to safety is rated high on an increasing frequency
Economics: It is no longer economic to continue repairing the asset (i.e., the annual cost of repairs exceeds the annualised cost of renewal). The retreatment intervention condition level of each asset class is shown in table 5.4.4.
Condition Inspections
Condition assessments are carried out on all road assets every three years and updated in Council’s Road Asset Management system called ‘My Data’; a system to track the degradation rate of the assets and to facilitate renewal projections. These condition assessments also provide an indication of the likely ongoing maintenance requirements.
5.4.4 Defect Intervention Levels and Response Times
The defect intervention level is that point where a defect requires remedial action. It has gone beyond the point where it can be tolerated. The implication of this is that defects can and will exist and to endeavour to address them immediately they are observed is impracticable due to the cost. It is more efficient from a cost management perspective to address defects as the maintenance vehicle/machine undertakes its cyclic rounds. However there may be times when a defect deteriorates rapidly and becomes a hazard that it requires specific attention immediately but this is not the norm.
Table 5.4.4: Intervention Condition Levels
Asset Class Intervention Condition Level
Footpaths 4.0
Kerbs 4.0
Sealed Pavement 4.0 Chip Seal Surfaces 4.0 Unsealed Pavements 4.0
Asset renewal and replacement is typically undertaken to either:
Ensure the reliability of the existing infrastructure to deliver the service it was constructed to facilitate, or
To ensure the infrastructure is of sufficient quality to meet the service requirements (eg roughness of a road).7
It is possible to get some indication of capital renewal and replacement priorities by identifying assets or asset groups that:
Have a high consequence of failure,
Have a high utilisation and subsequent impact on users would be greatest, The total value represents the greatest net value to the organisation, Have the highest average age relative to their expected lives,
Are identified in the AM Plan as key cost factors, Have high operational or maintenance costs, and
Where replacement with modern equivalent assets would yield material savings.8
Renewal and replacement standards
Renewal work is carried out in accordance with the following Standards and Specifications. Council Municipal Standard Drawings (2014)
5.4.3 Summary of future renewal and replacement expenditure
Projected future renewal and replacement expenditures are forecast to increase over time as the asset stock increases from growth. The expenditure is summarised in Fig 5. Note that all amounts are shown in real values.
7
IPWEA, 2011, IIMM, Sec 3.4.4, p 3|60. 8
Fig 5: Projected Capital Renewal and Replacement Expenditure
(Note: Gen’s 2+ not shown in above graph)
Deferred renewal and replacement, ie those assets identified for renewal and/or replacement and not scheduled in capital works programs are to be included in the risk analysis process in the Risk Management Plan.
Renewals and replacement expenditure in the organisation’s capital works program will be accommodated in the Long Term Financial Plan (LTFP). This is further discussed in Section 6.2.
5.5 Creation/Acquisition/Upgrade Plan
New works are those works that create a new asset that did not previously exist, or works which upgrade or improve an existing asset beyond its existing capacity. They may result from growth, social or
environmental needs. Assets may also be acquired at no cost to the organisation from land development. These assets from growth are considered in Section 4.4.
5.5.1 Selection criteria
New assets and upgrade/expansion of existing assets are identified from various sources such as councillor or community requests, proposals identified by strategic plans or partnerships with other organisations. Candidate proposals are inspected to verify need and to develop a preliminary renewal estimate. Verified proposals are ranked by priority and available funds and scheduled in future works programmes. The priority ranking criteria is detailed below.
Council recognises the difficulty for funding the existing road network asset, both maintenance and renewals, therefore is very cautious about undertaking creation of new assets outside of development proposals.
Provision of new or upgraded works fall into the following categories depending upon the extent and type of works:
Council funded, or
Developer funded as part of subdivisional development, or Contribution to the cost by either the developer and/or Council.
Where possible, developers of new subdivisions are required, as part of the development approvals process, to provide the basic road infrastructure to the standard appropriate for that development.
There are occasions when Council is required to upgrade an asset because of changed usage requirements. In such instances, the project is scrutinised closely by officers and is dealt with as part of the annual budget process.
When council considers its discretionary capital expenditures for new or upgraded assets it is essential to establish the consequential recurring operational and maintenance costs that will occur once the new or upgraded asset becomes operational. For instance new urban streets may well require immediate costs for street sweeping. A row of new street lights will incur ongoing electricity costs for operations immediately they are brought into use.
This consequential additional cost is “non-discretionary” as it will be incurred if the new asset is provided. Nature strips and street trees require maintenance.
As new projects are brought forward for consideration with the annual budget, they will also have an assessment of these ongoing operational (recurrent) costs presented to Council as part of the overall project cost projections.
In addition, as Council acquires new assets through the subdivision development process it is important that the consequential costs are established and allowed for in future budgets. Costs of maintaining these works is covered by rate income from the properties within the development.
It is not reasonable to expect that these costs will be absorbed into existing budgets without an increase. To do so is to effectively reduce the current levels of service to some or all of the rest of the municipal area.
5.5.2 Capital Investment Strategies
Council will plan capital upgrade and new projects to meet level of service objectives by:
Planning and scheduling capital upgrade and new projects to deliver the defined level of service in the most efficient manner,
Undertake project scoping for all capital upgrade/new projects to identify:
o the service delivery ‘deficiency’, present risk and required timeline for delivery of the upgrade/new asset,
o the project objectives to rectify the deficiency including value management for major projects,
o the range of options, estimated capital and life cycle costs for each options that could address the service deficiency,
o management of risks associated with alternative options,
o and evaluate the options against evaluation criteria adopted by Council, and o select the best option to be included in capital upgrade/new programs.
Review management of capital project management activities to ensure Council is obtaining best value for resources used.
Standards and specifications for new assets and for upgrade/expansion of existing assets are the same as those for renewal shown in Section 5.4.2.
5.5.3 Summary of future upgrade/new assets expenditure
Projected upgrade/new asset expenditures are summarised in Fig 6. The projected upgrade/new capital works program is shown in Appendix B. All amounts are shown in real values.
Fig 6: Projected Capital Upgrade/New Asset Expenditure
Expenditure on new assets and services in the organisation’s capital works program will be accommodated in the long term financial plan. This is further discussed in Section 6.2.
5.6 Disposal Plan
There are at present no road, footpath or kerb and channel assets within the municipal area under Council jurisdiction that are proposed for disposal without replacement.
Disposal of roads could occur where they are:-
Requested by residents and approved by Council;
Handed over or back to a private interest of other authority; or
Where utilisation studies specifically demonstrates that insufficient or no use is occurring, and the continuing existence of the asset is not justified.
Council’s asset records are adjusted to reflect the change in asset value as a result of reconstruction and the creation of a ‘new’ asset with a higher value than the one replaced.
Recognition also needs to be made in the Recurrent/Operating budget of the reduction of associated operating or maintenance costs of the decommissioned assets.
5.7 Service Consequences and Risks
Council has prioritised decisions made in adopting this AM Plan to obtain the optimum benefits from its available resources. Decisions are made based on the development of 3 scenarios of AM Plans.
Scenario 1 - What we would like to do based on asset register data
Scenario 2 – What we should do with existing budgets and identifying level of service and risk
consequences (ie what are the operations and maintenance and capital projects we are unable to do, what is the service and risk consequences associated with this position). This may require several versions of the AM Plan.
Scenario 3 – What we can do and be financially sustainable with AM Plans matching Long Term Financial Plans.
The development of scenario 1 and scenario 2 AM Plans provides the tools for discussion with the Council and community on trade-offs between what we would like to do (scenario 1) and what we should be doing with existing budgets (scenario 2) by balancing changes in services and service levels with affordability and acceptance of the service and risk consequences of the trade-off position (scenario 3).
6. FINANCIAL SUMMARY
This section contains the financial requirements resulting from all the information presented in the previous sections of this asset management plan. The financial projections will be updated as further information becomes available on desired levels of service and current and projected future asset performance.
6.1 Financial Statements and Projections
The financial projections are shown in Fig 7 for projected operating (operations and maintenance) and capital expenditure (renewal and upgrade/expansion/new assets).
Note that all costs are shown in real values.
Fig 7: Projected Operating and Capital Expenditure (Note: Disposals and Operations do not appear in this graph)
6.1.1 Sustainability of service delivery
There are four key indicators for service delivery sustainability that have been considered in the analysis of the services provided by this asset category; these being the asset renewal funding ratio, long term life cycle costs/expenditures and medium term projected/budgeted expenditures over 5 and 10 years of the planning period.
All dollar values are in ($’000)’s for this report.
Asset Renewal Funding Ratio 101%
Long Term - Life Cycle Costs
Life Cycle Cost [average 10 years projected ops, maint exp and deprn.] $1,736 Life Cycle Exp [average 10 years LTFP budget ops, maint and capital renewal exp] $1,577
Life Cycle Gap [life cycle expenditure – life cycle cost (-ve = gap)] $-159
Life Cycle Indicator [life cycle expenditure / life cycle cost] 91%
Medium Term - 10 year financial planning period
10 yr Ops, Maint and Renewal Projected Expenditure $1,608
10 yr Ops, Maint and Renewal LTFP Budget Exp $1,577
10 year financing shortfall [10 yr proj exp - LTFP Budget exp] $-32
10 year financing indicator [LTFP Budget exp / 10 yr proj exp] 98%
Medium Term – 5 year financial planning period
5 yr Ops, Maint and Renewal Projected Expenditure $1,554
5 yr Ops, Maint and Renewal LTFP Budget Exp $1,543
5 year financing shortfall [5 yr proj exp - LTFP Budget exp] $-11
5 year financing indicator [LTFP Budget exp / 5 yr proj exp] 99%
Asset management financial indicators
Figure 7A shows the asset management financial indicators over the 10 year planning period and for the long term life cycle.
Providing services from infrastructure in a sustainable manner requires the matching and managing of service levels, risks, projected expenditures and financing to achieve a financial indicator of approximately 1.0 for the first years of the Asset Management Plan and ideally over the 10 year life of the Long Term Financial Plan.
Figure 8 shows the projected asset renewal and replacement expenditure over the 20 years of the AM Plan. The projected asset renewal and replacement expenditure is compared to renewal and replacement expenditure in the Capital Works Program, which is accommodated in the Long Term Financial Plan.
Figure 8: Projected and LTFP Budgeted Renewal Expenditure
Table 6.1.1 shows the shortfall between projected renewal and replacement expenditures and expenditure accommodated in long term financial plan. Budget expenditures accommodated in the long term financial plan or extrapolated from current budgets are shown in Appendix C.
Table 6.1.1: Projected and LTFP Budgeted Renewals and Financing Shortfall Year Projected
Renewals ($000)
LTFP Renewal Budget ($000)
Renewal Financing Shortfall ($000) (-ve
Gap, +ve Surplus)
Cumulative Shortfall ($000) (-ve Gap, +ve Surplus)
2014 $870 $935 $65 $65
2015 $827 $810 $-17 $48
2016 $827 $830 $3 $51
2017 $827 $790 $-37 $14
2018 $827 $850 $23 $37
2019 $827 $850 $23 $60
2020 $827 $830 $3 $63
2021 $827 $790 $-37 $26
2022 $827 $860 $33 $59
2023 $827 $855 $28 $87
Providing services in a sustainable manner will require matching of projected asset renewal and replacement expenditure to meet agreed service levels with the corresponding capital works program accommodated in the long term financial plan.
6.1.2 Projected expenditures for Long Term Financial Plan
Table 6.1.2 shows the projected expenditures for the 10 year Long Term Financial Plan. Expenditure projections are in 2014 real values.
Table 6.1.2: Projected Expenditures for Long Term Financial Plan ($000)
Year Operations
($000) Maintenance ($000)
Projected Capital Renewal ($000)
Capital Upgrade/ New ($000)
Disposals ($000)
2014 $0 $673 $870 $364 $0
2015 $0 $694 $827 $364 $0
2016 $0 $718 $827 $364 $0
2017 $0 $741 $827 $364 $0
2018 $0 $764 $827 $364 $0
2019 $0 $788 $827 $364 $0
2020 $0 $811 $827 $364 $0
2021 $0 $836 $827 $364 $0
2022 $0 $860 $827 $364 $0
2023 $0 $885 $827 $364 $0
6.2 Funding Strategy
After reviewing service levels, as appropriate to ensure ongoing financial sustainability, projected
expenditures identified in Section 6.1.2 will be accommodated in the Council’s 10 year Long Term Financial Plan.
6.3 Valuation Forecasts
Asset values are forecast to increase as additional assets are added to the asset stock from construction and acquisition by Council and from assets constructed by land developers and others that are donated to the Council.
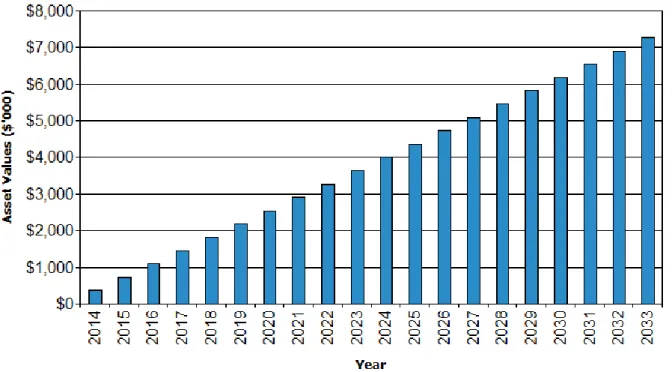
Figure 9: Projected Asset Values
Depreciation expense values are forecast in line with asset values as shown in Figure 10.
The depreciated replacement cost will vary over the forecast period depending on the rates of addition of new assets, disposal of old assets and consumption and renewal of existing assets. Forecast of the assets’ depreciated replacement cost is shown in Figure 11. The depreciated replacement cost of contributed and new assets is shown in the darker colour and in the lighter colour for existing assets.
Figure 11: Projected Depreciated Replacement Cost
6.4 Key Assumptions made in Financial Forecasts
This section details the key assumptions made in presenting the information contained in this Asset Management Plan and in preparing forecasts of required operating and capital expenditure and asset values, depreciation expense and carrying amount estimates. It is presented to enable readers to gain an understanding of the levels of confidence in the data behind the financial forecasts.
Key assumptions made in this Asset Management Plan and risks that these may change are: Projections are based on local operating knowledge only,
7.
PLAN IMPROVEMENT AND MONITORING
7.1 Status of Asset Management Practices7.1.1 Accounting and financial systems
Council uses the ‘XERO’ Financial Management System.
Accountabilities for financial systems
The General Manager and Finance Officer are responsible for the accounting and financial systems.
Accounting Standards and Regulations
Council works under Australian Accounting Standards and State Legislation/Regulations and Directives issued by the Local Government Department.
7.1.2 Asset Management System
Council uses the ‘MyData’ Asset Management System and ‘Mapinfo’ Geographic Information System
Accountabilities for Asset Management system and data maintenance