NEIGHBORHOOD
AIR QUALITY
AND HEALTH
Michele Plaugic
PLAN 992
Spring 2019
Quantifying outdoor air
Table of Contents
Background
���������������������������������������������������������������������������������������������������������������������������������������
3
Health impacts of outdoor air pollution
���������������������������������������������������������������������������������
3
Study area
��������������������������������������������������������������������������������������������������������������������������������
5
Current air quality trends in Philadelphia
�������������������������������������������������������������������������������
5
Methodology
�������������������������������������������������������������������������������������������������������������������������������������
8
Variables
�����������������������������������������������������������������������������������������������������������������������������������
8
Analysis
����������������������������������������������������������������������������������������������������������������������������������
11
Discussion and limitations
������������������������������������������������������������������������������������������������������������
17
Existing Policies & Programs in the U.S.
���������������������������������������������������������������������������������������
17
Local and regional regulations
���������������������������������������������������������������������������������������������
17
Long Beach, CA
������������������������������������������������������������������������������������������������������������������
17
Los Angeles, CA
������������������������������������������������������������������������������������������������������������������
19
Oakland, CA
������������������������������������������������������������������������������������������������������������������������
19
Louisville, KY
�����������������������������������������������������������������������������������������������������������������������
19
Boston, MA
�������������������������������������������������������������������������������������������������������������������������
19
Buffalo, NY
��������������������������������������������������������������������������������������������������������������������������
19
Philadelphia, PA
������������������������������������������������������������������������������������������������������������������
19
Pittsburgh, PA
���������������������������������������������������������������������������������������������������������������������
20
Background
Health impacts of outdoor air pollution
Outdoor air pollution accounts for approximately
3.3 million premature deaths per year worldwide (Lelieveld, Evans, Fnais, Giannadaki, & Pozzer, 2015).
In the U�S�, outdoor air pollution comes
predomi-nantly from vehicle emissions and power generation (Caiazzo, Ashok, Waitz, Yim, & Barrett, 2013). Carbon
dioxide, carbon monoxide, hydrocarbons, nitrogen oxides, particulate matter, and secondary by-products
like ozone make up a significant portion of vehicle and power generation emissions, each of which can
lead to negative health and environmental impacts
(Health Effects Institute, 2010; Buckeridge et. al, 2002; Munir, Chen, & Ropkins, 2012). Particulate matter (PM 2.5) and ground-level ozone are responsible for the most significant health effects from air pollution (U.S. EPA, 2011). PM 2.5 describes small, air-suspended particles that are less than or equal to 2.5 microns
in diameter, such as those found in smoke and haze
(U.S. EPA, 2011). Ground-level ozone is created when
nitrogen oxides and volatile organic compounds,
pol-lutants from motor vehicles and power plants, react with sunlight (U.S. EPA, 2018c). The U.S. Environmen
-tal Protection Agency estimates that in 2010, approx
-imately 160,000 premature deaths were associated with particulate matter exposure, and 4,300 deaths with ozone exposure (U.S. EPA, 2011). Given that the
majority of the U�S� population lives in an urban area, the potential for exposure to outdoor air pollution is substantial�
Outdoor air pollutants can have serious and per-manent health effects among exposed populations�
These pollutants act as both a risk factor for the inci
-dence of certain diseases, as well as an exacerbating factor among those with existing health conditions. Exposure to PM 2.5 is associated with increased hos -pital admission rates for asthma, bronchitis, chronic obstructive pulmonary disease, pneumonia, and upper
respiratory tract infections (Buckeridge et. al, 2002). There are also examples in the U.S. of decreased traf
-fic having a positive impact on respiratory diseases. During the 1996 Summer Olympic Games in Atlanta, GA, decreased traffic density downtown resulted in reduced ozone pollution and significantly fewer hos -pital visits for childhood asthma events (Friedman,
Powell, Hutwagner, Graham, & Teague, 2001).
Traffic-related air pollution is associated with an
increased risk of adult and child asthma, impaired lung function, and chronic obstructive pulmonary
disease (Guarnieri & Balmes, 2014; Health Effects Institute, 2010; McConnell et. al, 2010; Gan, FitzGer
-ald, Carlsten, Sadatsafavi, & Brauer, 2013; Son, Kim, & Bell, 2015). In near-highway neighborhoods in Boston, MA, elevated concentrations of ultrafine particles were associated with higher rates of cardiovascular
diseases, including hypertension, stroke, and heart
disease (Li, 2017). Exposure to PM 2.5 and nitrogen dioxide is associated with an increased risk of dia
-betes (Lim et. al, 2018; Bowe et. al, 2018). Pregnant women are especially susceptible to the risks of
outdoor air pollution� Maternal air pollution
concentra-tion exposure is significantly associated with prema
-turity and low birth weight babies (Bobak, 2000; Lee, Roberts, Catov, Talbott, & Ritz, 2012). First trimester exposure to PM 2.5 and ozone was associated with
preeclampsia and gestational hypertension among
pregnant women at a Pittsburgh, PA hospital (Gray, Edwards, Schultz, & Miranda, 2014; Lee et. al, 2012).
Additionally, in a study comparing preeclampsia risk
among pregnant women exposed to PM 2.5, asth
-matic women were at a greater risk of preeclampsia than non-asthmatic women (Mendola et. al, 2016). The severity of air pollution exposure is often directly
affected by individual vulnerability and risk factors� Populations that are particularly vulnerable to
poor air quality include those with respiratory impair -ments like asthma or cardiovascular disease, young
children, older adults, and pregnant women (Joint Research Centre, 2015; Makri & Stilianakis, 2007).
Often, these health outcomes are a direct result of
environmental injustice, when industry and highways cut through low-income neighborhoods with fewer
resources to protect themselves� In the U�S�,
popula-tions with greater exposure to traffic-related air pollu
-tion are non-white popula-tions and those with lower socio-economic status (Pratt, Vadali, Kvale, & Ellick
children in low-income neighborhoods are particularly
vulnerable to air pollution-related asthma (O’Lenick et�
al, 2016).
Outdoor air pollution can influence mental health outcomes as well as physical health. In a study of emergency department visits in Ottawa, Canada, there was an association between ambient air pollution and
emergency department visits for depression among
women (Szyszkowicz & Tremblay, 2011).
The relationship between outdoor air pollution and
related health outcomes requires consideration and coordination among city planners, housing advocates,
public health officials, and medical professionals.
While many large cities across the U�S� are facing an increased demand for housing, the opportunities for
siting new developments are limited by the remain -ing available space and the desirability of certain
locations. However, siting compact, walkable urban spaces and residential development within high traffic
areas can lead to an increase in human exposure to
traffic-related air pollution (Marshall, Brauer, & Frank, 2009; Schweiter & Zhou, 2010). Identifying exposure
and vulnerability to outdoor air pollution can help cities make appropriate planning and policy decisions to protect current and future residents�
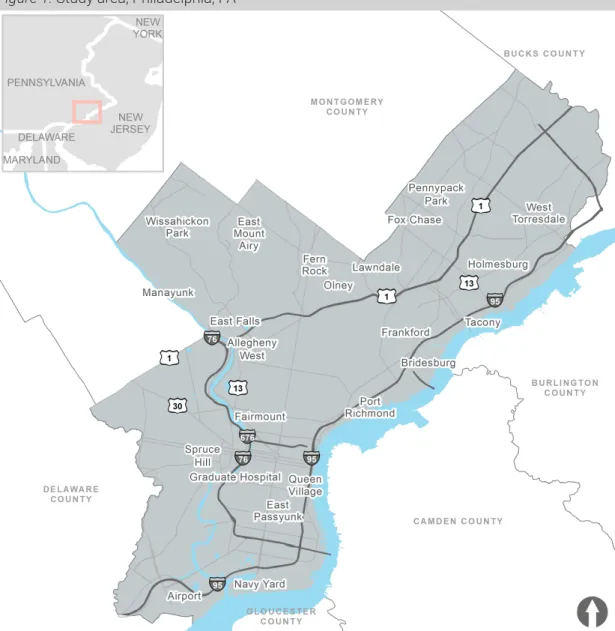
Study area
Philadelphia, PA is surrounded by the Schuylkill
River on the west and the Delaware River on the east, where port operations and industrial activities
have historically situated (Figure 1). The city has a population of 1,569,657 with a population density of 11,705 people per square mile (Social Explorer, 2017). 22% of the population are under 18 years old, 53.6%
Current air quality trends in
Philadelphia
Philadelphia is a non-attainment area for ozone
and a maintenance area for PM 2.5 based on the National Ambient Air Quality Standards (NAAQS) (DVRPC, n.d.). While air quality in the city overall has improved over the last few decades (Figure 2), partic -ular neighborhoods are still facing a disproportionate
share of outdoor air pollution (Kondo, Mizes, Lee, & Burstyn, 2013). For example, the Port Richmond neighborhood of Philadelphia, which has historically been the site of heavy industrial uses as well as diesel truck traffic from port activities, has a high poverty
rate and higher rates of asthma than the city average (Figure 3) (Kondo et. al, 2013).
Nationally, the asthma prevalence among
chil-dren aged 0-17 years in 2016 was 8.3%, while the
prevalence in Philadelphia County that same year
among school-aged children was 18.6%, and up to 31% in some neighborhoods (CDC, 2018; Pennsyl
-vania Department of Health, 2016; Trinacria, 2018).
Adult asthma prevalence is also higher in
Philadel-phia County than Pennsylvania or the U.S. as a whole
(Figure 7), and the state of Pennsylvania has a higher
asthma prevalence compared to other states (Figure 4). A 2018 State of the Air report from the American
Lung Association gave Philadelphia County an ‘F’ rating for ozone based on the number of high ozone
days from 2014 to 2016 (American Lung Association, 2018). In 2017, Philadelphia ranked 2nd in the state for unhealthy air quality days and 5th for moderate Figure 2. Days with poor air quality, 1990 - 2014
Source: U.S. EPA, 2018a
are between 18 – 55, and 24.4% are over 55 (Social Explorer, 2017). The population is 41.3% Black or Afri
-can Ameri-can, 34.9% white, 7% Asian, and 2% identify as two or more races (Social Explorer, 2017). 14.1% identify as Hispanic or Latino (Social Explorer, 2017). The unemployment rate is 11.3%, and 19.9% of fami
-lies are living below the poverty level, which is higher than the national unemployment rate of 6.6% with 10.5% of families living below the poverty level (Social Explorer, 2017). In Philadelphia, 34.7% of households are spending more than 30% of their income on hous
-ing costs, while nationally, 28.8% of households are spending more than 30% of their income on housing costs (Social Explorer, 2017). Philadelphia also has
a larger proportion of renter-occupied housing units
(47.8%) than the U.S. as a whole (36.2%) (Social Explorer, 2017).
0 40 80 120
1990 1994 1998 2002 2006 2010 2014
Figure 3. Adult asthma prevalence, Philadelphia, PA, 2017
Figure 4. Adult asthma prevalence by state, 2015
Variables
Methodology
This research is aimed at providing quantita -tive support for policies and programs focused on minimizing outdoor air pollution near residential neighborhoods� From existing research, there are health risks connected to living in close proximity to sources of outdoor air pollution, namely industrial
activities and high-volume roadways (HEI, 2010). This research explores the association between neigh -borhood air pollution variables and related chronic health conditions, including asthma, cardiovascular
disease, COPD, high blood pressure, and stroke. To visualize which areas of the city were most vulnera -ble to outdoor air pollution, I created a risk index for outdoor air pollution based on elements of exposure,
susceptibility, and adaptability, based on research by
Yi Ge et. al (2017).
There are currently twelve air monitoring stations
across the city, but only four stations currently test for
ozone while seven stations test for PM 2.5. (Figure 6). Due to limited air monitoring data and lack of
small-scale emissions data for the city, I used proxy variables to account for outdoor pollution exposure,
shown in Table 1. These variables include distance to roadways with Average Annual Daily Traffic (AADT) > 15,000, distance to roadways with weekday truck count > 1,200,distance to industrial areas, distance to roadways with volume-to-capacity ratio >= 0�85, which is a measure of traffic congestion, and road density�
High-volume AADT and high-volume truck count thresholds were determined by exploring each vari -able’s descriptive statistics, spatial distribution, and
alignment with Class 1 and Class 2 roadway data. Demographic and spatial variables were used to
measure neighborhood susceptibility and adaptability, including population density, income, health insurance coverage, education, proximity to green space, smok-ing, race,age, and sex. These data were all calculated
at the Census tract level�
Data
Source
Asthma, cardiovascular disease, COPD, stroke, high BP 500 Cities, CDC 2017
Population density American Community Survey, 2016, U.S. Census
Income American Community Survey, 2016, U.S. Census
Lack of health insurance 500 Cities, CDC, 2017
Education American Community Survey, 2016, U.S. Census
AADT, truck counts PennDOT 2017
Green space Philadelphia City Planning Commission
Industrial areas Philadelphia City Planning Commission
Smoking 500 Cities, CDC
Race American Community Survey, 2016, U.S. Census
Volume to capacity ratio (congestion) Delaware Valley Regional Planning Commission, 2015
Road density Philadelphia street centerlines shapefile, 2018
Age American Community Survey, 2016 U.S. Census
Sex American Community Survey, 2016 U.S. Census
Table 1� Data and sources
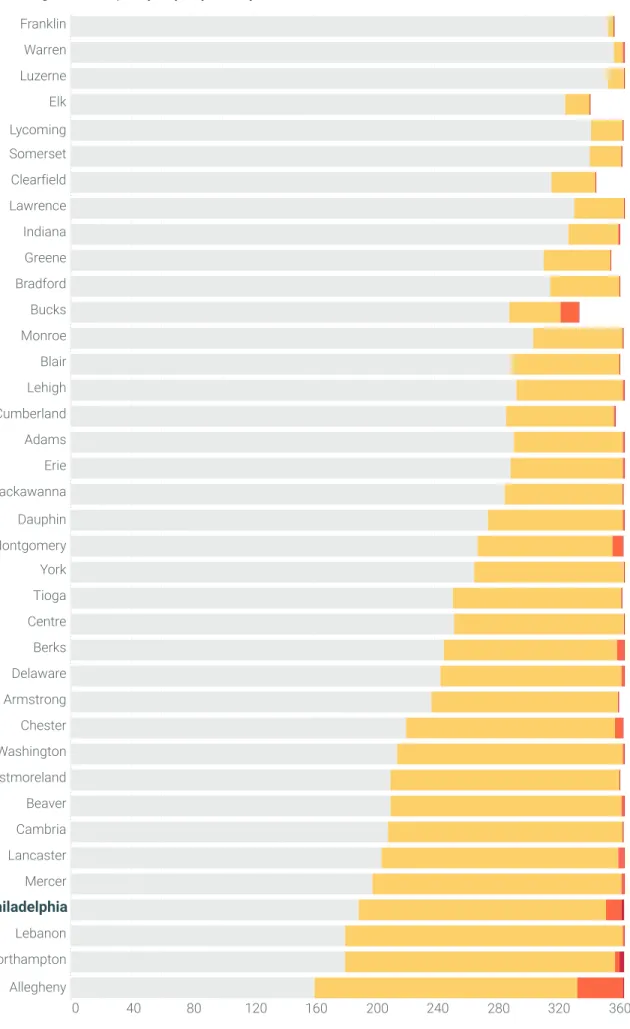
air quality days (Figure 5). Research at NYU’s Marron Institute of Urban Management found that 132 deaths and 254 incidents of respiratory and cardiovascular
diseases each year in Philadelphia can be attributed
Figure 5. Air quality days by county, 2017
Source: U.S. EPA, 2018a
0 40 80 120 160 200 240 280 320 360
Franklin Warren Luzerne Elk Lycoming Somerset Clearfield Lawrence Indiana Greene Bradford Bucks Monroe Blair Lehigh Cumberland Adams Erie Lackawanna Dauphin Montgomery York Tioga Centre Berks Delaware Armstrong Chester Washington Westmoreland Beaver Cambria Lancaster Mercer
Philadelphia
Lebanon Northampton Allegheny
Good days
Moderate days
Unhealthy for sensitive groups
Figure 6. Air monitoring stations, Philadelphia, 2015
Figure 7. Adult asthma prevalence in PA and U.S., 2015-2017
Source: CDC, 2017 & CDC, 2018
Analysis
To measure neighborhood outdoor air pollution
risk, I created an air pollution risk index that combines three measures of risk: susceptibility, exposure, and
adaptability. All data cleaning and analysis was com
-pleted in R (R Core Team, 2013). Variables and dimen -sions are described in Table 2. Census tracts were considered exposed to high AADT, high truck volume, industry, traffic congestion, and high road density if they were within 1,000 feet of those uses. This dis
-tance was chosen based on research by the Health Effects Institute (2010), which defines traffic emis
-sions exposure zones within a range of 300 – 500 meters from the source. Z-scores were calculated for
each variable in order to standardize the results, and
the z-scores were then summed to create an index using the following equation:
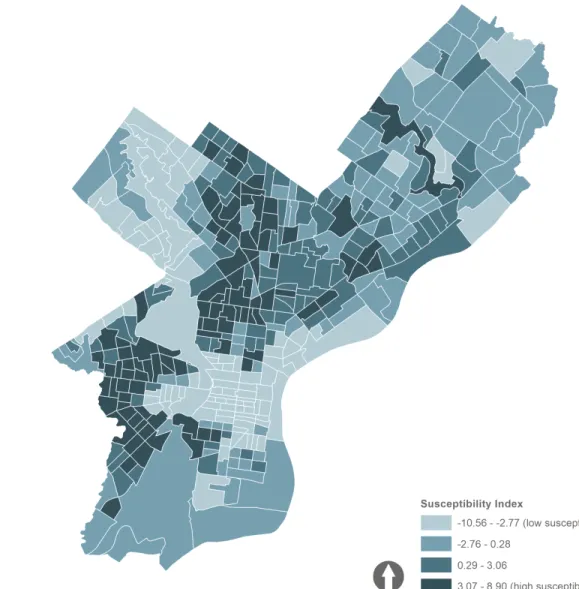
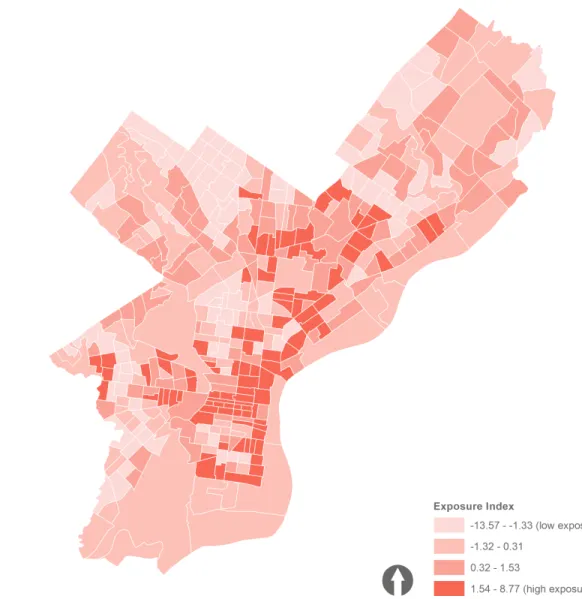
Exposure, susceptibility, adaptability, and the
composite risk index measures were then joined to
spatial data in order to visualize the spatial
distribu-tion of high-risk Census tracts in ArcMap (ESRI, 2016). High-risk neighborhoods were defined as people living
in Census tracts in the highest quartile of the risk
index, while the other three quartiles were defined as low risk. While exposure to traffic and industrial air Risk Index = Susceptibility + Exposure - Adaptability
pollution is somewhat evenly distributed across the
city, likely due to road density and street connectivity, susceptibility and adaptability factors modify the
relationship between exposure and asthma. Census tracts with high susceptibility and low adaptability
Indicator
Description
Dimension
Impact
Children Percent of population under 15 years old Susceptibility +
Elderly Percent of population over 65 years old Susceptibility +
Female Percent female Susceptibility +
Race Percent African American Susceptibility +
Income Percent making $25K or less Susceptibility +
Education Percent with HS degree or less Susceptibility +
Smoking Percent smokers Susceptibility +
Population
Den-sity Population density Exposure +
AADT Census tract within 1,000 ft of high AADT road (>= 15,000) (1=yes, 0=no) Exposure +
Indicator
Description
Dimension
Impact
Truck Counts Census tract within 1,000 ft of high truck count road (>= 1,200) (1=yes, 0=no) Exposure +
Industrial area Census tract within 1,000 ft of industrial area (1=yes, 0=no) Exposure +
Congestion Census tract within 1,000 ft of congested road (>=0.85) (1=yes, 0=no) Exposure +
Road density Census tract within 1,000 ft of dense road network (defined as density >= 36 which is the top quartile) (1=yes, 0=no) Exposure +
Income Household income > $100,000/year Adaptability
-Education Percent with Bachelor's degree or greater Adaptability
-Health insurance Percent with health insurance Adaptability
-Green space Census tract touches the boundary of green space (1 = Yes, 0 = No) Adaptability
-After creating the risk index, I used logistic
regres-sion to examine the association between living in a
high-risk neighborhood and the likelihood of having
certain chronic diseases. The dichotomous depen
-dent variable was the prevalence of related health out -comes in the high-risk Census tracts compared to the
city-wide prevalence, where 1 = tract rate is greater than city prevalence and 0 = tract rate is less than or
equal to the city prevalence�
The risk index was a significant predictor of related
health outcomes in Philadelphia (Table 3). For a one
unit increase in the risk index, the odds of having higher asthma rates than the city average increase
by a factor of 1.42 (95% CI, 1.33 - 1.54). Similarly, the
odds of having high blood pressure rates increase
by a factor of 1.24 (95% CI, 1.19 – 1.31), the odds of
having higher coronary heart disease rates increase
by a factor of 1.24 (95% CI, 1.18 – 1.30), the odds of having higher COPD rates increase by a factor of 1.44 (95% CI, 1.35 – 1.55), and the odds of having higher rates of stroke increase by a factor of 1.29 (95% CI, 1.23 – 1.37).
Variable
City Prevalence
Odds Ratio (OR)
95% Confidence Interval
Asthma 11.6% 1.42 1.33 – 1.54
High blood pressure 32.9% 1.24 1.19 – 1.31
Coronary heart disease 6.3% 1.24 1.18 – 1.30
Chronic obstructive
pul-monary disease 7% 1.44 1.35 – 1.55
Stroke 3.9% 1.29 1.23 – 1.37
Table 3� City prevalence and odds ratios
are also some of the highest risk tracts� Some of the
Discussion and limitations
Census tracts with a risk index in the highestquartile had increased odds of having higher rates of each of the negative health outcomes included in the
model. While the specific cause of these disparities
has not been studied in this research, it is obvious that certain tracts share a disproportionate risk from
exposure to outdoor air pollution. The inverse spatial relationship between those tracts with high suscep
-tibility and those with high adaptability confirm that
those areas most at-risk from outdoor air pollution are also those that are already vulnerable, particularly
low-income and African American neighborhoods. Tracts that have populations with high rates of exist -ing health conditions like asthma and high blood pressure are particularly vulnerable to outdoor air pollutants�
There are some limitations of these findings.
First, this research is limited by the available data, and thus may not capture all potential sources of
outdoor air pollution. This analysis doesn’t include any
measure of occupational exposure to air pollutants or indoor air quality, aside from smoking rates�
Explor-atory analysis was used to examine building code
violations and median build year for structures in the
city as a way to control for indoor air quality, but the number of code violations did not accurately reflect issues with mold, lead, asbestos, or other building
materials that directly relate to indoor air quality, as code violations are given for a variety of factors, and
there wasn’t enough variability in the median age of
structures to provide meaningful data�
Additionally, the scale of the data may not
accu-rately reflect dispersion of outdoor air pollutants like ozone and PM 2.5. While the data was gathered at
the smallest geographic level available, the analysis is
likely still missing some specificity as to which small
neighborhoods are seeing consistently high levels
of air pollutants from stationary as well as mobile sources. Thus, while this research could be used to
prioritize neighborhoods for mitigation efforts, more research is needed to understand the severity of
pol-lution from local sources. The risk index itself could be improved by creating a weighting value for each
variable developed from existing research to account
for the influence that each factor has on outdoor air
pollution risk�
Existing Policies & Programs
in the U.S.
The Clean Air Act requires the Environmental Pro -tection Agency to monitor and regulate criteria air pol-lutants and oversee state and local efforts (U�S� EPA,
2018b). Common local regulations to regulate and mitigate traffic-related air pollution include no-idling laws, highway noise barriers, environmental impact
assessments, and green space requirements�
Local and regional regulations
This section describes municipal, organizational and institutional efforts within the U.S. to reduce traffic-related air pollution. This is not an exhaustive
list, but rather highlights novel and contributory efforts around outdoor air pollution mitigation in U�S� cities�
A map of where these efforts are taking place can be
seen in Figure 12�
Long Beach, CA
THE (Trade, Health, Environment) Impact Study was a partnership between the University of Southern
California and community organizations concerned about the impacts that freight and truck
transporta-tion were having on local residents (Natransporta-tional Institute of Environmental Health Sciences, 2018). Trained community members were responsible for measur
-ing air pollution and collect-ing and report-ing traffic data. The project increased awareness of the con
-sequences of traffic-related air pollution, and helped garner support among city officials and environmental
decision makers (National Institute of Environmental
The city of Boston has established parking freezes for three areas in the city: Downtown, South Boston, and East Boston. The freezes, which are managed
by the city’s Air Pollution Control Commission, limit the availability of parking spaces in the established
freeze zones (City of Boston, 2019). The Downtown
and South Boston areas limit commercial and some
residential parking, while the East Boston area limits park-and-fly spaces and rental parking spaces associ
-ated with the airport (City of Boston, 2019). There are also institutional efforts in Boston to mitigate traffic-related air pollution. Tufts University oversees the Community Assessment of Freeway Exposure and Health (CAFEH) Study, which conducts
community-based participatory research on air
pol-lution near freeways and other busy roadways (Tufts University, 2011). CAFEH researchers partner with
local communities to measure pollution, monitor air quality, provide design solutions, and engage in air
pollution mitigation initiatives like retrofitting buildings with air filtration devices (Tufts University, 2011).
Boston, MA
Louisville, KY
AIR Louisville is a collaboration between the city
of Louisville and health and environmental
organi-zations. The program provides GPS sensors that
attach to asthma inhalers to local residents (AIR
Louisville, 2017). Combined with environmental data, these data are used to understand when, where, and why residents are using their inhalers. After track -ing their asthma for a year, people in the program reported improvement in their asthma events, and AIR
Philadelphia does have policies and plans in place to address disparities in asthma rates around the city�
One intended benefit of the Philadelphia2035
com-prehensive plan is to lower rates of chronic disease, with a particular focus on reducing asthma rates through decreased traffic volume and congestion and establishing a connected network of parks and trails (City of Philadelphia, 2011). The regional planning
organization for the greater Philadelphia area,
Dela-ware Valley Regional Planning Commission (DVRPC),
Los Angeles, CA
Clean Up Green Up is a city ordinance aimed at
mitigating industrial and traffic-related pollution in
particularly vulnerable neighborhoods in Los Angeles�
The ordinance establishes three pilot “green zones”
subject to stricter development standards including
setbacks and landscaping buffers for new or expand
-ing development, and requires higher-rated air filters for new residential development within 1,000 feet of a freeway (Barboza, 2016).
Regional air pollution mitigation efforts in the Los Angeles area are managed by the South Coast Air
Quality Management District (SCAQMD), which is the air pollution control agency for the region. In 2008,
SCAQMD conducted a pilot study of classroom air
purification systems at three elementary schools located near refineries, other industrial facilities, and freeways in the Carson-Long Beach area (SCAQMD, 2011). The study found that the filters removed up to 90% of ultrafine particles and diesel particulate matter from indoor air (SCAQMD, 2011). Because of the suc
-cess of the pilot study, SCAQMD installed air filtration devices at more than 40 schools in Wilmington, CA to reduce children’s exposure to traffic-related particu
-late matter in the classroom (SCAQMD, 2011).
Oakland, CA
The West Oakland Environmental Indicators Project (WOEIP) is a community-based environmental justice organization with a focus on engaging residents in
air pollution education and mitigation efforts (WOEIP,
2011). Their air quality efforts focus specifically on
the Port of Oakland, freight transportation, and diesel
emissions from truck traffic (WOEIP, 2011). Organiza -tion members identify air pollu-tion problems in their neighborhood, advocate for appropriate mitigation
strategies, and assist researchers with data collection (WOEIP, 2011).
Louisville has since expanded its reach and
participa-tion (AIR Louisville, 2017).
Buffalo, NY
The Clean Air Council of Western New York (CACWNY) is a community organization initially
organized as a response to public concern over air pollution produced by a nearby coke manufacturing
company, whereby residents monitored air quality
and advocated for better federal enforcement of
regulations (CACWNY, 2018). The organization has since been involved with other air quality initiatives around traffic-related air pollution and industrial fires (CACWNY, 2018).
created the Air Quality Partnership, a public/private coalition that provides education and air quality advi-sories to residents throughout the region (Air Quality
Partnership, 2018).
The Clean Air Council is an environmental organi -zation in Philadelphia and throughout the Mid-Atlantic
region with programs focused on clean energy, sus -tainable transportation, climate change, and indoor and outdoor air quality, among others (Clean Air
Coun-cil, 2019a). The Clean Air Council is currently piloting a program in Philadelphia that will provide low-cost,
mobile air quality monitors to residents living near polluting facilities in order to monitor pollution and
ensure compliance with regulations (Clean Air Coun
-cil, 2019b).
Pittsburgh, PA
The Breathe Project is a coalition of citizens,
environmental advocates, public health professionals,
and academics working to provide the city of Pitts
-burgh with information about local air quality and
a set of tools to engage residents (Breathe Project,
2019a). Their initiatives include BreatheMobile, a vehi
-cle-based “traveling laboratory designed to map and
monitor air quality throughout the Pittsburgh region
and to increase public awareness of the harmful impacts of air pollution” (Breathe Project, 2019b).
State regulations
California is one of the few states that have state
-wide regulations as well as regional and local plans in place to mitigate outdoor air pollution. The state of California amended their Education Code in 2003,
stipulating that school districts cannot approve a
pro-posed school site “within 500 feet of the edge of the closest traffic lane of a freeway or other busy traffic corridor” without first determining through air disper
-sion modeling “that the air quality at the proposed site
is such that neither short-term nor long-term
expo-sure poses significant health risks to pupils” (State of California, 2003).
The California Air Resources Board under the state
Environmental Protection Agency developed an Air Quality and Land Use Handbook to provide recom-mendations on the siting of sensitive land uses and offer tools for local agencies to evaluate air quality and integrate community concerns in their planning
efforts (California Air Resources Board, 2005). Rarely
does outdoor air pollution come from a singular
source that can be easily managed. The handbook
offers guidance on the consideration of cumulative air pollution impacts, or the effects from multiple local
sources like highways and industry, when considering a proposed development project. The handbook can be used by local residents, non-profits, or city officials
for education, advocacy, or decision-making�
The state of California also prioritizes funding for
local efforts that address disparities in health
con-ditions associated with air pollutants. One example is the state’s Proposition 84 Urban Greening Grant, which in 2013 was awarded to an Oakland-based non-profit to develop a green infrastructure and climate
change preparedness master plan (adaptOakland,
n.d.). Plans for green urban infill are directly targeting
diesel particulate matter emissions in West Oakland,
where residents face increased risks of cancer and
other chronic health issues due to diesel emissions
from port operations and nearby freeways (adaptOak
-land, n.d.). Although air quality is regulated primarily
at the federal level, localized initiatives are vital to col-lecting and disseminating air pollution data, providing guidance on land use decision-making, and advocat-ing for vulnerable populations�
Conclusion
This project’s intent is to gain a better understand
-ing of the relationship between outdoor air pollution
and health outcomes in Philadelphia in order to make
informed planning and development decisions. This
research is limited by the scale and availability of the data� Moreover, this research does not control for the impact that building height and density has on the dis-persion of outdoor air pollution, or study small-scale emissions data� Future research could develop and examine case studies of particularly vulnerable neigh-borhoods based on the air pollution risk index� With time-activity pattern data, accompanying research could develop a time series of hourly air quality and
investigate how hourly trends relate to commuting
hours for both motorized and non-motorized commut-ing� Lastly, this research can inform future
consider-ations of how the Philadelphia2035 comprehensive
plan aligns with air pollution mitigation strategies in
References
AdaptOakland (n.d.). CA Proposition 84 Urban Greening Planning Grant for Adapt Oakland. Retrieved June 29, 2018 from http://adaptoakland.org/wp-content/uploads/2013/04/2PageLongProjectBrief-ForYouToK
-now.pdf.
AIR Louisville (2017). About. Retrieved February 3, 2019 from https://www.airlouisville.com/about.html.
Air Quality Partnership (2018). About. Air Quality Partnership. Retrieved February 2, 2019 from http://www.
airqualitypartnership�org/About/�
American Lung Association (2018). State of the Air 2018. Retrieved July 6, 2018 from http://www.lung.org/ our-initiatives/healthy-air/sota/city-rankings/states/pennsylvania/#hide-tabs-1.
Barboza, Tony (2016). L.A. City Council adopts rules to ease health hazards in polluted neighborhoods. Los An
-geles Times. Retrieved February 3, 2019 from https://www.latimes.com/local/lanow/la-me-pollution-pro
-tection-20160412-story.html.
Bell, M. L., & Ebisu, K. (2012). Environmental inequality in exposures to airborne particulate matter components in the United States. Environmental Health Perspectives, 120(12), 1699–1704. https://doi.org/10.1289/ ehp.1205201
Bobak, M. (2000). Outdoor Air Pollution, Low Birth Weight, and Prematurity. Environmental Health Pespectives, 108 (10), 173-176.
Bowe, B., Xie, Y., Li, T., Yan, Y., Xian, H., & Al-Aly, Z. (2018). The 2016 global and national burden of diabetes mel
-litus attributable to PM 2.5 air pollution. Lancet Planetary Health, 2, e301-e312.
Breathe Project (2019a). About. Retrieved February 3, 2019 from https://breatheproject.org/about/.
Breathe Project (2019b). Tech Tools. Retrieved February 3, 2019 from
https://breatheproject.org/tech-tools/#tt-smell-pgh�
Buckeridge, D. L., Glazier, R., Harvey, B. J., Escobar, M., Amrhein, C., & Frank, J. (2002). Effect of Motor Vehicle
Emissions on Respiratory Health in an Urban Area� Environmental Health Perspectives • VOLUME (Vol�
110). Retrieved from http://ehpnet1.niehs.nih.gov/docs/2002/110p293-300buckeridge/abstract.html.
Caiazzo, F., Ashok, A., Waitz, I. A., Yim, S. H. L., & Barrett, S. R. H. (2013). Air pollution and early deaths in the United States. Part I: Quantifying the impact of major sectors in 2005. Atmospheric Environment, 79, 198–208. https://doi.org/10.1016/j.atmosenv.2013.05.081.
California Air Resources Board (2005). Air Quality and Land Use Handbook: A Community Health Perspective. California Environmental Protection Agency. Retrieved June 29, 2018 from https://www.arb.ca.gov/ch/
handbook�pdf�
Centers for Disease Control and Prevention (CDC). (2018). Most Recent Asthma Data. Retrieved June 7, 2018 from https://www.cdc.gov/asthma/most_recent_data.htmCity of Philadelphia.
City of Boston (2019). Air Pollution Control Commission. Retrieved February 3, 2019 from https://www.boston.
gov/departments/environment/air-pollution-control-commission�
City of Philadelphia (2015). Air Monitoring Stations. Open Data Philly. Retrieved February 3, 2019 from https:// www.opendataphilly.org/dataset/air-monitoring-stations.
City of Philadelphia (2011). Citywide Vision: Philadelphia 2035. Retrieved June 7, 2018 from http://www.phila. gov/CityPlanning/plans/District%20Plans%20Library/Philadelphia2035Citywid eVision_reduced.pdf.
Clean Air Council (2019a). Clean Air Council Programs. Retrieved February 2, 2019 from https://cleanair.org/
clean-air-council-programs/�
Clean Air Council (2019b). Air Monitors. Retrieved February 2, 2019 from https://cleanair.org/public-health/
air-monitors/�
Clean Air Council of Western New York (CACWNY) (2018). Campaigns. Retrieved February 3, 2019 from https:// www.cacwny.org/campaigns/.
Delaware Valley Regional Planning Commission (DVRPC) (n.d.). Air Quality Conformity. Retrieved June 24, 2018 from https://www.dvrpc.org/AirQuality/Conformity/.
Environmental Systems Research Institute (ESRI). (2016). ArcGIS Release 10.5. Redlands, CA.
Friedman, M. S., Powell, K. E., Hutwagner, L., Graham, L. R. M., & Teague, W. G. (2001). Impact of changes in transportation and commuting behaviors during the 1996 Summer Olympic Games in Atlanta on air qual
-ity and childhood asthma. Journal of the American Medical Association, 285(7), 897–905. https://doi. org/10.1001/jama.285.7.897.
Gan, W. Q., FitzGerald, J. M., Carlsten, C., Sadatsafavi, M., & Brauer, M. (2013). Associations of ambient air pollution with chronic obstructive pulmonary disease hospitalization and mortality. American Journal of Respiratory and Critical Care Medicine, 187(7), 721–727. https://doi.org/10.1164/rccm.201211-2004OC.
Gray, S. C., Edwards, S. E., Schultz, B. D., & Miranda, M. L. (2014). Assessing the impact of race, social factors
and air pollution on birth outcomes: A population-based study� Environmental Health: A Global Access
Science Source. https://doi.org/10.1186/1476-069X-13-4.
Ge, Y., Zhang, H., Dou, W., Chen, W., Liu, N., Wang, Y., Shi, Y., & Rao, W. (2017). Mapping Social Vulnerability to Air Pollution: A Case Study of the Yangtze River Delta Region, China. Sustainability, 9, 109.
Guarnieri, M. & Balmes, J. (2014). Outdoor air pollution and asthma. The Lancet, 383, 1581-92.
Health Effects Institute (HEI) (2010). Traffic-Related Air Pollution: A Critical Review of the Literature on Emis
-sions, Exposure, and Health Effects. Retrieved June 24, 2018 from https://www.healtheffects.org/publica
-tion/traffic-related-air-pollution-critical-review-literature-emissions-exposure-and-health.
Hricko, Andrea (2014). Global Trade, Local Impacts: Lessons from California on Health Impacts and Environ
-mental Justice Concerns for Residents Living near Freight Rail Yards. International Journal of Environ
-mental Research and Public Health. 11, 1914-1941.
pollution: The case of nitrogen dioxide. JRS Technical Reports. Retrieved July 31, 2018 from https://
ec�europa�eu/jrc/en/publication/susceptibility-and-vulnerability-health-effects-air-pollution-case-nitro-gen-dioxide�
Kondo, M., Mizes, C., Lee, J., & Burstyn, I. (2013). Black carbon concentrations in a goods-movement neighbor
-hood of Philadelphia, PA. Environmental Monitoring and Assessment, 186, 4605-4618.
Lelieveld, J., Evans, J. S., Fnais, M., Giannadaki, D., & Pozzer, A. (2015). The contribution of outdoor air pollu
-tion sources to premature mortality on a global scale. Nature, 525, 367–374. https://doi.org/10.1038/ nature15371.
Lee, P., Roberts, J., Catov, J., Talbott, E., & Ritz, B. (2012). First Trimester Exposure to Ambient Air Pollution,
Pregnancy Complications and Adverse Birth Outcomes in Allegheny County, PA� Maternal and Child
Health Journal, 17 (3), 545-555.
Li, Yu (2017). Association of Long-Term Near-Highway Exposure to Ultrafine Particles with Cardiovascular Dis
-eases, Diabetes, and Hypertension. International Journal of Environmental Research and Public Health. 14, 461.
Lim, C. C., Hayes, R. B., Ahn, J., Shao, Y., Silverman, D. T., Jones, R. R., Garcia, C., & Thurston, G. D. (2018). As
-sociation between long-term exposure to ambient air pollution and diabetes mortality in the US. Environ
-mental Research, 165(April), 330–336. https://doi.org/10.1016/j.envres.2018.04.011.
Makri, A., & Stilianakis, N. (2007). Vulnerability to air pollution health effects. Joint Research Centre, European Commission. International Journal of Environmental Research and Public Health, 211 (3-4), 326-36.
Marron Institute of Urban Management (2018). Health of the Air. Retrieved July 6, 2018 from https://www. healthoftheair.org/city/19008.
Marshall, J., Brauer, M., & Frank, L. (2009). Healthy Neighborhoods: Walkability and Air Pollution. Environmental Health Perspectives, 117 (11), 1752-1759.
Mendola, P., Wallace, M., Liu, D., Robledo, C., Mannisto, T., & Grantz, K. L. (2016). Air pollution exposure and preeclampsia among US women with and without asthma. Environmental Research, 148(x), 248–255. https://doi.org/10.1016/j.envres.2016.04.004.
McConnell, R., Islam, T., Shankardass, K., Jerrett, M., Lurmann, F., Gilliland, F., Gauderman, J., Avol, E., Kunzli, N., Yao, L., Peters, J., & Berhane, K. (2010). Childhood incident asthma and traffic-related air pollution at home and school. Environmental Health Perspectives, 118(7), 1021–1026. https://doi.org/10.1289/ ehp.0901232.
Munir, S., Chen, H., & Ropkins, K. (2012). Modelling the impact of road traffic on ground level ozone concentra
-tion using a quantile regression approach. Atmospheric Environment, 60, 283-291.
National Institute of Environmental Health Sciences (2018). THE (Trade, Health, Environment) Impact Study. Retrieved February 3, 2019 from https://www.niehs.nih.gov/research/supported/translational/communi -ty/the-impact/index�cfm�
Pennsylvania Department of Health (2016). Students with Medical Diagnosis of Asthma, School Year 2015-2016. Retrieved June 27, 2018 from http://www.health.pa.gov/My%20Health/School%20Health/Docu
- ments/Chronic%20Disease/Asthma/Data%20Report%20Chronic%20Condition%20Asthma%20(2015-2016)%20by%20County.pdf.
Pratt, G. C., Vadali, M. L., Kvale, D. L., & Ellickson, K. M. (2015). Traffic, air pollution, minority and socio-econom
-ic status: Addressing inequities in exposure and risk. International Journal of Environmental Research and Public Health, 12(5), 5355–5372. https://doi.org/10.3390/ijerph120505355.
R Core Team (2013). R: A language and environment for statistical computing. R Foundation for Statistical Computing, Vienna, Austria. http://www.R-project.org/.
Schweitzer, L. & Zhou, J. (2010). Neighborhood Air Quality, Respiratory Health, and Vulnerable Populations in Compact and Sprawled Regions, Journal of the American Planning Association, 76:3, 363-371, DOI: 10.1080/01944363.2010.486623.
Social Explorer (2017). Social Explorer Tables: ACS 2017 (5-Year Estimates)(SE), ACS 2017 (5-Year Estimates), Social Explorer; U.S. Census Bureau.
Son, J. Y., Kim, H., & Bell, M. L. (2015). Does urban land-use increase risk of asthma symptoms? Environmental Research, 142, 309–318. https://doi.org/10.1016/j.envres.2015.06.042.
South Coast Air Quality Management District (SCAQMD) (2011). Air Filtration Devices to be Installed at Wilmington Schools. SCAQMD Advisor. Retrieved June 29, 2018 from http://www.aqmd.gov/docs/de
-fault-source/publications/aqmd-advisor/march-2011-advisor.pdf.
State of California (2003). Senate Bill No. 352. An act to amend Section 17213 of the Education Code, and to amend Section 21151.8 of the Public Resources Code, relating to public schools. Retrieved June 29, 2018 from https://leginfo.legislature.ca.gov/faces/billNavClient.xhtml?bill_id=200320040SB352.
Szyszkowicz, M., & Tremblay, N. (2011). Case-Crossover Design: Air Pollution and Health Outcomes. Interna
-tional Journal of Occupa-tional Medicine and Environmental Health, 24, 249.
Trinacria, Joe (2018). Nicetown Neighbors Continue Fight Against SEPTA Power Plant. Philadelphia Magazine. Retrieved February 7, 2019 from https://www.phillymag.com/news/2018/06/12/septa-power-plant-nice
-town/.
Tufts University (2011). Community Assessment of Freeway Exposure and Health Study. Retrieved February 3, 2019 from https://sites.tufts.edu/cafeh/.
U.S. Department of Housing and Urban Development (HUD) (n.d.). Legislative History of Lead-Based Paint. Re
-trieved February 3, 2019 from https://www.hud.gov/sites/documents/20258_LEGISLATIVEHISTORY.PDF.
U.S. Environmental Protection Agency (EPA) (2011). The Benefits and Costs of the Clean Air Act: 1990 to 2020 Summary Report. U.S. Environmental Protection Agency Office of Air and Radiation. Retrieved February 2, 2019 from https://www.epa.gov/sites/production/files/2015-07/documents/summaryreport.pdf.
U.S. EPA (2018b). Criteria Air Pollutants. Retrieved June 29, 2018 from https://www.epa.gov/criteria-air-pollut -ants#self�
U.S. EPA (2018c). Ground-level ozone pollution. Retrieved March 30, 2019 from https://www.epa.gov/
ground-level-ozone-pollution/ground-level-ozone-basics#formation�