E-LEARNING FOR RADIOGRAPHIC INTERPRETATION: DEVELOPMENT OF A TESTING MODULE
Angela Maria Broome
“A thesis submitted to the faculty of the University of North Carolina at Chapel Hill “School of Dentistry” in partial fulfillment of the requirements for the degree of Master of Science in the Department of Diagnostic Sciences and General Dentistry, Oral and Maxillofacial Radiology”
Chapel Hill 2011
Approved by:
ABSTRACT
ANGELA MARIA BROOME: e-Learning for Radiographic Interpretation: Development of a Testing Module
(Under the direction of Dr. André Mol)
The purpose of this study was to develop a web-based method for testing dental students on the radiographic interpretation of approximal tooth surfaces. Part I involved the development and validation of an image editing method for
transplanting approximal surfaces from one radiograph to another. Using this technique, histologically verified surfaces were transplanted into existing clinical radiographs and images were altered to change caries risk perception. In part II, the prototype of the testing module was administered to 80 third year dental students for competency assessment.
ACKNOWLEDGEMENTS
“Do not wait; the time will never be ‘just right.’ Start where you stand, and work with whatever tools you may have at your command, and better tools will be found as you
go along.” Napoleon Hill
TABLE OF CONTENTS
LIST OF TABLES ... VI
LIST OF FIGURES ... VII
LIST OF ABBREVIATIONS ... VIII
CHAPTER
I. OVERALL INTRODUCTION ... 1
BACKGROUND AND SIGNIFICANCE ... 1
PROBLEM DEFINITION ... 4
REVIEW OF E-LEARNING METHODS ... 6
THE VISION ... 7
II. IMAGE EDITING OF RADIOGRAPHIC APPROXIMAL TOOTH SURFACES .. 9
INTRODUCTION ... 10
Clinical Image Selection ... 12
Ground Truth Surfaces ... 13
Image Editing ... 13
Sample ... 14
Image Assessment ... 15
Data Analysis ... 16
DISCUSSION ... 16
III. E-LEARNING FOR RADIOGRAPHIC CARIES INTERPRETATION: THDEVELOPMENT OF A TESTING MODULE ... 24
MATERIALS AND METHODS ... 27
Sample... 27
Faculty Standard ... 28
Perceived Risk ... 29
Testing Module ... 29
Data Analysis ... 30
RESULTS ... 32
DISCUSSION ... 33
IV. SUMMARY ... 58
APPENDIX I ... 69
APPENDIX II ... 71
APPENDIX III... 72
APPENDIX IV ... 73
APPENDIX V ... 74
APPENDIX VI ... 75
APPENDIX VII ... 77
APPENDIX VIII ... 80
LIST OF TABLES
Table
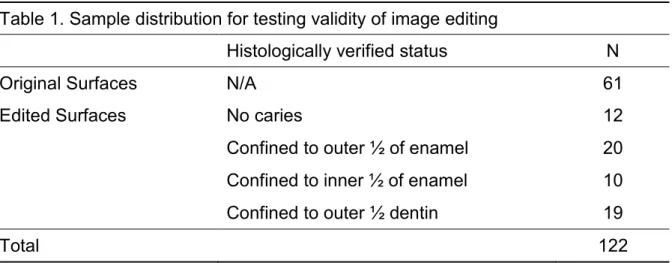
1. Sample distribution for testing validity of image editing ... 21
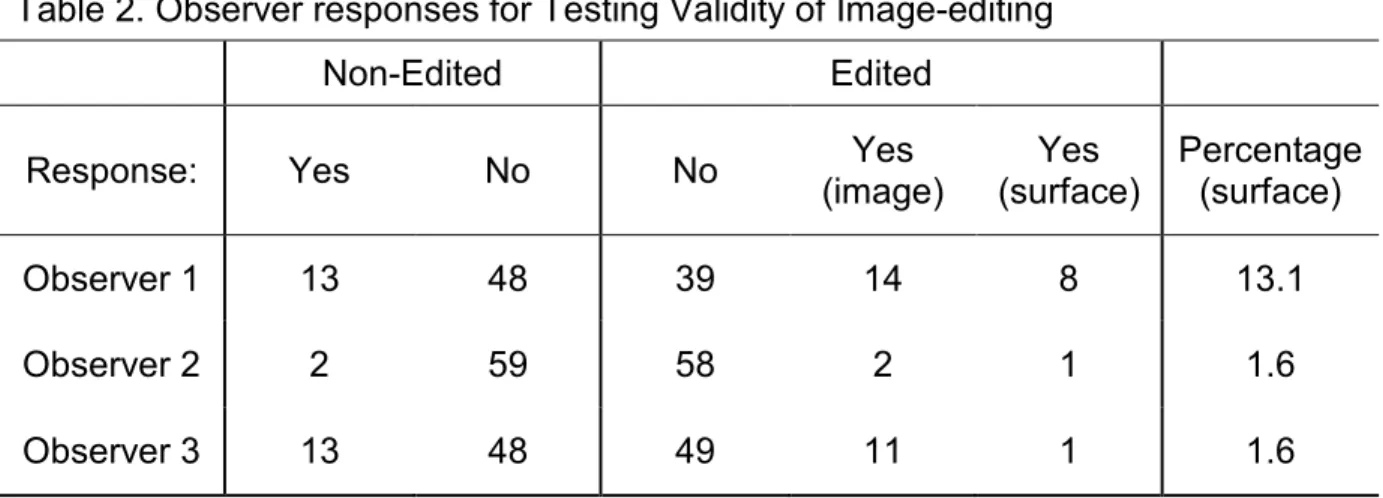
2. Observer responses for testing validity of image editing ... 22
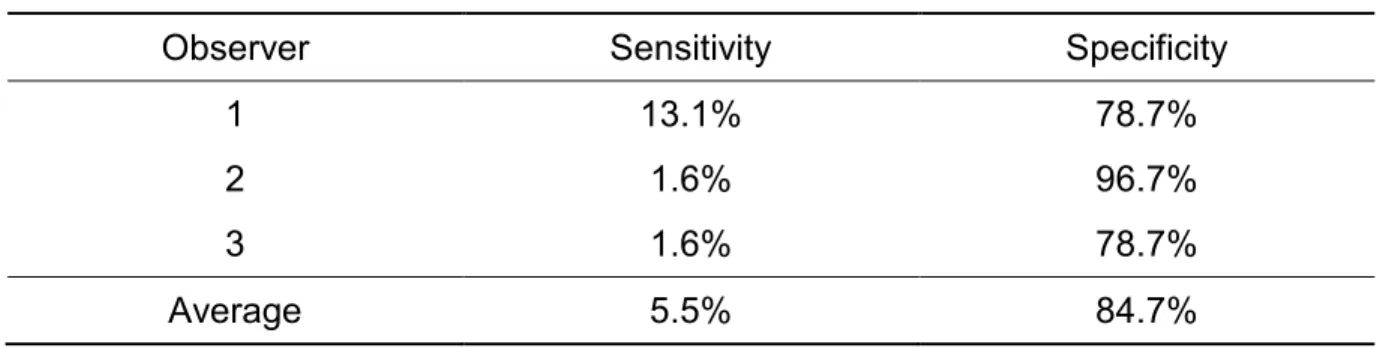
3. Observer Sensitivity and Specificity ... 23
4. Five-Point Likert Scale ... 50
5. Response Categories for Lesion Depth ... 51
6. Distribution of Disease Status of Approximal Surfaces ... 52
7. Distribution of Lesion Depth ... 53
8. Scenarios for Testing Effect of Perceived Risk ... 54
9. Distribution of Surfaces for Testing Effect of Perceived Risk ... 55
10. Descriptive Statistics for Student Diagnostic Accuracy ... 56
11. Descriptive Statistics for Changes in Student Diagnostic Accuracy ... 57
12. Description of Photo-edited Surfaces ... 71
13. Description of Depth of Photo-Edited Surfaces ... 72
LIST OF FIGURES
Figure
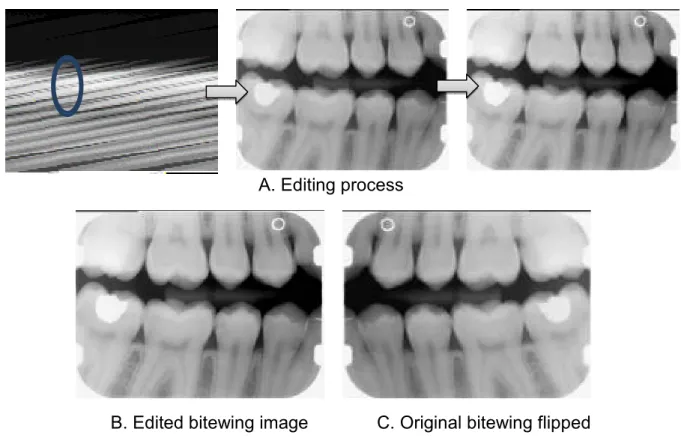
1. Image-editing Process ... 20
2. Sample Question of Testing Module ... 39
3. Sample Follow-up Depth Response ... 40
4. Image Editing to Increase Caries Risk ... 41
5. Categorical Assessment of Student Az Scores ... 42
6. Summary of Student’s Sensitivity and Specificity ... 43
7. Categorical Assessment of Individual Student’s Sensitivity Scores ... 44
8. Categorical Assessment of Individual Student Specificity Scores ... 45
9. Comparison of Faculty to Student Depth Assessment ... 46
10. Comparison of Faculty to Student Depth Assessment ... 47
11, Comparison of Faculty to Student Depth Assessment. ... 48
12. Relationship between Change in Sensitivity and Change in Specificity ... 49
13. Sample of Qualtrics Features ... 77
14. Sample of Qualtircs Skip Logic Function ... 78
LIST OF ABBREVIATIONS
AB Angela Broome AM Andre Mol
Az Area under the ROC Curve
CODA Commission on Dental Accreditation DEJ Dento-enamel Junction
F Faculty
I-D Incipient Surface adjacent to Diseased Surface I-H Incipient Surface adjacent to Healthy Surface IQR Inter-Quartile Range
JPEG Joint Photographic Experts Group
OSCE Objective Structured Clinical Examination
N Number
ROC Receiver Operating Characteristic Curve
CHAPTER 1
OVERALL INTRODUCTION
Background and Significance
The Commission on Dental Accreditation (CODA) serves to maintain
standards that promote quality and continuous improvement of dental education in order to ensure graduation of a competent dentist. This group defines “competent” as “the level of knowledge, skills and values required by the new graduates to begin independent, unsupervised dental practice.”1 Dental schools around the country have implemented clearly defined methods such as the Objective Structured Clinical Examination (OSCE) to evaluate a student’s competence in skill-based areas. The goal of these examinations is to identify those students who do not meet these defined competencies. However, the area of radiographic interpretation is still lacking a consistent, objective, clearly defined method to evaluate a student’s
generally supervised by a radiology faculty member and a radiology graduate student, which results in approximately a 1:3 teacher-student ratio. In addition to lectures and seminars conducted by the radiology division, students also strengthen their radiographic interpretation skills through feedback from non-radiology faculty members during the course of their clinical rotations.
Radiographic interpretation competency is assessed through a number of different tests. Formal courses in the first and third year are concluded with written examinations, which include interpretation of a series of radiographic images in a presentation format. Small group seminars do not include a formal competency assessment mechanism to measure whether the student has acquired the
necessary interpretation skills. Instead, these seminars rely upon the strength of the small student-to-teacher ratio to provide instant assessment of and feedback to the students. In the final year, students are required to take a comprehensive OSCE, which includes a limited number of topics on radiographic interpretation. A separate radiographic interpretation examination is also administered to the final year
students, covering a wide range of topics, from caries interpretation to lesions of the head and neck.
While the existing teaching and testing methods meet accreditation
easily be missed. Small group seminars are much more effective in assessing individual strengths and weaknesses of students, however, these seminars put a high demand on the teaching staff. As a result, the number of rotations for each student is limited and assessment of continuity in the learning process is difficult to accomplish. In addition, there is no formal mechanism to test students on the interpretation skills they have acquired during these seminars. If individual weaknesses are identified, opportunities to remediate these students using appropriate teaching cases are very limited.
Dental students are instructed in all aspects of radiographic interpretation. This includes the study of radiographic signs of dentoalveolar diseases as well as recognition of diseases of the head and neck. While the student is required to be competent in recognizing radiographic signs that are associated with abnormalities of the head and neck region and needs to be able to categorize the underlying disease processes, the emphasis of radiographic instruction is on the detection and classification of dentoalveolar diseases: caries, periodontal disease, periapical disease. It is assumed that all students attain the necessary skills through the
overall purpose of this study is to develop e-learning tools that will support current teaching and testing of radiographic interpretation skills. For the development of the concept, a single, well-defined and clinically important diagnostic task was selected: radiographic assessment of approximal tooth surfaces for the presence or absence of dental caries.
Problem definition
Detecting radiographic signs of carious lesions is a crucial component of accurate diagnosis and appropriate patient treatment. Although there has been a decline in caries incidence over recent years, it is imperative for dentists to detect early carious lesions. The focus has shifted from early detection to remove
progressive dental disease and save teeth to a more preventive, non-restorative approach to arrest and reverse dental caries. The clinician’s ability to correctly assess the depth and activity of a lesion based on clinical and radiographic findings is the basis of risk assessment, which will ultimately determine the appropriate course of treatment, including preventive therapy.2
87%.5 In other words, half the lesions that are actually present will be missed by the clinician and a good number of healthy surfaces will be falsely labeled as carious.6
Clinically, the detection of an approximal caries lesion is often difficult
because of a lack of direct access for visual and tactile exploration. Pitts reported
that the clinical exam at best detects 50% of the total approximal lesions.7
Diagnostic tools are therefore needed to aid the dentist in finding caries lesions. For
approximal lesions, the bitewing radiograph is the most useful and easily obtainable
diagnostic tool.8 However, it is by no means a perfect tool.
The bitewing radiograph faces many deleterious factors that limit its ability to
be a precise instrument in caries detection. First, approximately 30-40% enamel
de-mineralization is required before a lesion can be detected radiographically.9, 10 Thus, below this level of demineralization, radiographs simply do not record the presence
of a lesion. In addition, once a lesion is recorded and detected, the lesion is larger
than its depicted size in the radiographic image. Second, due to the location of the
lesion at the approximal contact point where the tooth surface is broad, the mineral
loss at the advancing front of active incipient lesions is often difficult to detect on the
radiograph. Third, changes in the orientation of the central ray with respect to the
tooth and the lesion can alter the appearance of a lesion on the radiograph. It may
obscure a lesion, or change its, location, size or depth. Fourth, various imitators and
distractors can confuse the clinician in determining the true status of the tooth,
resulting in either false positive or false negative outcomes.11 Finally, one bitewing radiograph cannot differentiate between an active and an inactive lesion.8
been accomplished through various instructional methods and clinical sessions.
These teaching methods work well to produce most learning outcomes.12 Generally speaking, when looking at a class as a whole, any type of teaching will improve
knowledge. However, with the constraints of large class sizes and more demands on
faculty, less individual instruction time is available. When the focus shifts away from
the class and to the individual student, the individual student learns and
comprehends at a different pace and has different limitations and weaknesses. So
the question becomes “how” can the traditional method of teaching the individual
student be improved in today’s professional school? A viable aid to the traditional
lecture format is an interactive teaching module. According to Mileman, the
conventional lecture approach fails to incorporate consistent instruction based upon evidence.2 The creation of interactive teaching modules will help the student to develop the needed skills to operate independently in the detection of caries. Furthermore, the hope is to be able to expand this module to other diagnostic and decision making skills.
Review of e-Learning methods
E-Learning allows access to learning anywhere at any time. It extends classroom learning to smart phones, personal computers, and tablets. It
derived from standard teaching methods. These interactive, audio and video
systems have the potential to develop and improve the individual student’s skills and knowledge and do so in a motivating and stimulating way.14 Two interesting
advantages are the flexibility of usage and individualized instruction.15 Cook and coworkers completed a meta-analysis of web-based learning in the medical profession and found that these programs had a consistently positive effect on student learning. Cook surmises that the question should not be “if” we use these
tools but “how” to implement them for their best effectiveness and for specific
learning outcomes. He summarized that the reviewed studies showed that the
learning outcomes from these programs were favorable for a variety of learners and
in a variety of contexts and that the learning outcomes appear to be as effective as
traditional methods.16
Hillenburg and coworkers surveyed a group of dental school administrators
and information technology specialists on the implementation of e-learning into the
dental school curriculum.17 Their findings stress the role of digital technology in
dental education. The survey results indicated that educators will need to become
more involved in providing information for e-learning tools as well as the structural
development and design of web-based learning. Many of those surveyed believed
that the implementation of e-learning will promote collaboration among schools, lead
to improved calibration and has the potential to further standardize the curriculum.
The Vision
detection of early carious lesions. This diagnostic modality is well established and students should be competent in its use while practicing dentistry independently. The purpose of the current study was twofold: first, to develop a web-based tool for testing dental students on radiographic interpretation of approximal tooth surfaces; second, to test whether the diagnostic accuracy of students is influenced by
perceived changes in caries risk.
CHAPTER 2
INTRODUCTION
Standardized assessment of student competency for approximal caries detection is challenging. Using histologically verified tooth surfaces requires artificial arrangements of teeth, while the use of clinical radiographs limits radiologic
educators in controlling the prevalence and depth of caries lesions and in varying other radiographic signs associated with caries risk. Much of the radiologic research is designed to evaluate the diagnostic accuracy of imaging modalities for detecting and tracking disease. The imaging modalities must be validated against a gold standard, a test that provides the true disease state.18 The gold standard for caries diagnosis has historically been microscopic examination following extraction and sectioning of the tooth. The imaged tooth that displays a “carious” or “non-carious” surface of interest must be pre-planned for extraction. This is difficult when studying small lesions that would not warrant tooth extraction but require extraction for other reasons. Alternatively, teeth can be collected that already have been extracted. Following a visual inspection of the approximal surfaces, the teeth are mounted in a partial arch arrangement and imaged. This is a painstaking and time consuming task which results in not so perfect clinically-simulated radiographic images for review. Various ways to avoid this belaboring task have been described in the literature. Okano and coworkers created artificial approximal caries by drilling holes in the surfaces and placing a tissue simulation material into the cavitated site in order to study the diagnostic accuracy of non-screen films.19 Arnold and coworkers
coworkers used gels to create artificial lesions in enamel surfaces.21 Whereas the use of artificial caries lesions provides an easily controllable gold standard, the lesions generally look artificial, making the generalizability of studies based on such models questionable at best.18
In a teaching environment, the gold standard is not necessarily the true state of the disease process. Within the confines of the limitations of the diagnostic test, it is the expert use of the information provided by the test that the teacher tries to convey to the student. Thus, the gold standard for teaching purposes can be, and usually is expert opinion. Generally, the teacher discusses a number of standard cases or any number of clinical cases that present themselves during the course of the learning period. For radiographic interpretation, this limits the teacher in
controlling variables that can influence the student’s diagnostic performance.
radiographic image content could be modified to change perceived caries risk, an important variable in diagnostic and treatment decision making.24-26 Thus,
radiographic image editing may represent a novel and potentially useful teaching tool.
A key element of successful image editing is that the observer is not aware of the editing process. In other words, the observer must not be able to identify the edited image and perceive the image as any other non-edited image. This is not a trivial task, as the image characteristics of the recipient tooth need to match the characteristics of the donor tooth in terms of size, morphology, brightness, contrast and noise. Ideally, pairs of images are selected based on a best match, however, image characteristics can be modified using image processing tools to blend the donor site seamlessly into the host image. The purpose of this study was to develop and validate the use of radiographic image editing for transplanting radiographic images of histologically verified carious and non-carious tooth surfaces into existing clinical radiograph.
MATERIALS AND METHODS
Clinical Image Selection
image quality and the proper visualization of approximal tooth surfaces. Elements of image quality that were considered in image selection included clinically adequate brightness, contrast, resolution, beam alignment, collimator alignment and packet placement. The final selection of bitewing radiographs to be used as “host” images also took in consideration specific tooth surface size and morphology to match the set of histologically verified tooth surfaces. The images were evaluated and selected by one investigator (AB).
Ground Truth Surfaces
Histologically verified approximal surfaces from a database of twenty-four extracted molar and premolar teeth were used as donor sites and represented ground truth in terms of caries status. The ground truth was established as part of a series of previous studies.27 28 The teeth used to establish ground truth were
extracted teeth that were placed in plaster stone in a partial arch arrangement and were surrounded by two 1.0 cm thick wax slabs for soft tissue simulation.
Radiographic images were acquired with a Sirona Sidexis sensor and a Sirona Heliodent MD tube head (Sirona Dental Systems GmbH, Bensheim, Germany). Following image acquisition, the teeth were sectioned and evaluated under a
dissecting microscope. The presence and depth of the lesions was determined by a consensus of two observers on a four point scale.27
Image Editing
(version 7.0, Adobe Systems Incorporated, San Jose, CA). The surface of interest of the histologically verified tooth was selected using the lasso tool and then copied. The surface was then pasted into the clinical recipient image as a new image layer; the layer was mirrored if necessary. Following precise positioning of the transplanted layer, brightness, contrast, noise and size were adjusted to match the characteristics of the recipient tooth surface. Finally, the lasso tool with increased feathering was used to blend the donor surface with the recipient surface. The adjustment of the donor surface was performed with the emphasis on maintaining the specific
radiographic characteristics of the surface and the lesion, if present. Alteration of the donor surface was kept to a minimum by careful selection of the donor and recipient image pair. Following the surface transplantation and blending process, the modified clinical image was flattened, resized and saved as a lossless JPEG file.
Sample
transplanted surfaces were healthy, twenty had caries lesions confined to the outer half of the enamel, ten had caries lesions confined to the inner half of the enamel and nineteen had caries lesions just past the dentino-enamel junction (Table 1). The 122 images were randomized and imported into Microsoft PowerPoint (version 2007, Microsoft Corporation, Redmond, WA). The non-edited images were horizontally mirrored to reduce a potential recognition bias (Figure 1).
Image Assessment
Three experienced observers independently viewed the 61 edited and 61 non-edited images. Two were board-certified oral and maxillofacial radiologists and one was a faculty member of the operative dentistry department. Images were
Data Analysis
A “no” response for a non-edited image was counted as a correct response. A “no” response for an edited image was counted as an incorrect response. If the observer responded with “yes” to an edited image but failed to identify the edited surface, the response was counted as incorrect. The mean scores were recorded and the sensitivity and specificity were calculated for each observer
RESULTS
Table 2 shows a summary of the responses of the observers. One observer correctly identified eight of the sixty-one edited surfaces, while the other two
observers each correctly identified one. Two observers incorrectly identified thirteen non-edited images as edited and one observer incorrectly identified two non-edited images as edited. One observer who correctly identified one of the edited surfaces correctly identified eleven of the edited images. However, in ten of these images he wrongly identified the surface, indicating that he did not recognize the actual
alteration. Table 3 lists the calculated values for the sensitivity and specificity of each observer. The average sensitivity for the three observers was 5.5% and the average specificity was 84.7%
DISCUSSION
potential use of this technology for teaching purposes. The ability to use
histologically verified tooth surfaces in standard clinical radiographs provides a means to teach students aspects of radiographic caries interpretation not previously available. In addition, this technology could be used to alter other aspects of the clinical radiograph that may influence the student’s perception of caries risk. In this study, a method was developed to blend a surface from one tooth into the surface of another tooth with the intention to make the altered surface indistinguishable from other surfaces in the radiograph. The selection of both clinical and experimental radiographs as well as the image editing was performed by one investigator (AB). Two investigators (AB and AM) verified the quality of the image editing procedures and modifications were made when necessary. Following approval of all alterations, both edited and non-edited images were presented to three expert observers.
Whereas two observers were able to correctly identify only one of the sixty-one edited surfaces, sixty-one observer was able to identify 8. Nsixty-one of the three
observers correctly identified the same images or surfaces. As expected, observers reported that their perception of altered surfaces was largely based on unusual variations of contrast and brightness within the image. Interestingly, the observer with the highest sensitivity also considered overall risk within the image for the basis of perception of altered surfaces. In other words, even if a surface with a lesion appeared to blend in well with the rest of the tooth, the observer considered whether the presence of the lesion in the overall context of the image was logical. This
Gunderman summarized how the principles of the Gestalt theory can be applied to radiology.29 The fact that one observer used this approach to identify altered
surfaces implies that this concept needs to be considered in selecting potential image pairs prior to image editing. Although this was not done in this study, this observer was still not able to identify fifty-three of the altered surfaces.
Selection of image pairs was largely based on the image characteristics of the donor tooth and the recipient tooth. Although a set number of tools were used to complete the image editing process, the technique was by no means standardized and did require some artistic skill. Care was taken not to alter the image
characteristics of the donor surface such that it might influence diagnostic decision making by the observer. However, the impact of specific image characteristics on lesion detection and diagnostic decision making is not always clear. For example, the noise characteristics of the transplanted surface had to be adapted to match the noise characteristics of the clinical image. Even though the adjustments were
relatively minor, they did affect the appearance of the lesion. The fact that different detectors were used for the two sets of images may have contributed to some of the differences in image characteristics. Another difference between the laboratory image set and the clinical image set was the effect of soft tissue attenuation. Although the laboratory images were created in the presence of soft tissue equivalent material, the clinical images frequently showed variations in image intensity as a result of variability in the overlying soft tissue thickness. These
their characteristics would be to evaluate the surfaces both before and after transplantation. Although minor differences would likely be obscured by observer variability, the hypothesis that the transplantation method does not introduce differences over and above this variability will be tested in future studies.
Finally, some may argue that manipulation of digital images can be used maliciously. As with many tools, it is the user who determines whether the
application is used for its intended purpose. While current software applications have safeguards in place to either prevent or identify modifications of the original image, the time and effort associated with the image editing process in this study would render this technique ineffective for fraudulent purpose.
Conclusions
Figure 1. Image-editing Process
A histologically verified enamel caries surface is implanted into an original bitewing image, specifically the distal approximal tooth surface of tooth #5 (A); the edited bitewing (B); the original bitewing radiograph mirrored (C).
C. Original bitewing flipped B. Edited bitewing image
Table 1. Sample distribution for testing validity of image editing
Histologically verified status N
Original Surfaces N/A 61
Edited Surfaces No caries 12
Confined to outer ½ of enamel 20 Confined to inner ½ of enamel 10
Confined to outer ½ dentin 19
Table 2. Observer responses for Testing Validity of Image-editing
Non-Edited Edited
Response: Yes No No Yes
(image)
Yes (surface)
Percentage (surface)
Observer 1 13 48 39 14 8 13.1
Observer 2 2 59 58 2 1 1.6
Table 3. Observer Sensitivity and Specificity
Observer Sensitivity Specificity
1 13.1% 78.7%
2 1.6% 96.7%
3 1.6% 78.7%
CHAPTER 3
INTRODUCTION
The Commission on Dental Accreditation (CODA) serves to maintain
standards that promote quality and continuous improvement of dental education in order to ensure graduation of a competent dentist. Competency is defined as the level of knowledge, skills and values required by the new graduates to begin
independent, unsupervised dental practice.1 Dental schools around the country have implemented clearly defined methods such as the Objective Structured Clinical Examination (OSCE) to evaluate a student’s competence in skill-based areas. The goal of these examinations is to identify those students who do not meet these defined competencies. However, the area of radiographic interpretation is still lacking a consistent, objective, clearly defined method to evaluate a student’s
competence in detecting and interpreting radiographic signs of disease. The current radiology curriculum at the UNC School of Dentistry focuses on both fundamental and practical aspects of radiographic procedures and interpretation as it pertains to general dentistry. Radiologic interpretation is taught in lecture format, complimented by small group seminars. The seminars are supervised by a radiology faculty
acquired the necessary interpretation skills. Instead, these seminars rely upon the strength of the small student-to-teacher ratio to provide instant assessment of and feedback to the students.
While the existing teaching and testing methods meet accreditation
standards, none of these methods take advantage of the opportunities and flexibility that web-based e-learning technologies offer. Traditional lecture-style teaching is rigid and virtually precludes the application of individualized strategies to address student-specific needs. Although the examinations are standardized, the depth of such testing methods is limited and individual student learning deficiencies can easily be missed. Small group seminars are much more effective in assessing individual strengths and weaknesses of students, however, these seminars put a high demand on the teaching staff. As a result, the number of rotations for each student is limited and assessment of continuity in the learning process is difficult to accomplish. In addition, there is no formal mechanism to test students on the interpretation skills they have acquired during these seminars. If individual weaknesses are identified, opportunities to remediate these students using
appropriate teaching cases are very limited. Existing teaching and testing methods also lack the ability to control variables that can influence the student’s diagnostic performance, such as the perception risk.
The development and implementation of e-learning tools has the potential to address some of these limitations and could support teaching and testing of
specific testing results, the types of cases can be adapted to the learning progress and to individual needs of the student. The starting point for the development of such a tool is an assessment of student performance based on current teaching methods. Thus, this study focused on the development of a web-based e-testing tool for radiographic interpretation assessment. For the development of the concept, a single, well-defined and clinically important diagnostic task was selected:
radiographic assessment of approximal tooth surfaces for the presence or absence of dental caries. The application of image editing tools, described previously,30 allowed evaluation of student performance under different conditions of caries risk. Caries risk perception is known to influence decisions about treatment,24 however, little is known about the potential effect of perceived caries risk on diagnostic decision making in a learning environment. Radiographs offer important clues on caries risk, including the quantity and quality of existing restorations and the presence of other caries lesions. The assessment of an approximal tooth surface may particularly be affected by the condition of the adjacent tooth surface.
Thus, the purpose of this study was twofold: first, to develop a web-based testing module to assess the performance level of dental students on radiographic interpretation of approximal tooth surfaces; second, to test if students change their diagnostic assessment when caries risk is changed.
MATERIALS AND METHODS
Sample
didactic courses in radiology, a clinical radiology rotation and at least one three-hour radiographic interpretation session. The students also had completed a diagnosis and treatment planning course and were active in the diagnosis and treatment planning clinic as well as in the operative clinic.
Faculty Standard
A series of digital radiographic bitewing radiographs was exported from the image database of the school’s electronic patient record. The images were selected based on their diagnostic quality and on the presence of radiographic signs of
approximal caries. These images represented normal clinical radiographs; no patient information was linked to the selected clinical bitewing images. Three board-certified oral and maxillofacial radiologists individually reviewed a series of eighty selected images for the presence of caries. They were asked to respond on a five-point Likert scale (Table 4). If they thought that caries was probably or definitely present
(response 4 or 5), they were then prompted to assess the depth of the lesion (Table 5). Each observer viewed 196 approximal surfaces. The three observers were in agreement on 36 surfaces. Agreement was considered present when all three observers indicated 1or 2 for caries absent and 4 or 5 for caries present. Using the
Perceived Risk
For assessing the effect of perceived caries risk on diagnostic efficacy, the faculty panel reviewed fifty-eight edited surfaces and agreed upon fifty-four surfaces. Twenty-eight of those surfaces were healthy, four had caries in the outer enamel, four had caries in the inner enamel, and eighteen had caries past the
dentino-enamel junction (DEJ). Ten bitewing radiographs were selected with approximal test surfaces that were healthy. In each of these radiographs, the test surface was
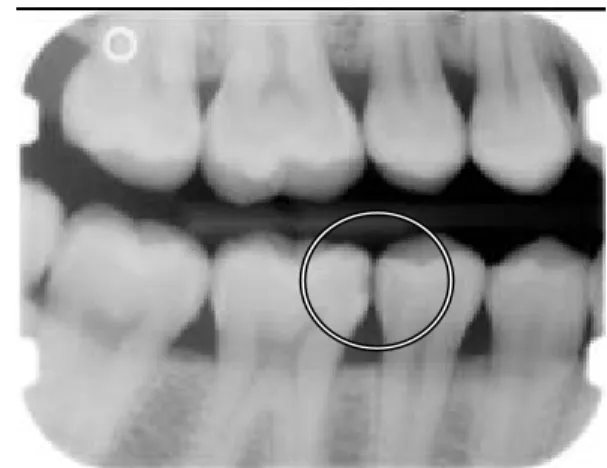
adjacent to a healthy approximal surface (Table 8). Next, surfaces with dentin caries were transplanted from other radiographs and placed adjacent to the test surface, thus increasing caries risk for the test surface (Figure 4). Eight different bitewing radiographs were selected showing approximal test surfaces with a caries lesion in the enamel. In each of these radiographs, the test surface was initially adjacent to a healthy approximal surface. Next, surfaces with dentin caries were transplanted from other radiographs and placed adjacent to the test surface, again increasing caries risk for the test surface. In order to verify whether students actually perceived the lesion in the adjacent surface, the adjacent surface was included in the diagnostic test. Thus, each student assessed a total number of 72 surfaces for this module (Table 9).
Testing Module
applications that require feedback from the operator. All radiographic test images were saved in JPEG (100) format and imported into Qualtrics. A black display background was chosen to reduce unwanted monitor glare. Below each image, a question regarding the presence or absence of caries for a specific surface was posted. The student would simply click one of the five Likert scale options that best described his or her impression: (1) caries definitely not present, (2) caries probably not present, (3) not sure whether caries present or not, (4) caries probably present, or (5) caries definitely present (Figure 2). If the student’s response was a 4 or a 5, the test module prompted a follow-up question about the perceived depth of the lesion, with the following possible responses: (A) confined to the outer enamel, (B) confined to the inner enamel, or (C) confined to outer dentin (Figure 3). Once a response was selected, there was no option to return to a previous question. Students viewed the images on their laptop monitors in subdued light and were not given the option to adjust the size, brightness or contrast of the images. The
Qualtrics application recorded all student responses, which were then exported for analysis.
Data Analysis
Using the consensus opinion of the faculty as the gold standard, the area under the Receiver Operating Characteristic Curve (ROC Az) was calculated for
a negative response and scores 4 and 5 representing a positive response. The results for Az, sensitivity and specificity were summarized using non-parametric
descriptive statistics.
The ground truth for depth assessment analysis was also based on the
faculty consensus opinion. Caries lesions were included for depth analysis if all three faculty members agreed on their depth, or if two of the three faculty members
agreed on their depth and the third faculty member did not deviate by more than one level. This resulted in a sample of 45 caries lesions. Students’ scores were
subtracted from the concurring score from either the two or three faculty members. Thus, a positive result indicated overestimation of lesion depth, a negative number indicated underestimation of lesion depth and zero indicated agreement. Because students varied in their assessment of the presence of a lesion, the sample size for each student regarding depth analysis varied as well. Therefore, descriptive
summary statistics were calculated on relative frequencies by dividing each statistic by the number of actual cases for each student.
Changes in the sensitivity and specificity as a result of increased perceived risk were assessed using the Wilcoxon matched pairs signed rank test. Only those cases in which the student correctly perceived the change in the adjacent surface were included for analysis. The null-hypotheses that a student’s sensitivity and specificity would not change when the test surface was placed adjacent to a carious surface were tested. The Spearman correlation was used to evaluate the
raw ROC scores, the raw scores were also analyzed for potential changes. Three-by-three contingency tables were created for each student to assess whether raw scores moved up, down, or stayed the same when perceived caries risk was increased.
RESULTS
For overall test assessment, Figure 5 shows the results for the ROC Az
scores. On average, there was a satisfactory class performance, with 52 of the 80 students having an Az score of at least 0.9. (Error! Reference source not found.) The
edian Az score was 0.93 (IQR=0.1) (Table 10). The overall sensitivity and specificity
data showed a rather wide range, with a median sensitivity of 85.1 (IQR=19.2) and a median specificity of 89.4 (IQR=15.4) (Figure 6 and Table 10).
A subset of the test was used to evaluate the change in student responses when the perceived risk was changed. Increased perceived caries risk resulted in an increase in the median sensitivity from 71.4 to 85.7 (IQR difference=14.3) and a decrease in the median specificity from 100 to 88.9 (IQR difference=-10.0) (Table 11). Both of these differences were statistically significant (Wilcoxon p<0.001). However, there was no relationship found between the change in sensitivity and the change is specificity (Spearman correlation p=0.23). Sixty-six percent of the
DISCUSSION
Dental schools around the country have implemented clearly defined methods to evaluate a student’s competence in skill-based areas, such as the Objective Structured Clinical Examination (OSCE). Examinations like the OSCE are defined as summative assessments, which identify students who do not meet a defined level of competence. However, summative assessments are not designed to provide
information for improving student skills and learning. The main goal of developing the testing module in this study was one of formative assessment. A formative
assessment serves a dual purpose in providing students feedback on their individual
strengths and weaknesses as well as providing teachers with feedback on strengths and weaknesses in instructional methods.31 The testing module provided information on individual student performance in radiographic interpretation of approximal
surfaces in bitewing images. Overall, the test showed satisfactory class performance
for radiographic caries interpretation. The ROC Az scores indicated that most
students had good discrimination acuity. The lowest Az score was 0.795 and many
students obtained a score above 0.90 (Figure 5). An Az score of 1.0 reflects 100%
sensitivity and 100% specificity while a score of 0.50 reflects a score no better than a guess. The majority of students had sensitivity above 70% (Figure 7). However, 16 students did not perceive 40% of the lesions reported by the faculty, with one
It has been clearly documented that even the practicing clinician does no better than chance in detecting initial approximal enamel lesions.3 White and Yoon have shown that the sensitivity for detection of dentin caries in radiographs was 50-70% with false positive rates of 3-30%, while the detection rate of initial approximal enamel lesions was considerably lower.4A systematic review of the literature
revealed that the sensitivity of radiographic detection of approximal caries was 50%
and the specificity 87%.5 In our study, sensitivity and specificity scores were much higher (median sensitivity=85.1 and the median specificity= 89.4). The high
sensitivity and specificity scores can be explained by the fact that the gold standard
was not the true disease state of the surface, but rather consensus expert opinion. In a teaching environment, the gold standard is not necessarily the true state of the disease process. Within the confines of the limitations of the diagnostic test, it is the expert use of the information provided by the test that the teacher tries to convey to the student. Thus, the gold standard for teaching purposes can be, and usually is, expert opinion. Therefore, for the purpose of this project, student performance was assessed using the faculty as the gold standard. This is what the student encounters
within the academic setting and the level they will be expected to perform at in their
clinical practice.
Yet, it is also important that students are aware of the limitations of various
imaging modalities and that a histologic gold standard can serve as an excellent
modalities. For example, conventional two-dimensional radiography limits the observer’s ability to identify lesions due to superimposition of structures, system noise, variable lesion size and imaging geometry.The use of image editing has been shown as a feasible alternative for incorporating histologically verified tooth surfaces into existing clinical images.30
Current teaching methods advise students on an evidence-based approach to
treatment planning, encouraging an understanding and use of risk assessment,
prognosis and outcome measures.32 Although treatment planning decision making is beyond the scope of this study, students should be competent in the principles of
risk assessment, prognosis and outcome measures when interpreting radiographic
images. In regards to risk assessment, a student can assess caries risk based on
the number of missing teeth, number of restored surfaces, and presence of
suggestive caries lesions. Based on the nature of approximal caries, one important
element of risk is the state of the adjacent tooth surface. Students are instructed to
consider the presence or absence of a radiolucency in the adjacent surface into their
assessment of a questionable approximal radiolucency. The impact of the adjacent
surface on the test surface was tested in this study by image editing a subsample of
adjacent approximal surfaces. In this study, adjacent surfaces were changed from
healthy to carious. It was hypothesized that if the student’s assessment of the
adjacent surface before and after the editing process was correct, that this would
increase the risk that the test surface was carious. When the risk was increased, the
results showed the median sensitivity increased from 71.4% to 85.7% (IQR
test surface was healthy, were more likely to call it carious when the test surface was placed adjacent to a surface with a caries lesion. On the other hand, the median specificity decreased from 100% to 88.9% (IQR difference=-10.0%). This implies that some students, who initially thought a truly healthy surface was healthy, were less likely to think so when the surface was placed adjacent to an obvious caries lesion. The hypothesized increase in sensitivity and decrease in specificity was statistically significant (p<0.001). However, the effect of the adjacent surface was not the same for every student. For each student, the relationship between the change in sensitivity and the change in specificity was plotted (Figure 12). There were 25 students who had an increase in sensitivity and a decrease in specificity. Thus, an increase in perceived risk resulted in an increase in both the true positive rate and the false positive rate. Fifteen students showed an increase in sensitivity, but no change in specificity; this was considered an ideal scenario, because the true positive rate increased but the false positive rate stayed the same. However, 5 students showed a decrease in sensitivity and a decrease in specificity. Interestingly, there were seven students who were not swayed at all by the presence of a caries lesion in the adjacent surface. Although not tested in this study, it can be
hypothesized that a decrease in perceived risk, i.e. the adjacent surface changing from carious to healthy, would lead to an increase in both the true negative rate and the false negative rate for a significant number of students.
diagnosis , more weight should be placed on including elements of risk assessment that boost the positive predictive value. On the other hand, if the negative
consequences of a false positive diagnosis are greater than the negative consequences of a false negative diagnosis, more weight should be placed on elements of risk assessment that boost the negative predictive value. The increased prevalence of fluoride and better access to dental care have led to slower caries progression rates and a decrease in the portion of the population experiencing the majority of caries. This trend would lead to acceptance of a lower sensitivity to reduce invasive treatment of sound tooth surfaces for low risk patients. However, maintaining a high sensitivity, especially for early caries lesions, would provide an opportunity to intervene with noninvasive therapies to prevent further progression of the disease. Therefore, even though a shift in the caries paradigm has occurred over the last few decades, a high sensitivity rate is still preferred in early caries diagnosis, as long as it is not at the cost of lower specificity.
Based upon the current findings, teaching models can be designed to provide
appropriate learning experiences to meet the individual student’s needs. A student
who shows weaknesses in specific interpretation tasks can be channeled specific
tutorial and practice exercises to improve upon those skills. As the student interacts
with the teaching module, the system will adapt to understand the student’s
weaknesses and direct the learning toward improving those skills. Once the student
reaches a basic understanding of a particular concept, the teaching module will
thinking skills, encouraging the student to apply their foundational knowledge in a
variety of case-based scenarios.
The results of this study showed the feasibility of assessing individual student performance in radiographic interpretation using a web-based assessment tool. While the test showed satisfactory class performance for radiographic caries
Figure 2. Sample Question of Testing Module Testing module sample question
Sample Question of Testing Module
Figure 3. Sample Follow-up Depth Response Testing module sample follow
up Depth Response
Figure 4. Image Editing to Increase Caries Risk
Figure 5. Categorical Assessment of Student A
1 0 0
2 1 0 0 2 4 6 8 10 12 14 N
Categorical Assessment of Student Az Scores
Figure 6. Summary of Student’s Sensitivity and Specificity
The top and bottom portions of the boxes represent the upper and lower quartiles respectively. The center line is the median or 50
extent of the lowest and highest (IQR). Outliers are marked
Summary of Student’s Sensitivity and Specificity
The top and bottom portions of the boxes represent the upper and lower quartiles respectively. The center line is the median or 50th percentile. The whiskers show the
highest data in a range 1.5 times the interquartile range utliers are marked with dots or asterisks.
The top and bottom portions of the boxes represent the upper and lower quartiles percentile. The whiskers show the
Figure 7. Categorical Assessment of Individual S 1
5 0
5 10 15 20 25
40-49 50-N
Categorical Assessment of Individual Student’s Sensitivity Scores 5
10
14
25
23
-59 60-69 70-79 80-89 90-99
SENSITIVITY
tudent’s Sensitivity Scores 2
Figure 8. Categorical Assessment of Individual Student Specificity Scores
2 0
0 5 10 15 20 25 30 35
20-29 30-39 N
. Categorical Assessment of Individual Student Specificity Scores
0 2 2
14
21
33
40-49 50-59 60-69 70-79 80-89 90-SPECIFICITY
. Categorical Assessment of Individual Student Specificity Scores 33
6
Figure 9. Comparison of Faculty to
F represents Faculty and S represents the Students; enamel; 2=more than ½ way through the enamel
8.9% 5.7% 0% 5% 10% 15% 20% 25% 30% 35% 40% F1S1 F1S2
Comparison of Faculty to Student Depth Assessment
represents Faculty and S represents the Students; 1= less than ½ way through 2=more than ½ way through the enamel; 3=through the DEJ.
0.3%
6.0%
17.5%
4.0% 2.7%
15.2%
F1S3 F2S1 F2S2 F2S3 F3S1 F3S2
way through 3=through the DEJ.
15.2%
39.7%
Figure 10. Comparison of Faculty to 66% of the student responses the faculty (F).
8.9% 5.7% 0% 5% 10% 15% 20% 25% 30% 35% 40% F1S1 F1S2
Comparison of Faculty to Student Depth Assessment
responses (S) regarding the lesion depth were in agreement with 0.3%
6.0%
17.5%
4.0% 2.7%
15.2%
F1S3 F2S1 F2S2 F2S3 F3S1 F3S2
regarding the lesion depth were in agreement with 15.2%
39.7%
Figure 11, Comparison of Faculty to 34% of the student responses
depth. In 22% of the cases the disagreement with the faculty was a difference between an enamel lesion and a dentin lesion
8.9% 5.7% 0% 5% 10% 15% 20% 25% 30% 35% 40% F1S1 F1S2
Comparison of Faculty to Student Depth Assessment.
34% of the student responses (S) did not agree with the faculty (F) regarding lesion In 22% of the cases the disagreement with the faculty was a difference
amel lesion and a dentin lesion. 0.3%
6.0%
17.5%
4.0% 2.7%
15.2%
F1S3 F2S1 F2S2 F2S3 F3S1 F3S2
regarding lesion In 22% of the cases the disagreement with the faculty was a difference
15.2%
39.7%
Figure 12. Relationship between N=number of students; + = increa
Relationship between Changes in Sensitivity and Changes ; + = increase; - = decrease; 0 = no change
Table 4. Five-Point Likert Scale for Observer Response
Response Description
1 Definitely no caries present
2 Probably no caries present
3 Undecided
4 Probably caries present
Table 5. Response Categories for Lesion Depth
Response Description
R1 outer ½ of the enamel
R2 inner ½ of the enamel
Table 6. Distribution of Disease Status of Approximal Surfaces N Faculty interpretation
47 No radiolucency
8 Radiolucency confined to outer ½ enamel 15 Radiolucency confined to inner ½ enamel 24 Radiolucency confined to outer ½ dentin
Table 7. Distribution of Lesion Depth
Depth Faculty interpretation N
1 outer ½ of the enamel 8
2 inner ½ of the enamel 15
3 outer ½ of the dentin 24
Table 8. Scenarios for Testing the Effect of Perceived Risk
Scenario Test surface Adjacent surface Total
I Healthy Healthy 10
Healthy Diseased 10
II Incipient Healthy 8
Table 9. Distribution of Surfaces for Testing the Effect of Perceived Risk
Status Depth N
Non-carious 38
Carious outer 1/2 enamel 7
inner 1/2 enamel 8
Outer 1/2 dentin 19
Table 10. Descriptive Statistics for Student Diagnostic Accuracy in Assessing Approximal Surfaces
Median 25%
Quartile
75%
Quartile IQR
Sensitivity 85.1 72.3 91.5 19.2
Specificity 89.4 80.4 95.7 15.4
Az Score 0.9 0.9 1.0 0.05
Table 11. Descriptive Statistics for Changes in Student Diagnostic Accuracy as a Result of Changes in Perceived Caries Risk
Median 25%
Quartile
75%
Quartile IQR
Specificity Low risk 100 85.7 100 14.3
High risk 88.9 66.7 100 33.3
Sensitivity Low risk 71.4 50 100 28.6
High risk 85.7 78.8 100 28.6
CHAPTER 4
SUMMARY
Within the context of Fryback and Thornbury’s proposed hierarchical model, the efficacy of a diagnostic imaging modality is assessed through six levels.33 Many studies focus on levels one and two, with the goal of improving the technical and diagnostic aspects of the imaging process. Higher levels address how diagnostic imaging affects patient management, patient treatment outcomes, and cost to benefit analysis. An interesting link between the lower and higher levels is the observer; the observer plays a pivotal role in diagnostic accuracy at the level of decision thinking. The observer must make a decision about the presence or absence of a lesion under conditions of uncertainty. Those conditions may result from the imaging modality, the lesion or the observer. Wenzel stated, “the interpreter more than the image receptor may be the limiting factor in this diagnostic imaging chain”.8
common observer error occurring in decision making. He suggested the errors could arise if the observer is negatively influenced by the clinical history, the prior
probability of disease or any of a number of distracting factors. Espelid and coworkers alluded to observer variability in detecting radiographic approximal lesions. Their study reported that radiographic interpretation of approximal lesions was prone to error and that this leads to uncertainty in the decision process of caries diagnosis.35, 36
Aware of observer variability and its impact on treatment decisions, Mileman developed a computer assisted learning tool with the purpose of improving
radiographic approximal caries detection.37, 38 The learning tool was tested on a group of third-year dental students and proved beneficial in improving their
sensitivity scores while maintaining their specificity scores. The tool was successful in reducing student variability. As in Mileman’s study, our project was focused on the dental student as the pivotal observer in the diagnostic process. However, the goal of the current project was that of assessing student competency in radiographic interpretation of approximal lesions as well as providing insight into current teaching methods. Not only was a student’s ability to detect incipient approximal lesions evaluated, but also their use of risk-related information in the decision making process. By changing caries risk within the image, students were tested on whether they perceived a change, and, if so, how they used the information in their diagnostic decision making.
patterns within the image and assimilate the information in decision making process. Adding to the challenge is the fact that radiographic signs of a lesion are sometimes absent or ambiguous as a result of limitations of the diagnostic imaging system and the characteristics of the lesion. Since the overall process is based on a series of factors affected by the imaging system, the patient and the individual observer, it is often hard to measure the contribution of specific components in the diagnostic chain. Krupinski suggested that developing perception research may reveal methods of improving an observer’s diagnostic performance by providing insight into how to measure and analyze observer performance and perception.39
The developed testing module was designed for formative assessment. The
test was able to provide students feedback on their strengths and weaknesses in
over-reading or under-reading approximal surfaces. Teachers can also use this
information as feedback on their teaching approaches and how to focus future
teaching. However, the module could also function on the summative level,
assessing the individual student’s competency in a diagnostic task prior to
graduation. For example, a test score of 70% is often set as a passing score or
cutscore. Cutscores are usually set by the institutions and are a reflection of the
learning objectives and level of competency mandated by the educational curriculum
and set standards. These standards can take the form of normative or criterion
referenced standards.40 The normative approach compares the individual student to
a norm or peer reference. Such tests are often used to rank students with the
intention to select only the top tier, for instance for acceptance into dental school. On
of knowledge, focusing on the student’s ability to surpass a set cutscore. The
applicability of our test fits well within this purpose to identify students who can
surpass the set cutscore in order to proceed to a next level or graduate status. With
an arbitrarily set cutscore of 70%, the majority of students had sensitivity and
specificity scores above this level. However, there were still students with a cutscore
of less than 70%, which means they did not meet the defined level of competence.
By changing the risk within the image, this study assessed students’ use of perceived changes in risk in their decision making process. The testing module included cases that increased risk through manipulation of the adjacent approximal surface. For each individual student, only images where the student perceived a caries lesion on the adjacent surface were selected for analysis. Since each student had a different sample size, those students who did not recognize a majority of the implanted adjacent caries lesions had smaller sample sizes for analysis. Initially, the receiver operating characteristic analysis was chosen because it measures
diagnostic accuracy without the influence of the decision criterion. ROC analysis plots the true positive rate against the false positive rate. The goal was to compare the individual student’s Az score in the low risk cases to their Az score in the high risk
cases. After calculating sensitivities and specificities, the students’ ROC Az scores
were calculated in ROCKFIT. Due to the variability in the sub sample sizes and reduced sample sizes, degenerate data made this assessment impossible.
caries surface improved their ability to detect the test lesion when there was a lesion present but at the cost of calling more healthy surfaces diseased. Twenty students showed improved sensitivity scores while their specificity remained unchanged, reflecting the ideal scenario. However, some students’ performance worsened; sensitivity and specificity scores were lower when the risk within the image was increased. This implies they were negatively influenced by the increased risk.
Another approach for assessing how a student’s perception of the approximal
surfaces was impacted by the increased risk was to analyze changes in confidence
levels. For example, in cases where the test surface was healthy and the adjacent
surface went from healthy to carious, the student may have remained confident in
the presence of a healthy surface, implying they were unaffected by the increased
risk. This would be a positive outcome. On the other hand, in cases where the test
surface had an incipient lesion and the adjacent surface went from healthy to caries,
the student may have felt more confident of the presence of a lesion, implying they
were affected by the increased risk. This would also have been a positive outcome.
Recording directional movement within the Likert scale and categorizing it as a
positive or negative outcome is challenging. However, it may reveal more subtle
changes in diagnostic decision making that are not captured by calculating changes
in sensitivity and specificity.
The novel process of photo-editing histologically verified tooth surfaces into existing clinical bitewing radiographs to alter risk raises concern of using this
user. Calberson defined non-malicious editing as changes within the image that do not alter the content of the image.41 These alterations may include adjusting
brightness and contrast. Malicious manipulation of digital images involves adding or deleting information that changes the content of the image. While fraudulent
behavior is possible with digital and analog images, the purpose of this study is to promote a positive use of photo-editing. Most digital systems track alterations to the images or keep a copy of the original. This provides a track record for any type of image manipulation and safeguards the integrity of the original image.
One of the limitations of photo-editing is that it is labor intensive. The process requires a large set of digital images that contain histologically verified tooth
surfaces and a large set of clinical bitewing images. Experience in photo-editing and knowledge of tooth anatomy and image characteristics are also required. For our project, one researcher selected the images and tooth surfaces to match the shape and contours as close as possible to the available histologically verified teeth. A second researcher reviewed the compatibility of the matched pairs. Two weeks after the images were edited, they were reviewed again and additional editing was
performed to correct any noticeable artifacts. This was considerably labor and time intensive. Therefore the cost-benefit ratio may not make this a practical approach for some educational and research environments.
as they were actually made using the image editing technique, that is, an increase in caries risk.
Most tests of diagnostic accuracy involve evaluation of inter-rater and intra-rater reliability. For validation of image editing of radiographic approximal tooth surfaces, three faculty members were asked to identify edited images and the specific surface. The inter-rater reliability was calculated using percentages.
However, no intra-rater reliability was calculated because this study’s focus was not on testing the faculty’s radiographic interpretive skills nor their ability to diagnose caries. As for the validation of the testing module, the students were assessed as pivotal players in the diagnostic process. The difference between the faculty and each student was assessed by calculating sensitivity, specificity and ROC Az scores. Again no intra-rater reliability was calculated since the focus of this study was on how the student performed to the faculty standard.
In a clinical scenario, it is impossible to know the true disease state of teeth and therefore students are taught by faculty and can only realistically be held to a faculty standard level. Students cannot be expected to function at the level of ground truth. It is a choice whether to base the testing module on ground truth or on a
faculty standard and for research purposes it depends on the question to be answered. Based on the research question, a faculty consensus was used as the measureable standard. The goal was to evaluate current teaching methods assess student’s competence in radiographic interpretation. If the faculty had been tested against a histological ground truth, it is expected that false positive and false
imaging modality, but also as a result of observer error. The latter was minimized by using the consensus opinion of multiple observers. Wenzel indicated only 50-70% of the lesions are detected on bitewing images8, 42 and Hintze reports even fewer are detected when limited to enamel lesions.3 White et al. confirm this is also the case whether it is film based or digital based systems.4
In order for a testing module to capture a student’s performance in
radiographic interpretation, the test should meet quality standards. Turnbull outlines the qualities of an effective assessment tool. These characteristics include validity and reliability as well as accountability, flexibility, comprehensiveness, feasibility, timeliness, and relevance.43 The developed testing module was valid in that it assessed a student’s performance in the skill of radiographic interpretation,
specifically their ability to interpret approximal surfaces in clinical bitewing images. By incorporating the increased risk within a subsample of the images, students were evaluated on how they used perceived risk information. The test was accountable for both students and faculty in that it provided feedback on a student level and on an educator level. The test was relevant and timely in that it was applied at an
appropriately justifiable period within the student’s academic timeline, based on their completion of the didactic radiology courses and on the fact they had some clinical experience with radiographs.
An underlying theme of this study was to evaluate a student’s visual
into the decision making process and is of importance in the educational process. Which is weighted heavier depends on many factors such as saliva pH, diet, oral hygiene, etc. Therefore treatment decisions should take all those factors into consideration, such as the consequences of a false positive diagnosis in a healthy mouth and a false negative diagnosis in a heavily restored mouth. These issues can be addressed in future additions to this project. Once the initial groundwork is
developed, adding case-based learning can be tailored to individual student learning.
While the testing module was purpose driven to discover what the learner does and what the learner knows, it was a prototype and therefore limited in its reliability and comprehensibility. The test was administered to only one group of students at one period of time. Future use of the testing module could include assessment of the same group at a different academic timepoint or assessment of another group of students. Furthermore, the module only assessed caries
interpretation on approximal surfaces. For the test to pass comprehensive standards, it would need to be feasible on a larger scale.
e-learning modules allow for more appropriate and efficient e-learning experiences. Of course, radiographic interpretation is only one aspect in the treatment decision process. Students must learn to assimilate their clinical examination with their radiographic findings. The e-learning modules can be developed upon a platform to provide a system that will continue to elevate the student’s depth of knowledge by encouraging cognitive thinking skills, encouraging the student to apply his/her foundational knowledge in a variety of problem-based clinical scenarios. Focusing on the observer is an enlightening perspective.
Conclusions:
• A substantial number of approximal surfaces in bitewing images can be transplanted without experienced observers detecting the alterations.
• The feasibility of assessing individual student performance in radiographic interpretation using a web-based assessment tool was demonstrated.
• The testing module proved useful in assessing students’ performance in interpretation bitewing radiographs for approximal caries.
• Diagnostic decision making by a majority of students was influenced by the disease status of the adjacent surface, implying that perceived caries risk can influence diagnostic accuracy.
• An increase in perceived risk increased the sensitivity and decreased the specificity.