The Association of Arsenic
Exposure and Metabolism With
Type 1 and Type 2 Diabetes in
Youth: The SEARCH Case-Control
Study
Diabetes Care 2017;40:46–53|DOI: 10.2337/dc16-0810
OBJECTIVE
Little is known about arsenic and diabetes in youth. We examined the association of arsenic with type 1 and type 2 diabetes in the SEARCH for Diabetes in Youth Case-Control (SEARCH-CC) study. Because one-carbon metabolism can influence arsenic metabolism, we also evaluated the potential interaction of folate and vitamin B12 with arsenic metabolism on the odds of diabetes.
RESEARCH DESIGN AND METHODS
Six hundred eighty-eight participants<22 years of age (429 with type 1 diabetes, 85 with type 2 diabetes, and 174 control participants) were evaluated. Arsenic species (inorganic arsenic [iAs], monomethylated arsenic [MMA], dimethylated arsenic [DMA]), and one-carbon metabolism biomarkers (folate and vitamin B12) were measured in plasma. We used the sum of iAs, MMA, and DMA (∑As) and the individual species as biomarkers of arsenic concentrations and the relative pro-portions of the species over their sum (iAs%, MMA%, DMA%) as biomarkers of arsenic metabolism.
RESULTS
Median∑As, iAs%, MMA%, and DMA% were 83.1 ng/L, 63.4%, 10.3%, and 25.2%, respectively.∑As was not associated with either type of diabetes. The fully adjusted odds ratios (95% CI), rescaled to compare a difference in levels corre-sponding to the interquartile range of iAs%, MMA%, and DMA%, were 0.68 (0.50– 0.91), 1.33 (1.02–1.74), and 1.28 (1.01–1.63), respectively, for type 1 diabetes and 0.82 (0.48–1.39), 1.09 (0.65–1.82), and 1.17 (0.77–1.77), respectively, for type 2 diabetes. In interaction analysis, the odds ratio of type 1 diabetes by MMA% was 1.80 (1.25–2.58) and 0.98 (0.70–1.38) for participants with plasma folate levels above and below the median (Pfor interaction = 0.02), respectively.
CONCLUSIONS
Low iAs% versus high MMA% and DMA% was associated with a higher odds of type 1 diabetes, with a potential interaction by folate levels. These data support further research on the role of arsenic metabolism in type 1 diabetes, including the interplay with one-carbon metabolism biomarkers.
1Department of Environmental Health Sciences,
Johns Hopkins Bloomberg School of Public Health, Baltimore, MD
2
Department of Environmental Health Sciences, Columbia University Mailman School of Public Health, New York, NY
3
Department of Epidemiology, Johns Hopkins Bloomberg School of Public Health, Baltimore, MD
4Welch Center for Prevention, Epidemiology and
Clinical Research, Johns Hopkins Medical Institu-tions, Baltimore, MD
5
Kidney Institute and Division of Nephrology, Department of Internal Medicine, China Med-ical University Hospital and College of Medi-cine, China Medical University, Taichung, Taiwan
6
Division of the National Toxicology Program, National Institute of Environmental Health Sci-ences, National Institutes of Health, Department of Health and Human Services, Research Triangle Park, NC
7
Department of Nutrition, University of North Carolina Gillings School of Global Public Health, Chapel Hill, NC
8Department of Epidemiology, Colorado School
of Public Health, University of Colorado Denver, Aurora, CO
9
Department of Environmental and Occupa-tional Health, Colorado School of Public Health, University of Colorado Denver, Aurora, CO
10
Diabetes Epidemiology and Clinical Research Section, National Institute of Diabetes and Di-gestive and Kidney Diseases, Phoenix, AZ
11Wake Forest School of Medicine,
Winston-Salem, NC
12
National Institute of Environmental Health Sci-ences, National Institutes of Health, Bethesda, MD
13
Department of Epidemiology and Biostatistics, Arnold School of Public Health, University of South Carolina, Columbia, SC
14
Department of Biological Sciences, North Car-olina State University, Raleigh, NC
Maria Grau-P ´erez,1,2Chin-Chi Kuo,1,3–5 Miranda Spratlen,1Kristina A. Thayer,6 Michelle A. Mendez,7Richard F. Hamman,8 Dana Dabelea,8John L. Adgate,9
William C. Knowler,10Ronny A. Bell,11 Frederick W. Miller,12Angela D. Liese,13 Chongben Zhang,7Christelle Douillet,7 Zuzana Drobn ´a,7,14
Elizabeth J. Mayer-Davis,7,15 Miroslav Styblo,7
and Ana Navas-Acien1–4
EPID
EMIOL
OGY/
HEAL
TH
SERV
ICES
RESE
Increasing evidence supports the role of environmental chemicals in diabetes de-velopment, although most studies have focused on adult populations, and little information is available for type 1 dia-betes (1). Inorganic arsenic (iAs) is a toxicant and carcinogen that occurs nat-urally in the environment, especially in groundwater. Dietary sources are in-creasingly recognized as a concern for general populations because arsenic is found in rice, grains, and certain juices (2). Studies in adult populations support the association of chronic exposure to iAs in drinking water with diabetes, spe-cifically type 2 diabetes (3,4). Research in children and adolescents and in pop-ulations exposed to arsenic mostly from food is needed.
No epidemiological studies to our knowledge have evaluated the associa-tion between arsenic and type 1 diabe-tes, which is primarily characterized by impaired insulin secretion as a result of an autoimmune assault on pancreatic
b-cells. No experimental animal studies have been specifically designed to eval-uate the role of arsenic in type 1 diabe-tes. Several lines of evidence, however, support the consideration of arsenic in the pathogenesis of type 1 diabetes. First, arsenic may impair the immune system (5). Second, prenatal arsenic ex-posure may alter the microbiome com-position in early childhood, potentially influencing arsenic metabolism and sus-ceptibility to type 1 diabetes (6). Third, pancreaticb-cells are recognized as a target tissue for various arsenic species in humans, animals, and in vitro model systems (4,7). After exposure, iAs is methylated in the body into monome-thylated arsenic (MMA) and dimethy-lated arsenic (DMA) compounds that are excreted in the urine together with iAs, with a half-life of 4 days (8). Arsenic metabolism, in particular higher relative concentrations of DMA together with lower concentrations of MMA in the urine, has been related to increased prevalence and incidence of diabetes in adults (9–11).
SEARCH for Diabetes in Youth Case-Control (SEARCH-CC) is a two-center study designed to characterize type 1 and type 2 diabetes and assess selected risk factors for both diabetes types in youth (12). To provide novel informa-tion on the potential role of arsenic in diabetes in children, we used biospeci-mens collected in SEARCH-CC to measure arsenic species in plasma and investigate their association with type 1 and type 2 diabetes. By taking together the epidemi-ological and experimental studies and potential mechanisms involved, we hy-pothesized that arsenic exposure and me-tabolism is associated with an increased odds of both type 1 and type 2 diabetes. Because one-carbon metabolism nutri-ents, such as folate and vitamin B12, are related to arsenic metabolism (13,14) and diabetes-related outcomes (15), we ad-justed for and conducted an interaction analysis of plasma folate and vitamin B12 in regression models of the association be-tween arsenic and diabetes.
RESEARCH DESIGN AND METHODS
Study Population and Case-Control Recruitment
SEARCH is a population-based study ini-tiated in 2000 to better understand how diabetes develops in children and youth. SEARCH is being conducted infive sites across the U.S. (South Carolina, Ohio, Colorado, California, and Washington) and comprises.20,000 participants age
,20 years, including a wide range of racial and ethnic groups and socioeconomic backgrounds (16).
For the current study, we used data from SEARCH-CC, an ancillary study con-ducted in two of thefive SEARCH sites (four counties around Columbia, SC, and six counties around Denver, CO). Re-cruitment of SEARCH-CC participants between 10 and 22 years of age oc-curred between July 2003 and March 2006 in primary care offices. All patients with a clinical diagnosis of type 1 and type 2 diabetes, potential control partici-pants, and their parents/guardians were provided an informational brochure and
invited to complete a one-page permission form for further contact. Control partici-pants were concurrently recruited from the same primary care offices, following the rationale that all SEARCH cases arose from health care provider offices.
The clinical diabetes type assigned by the health care provider was recorded as part of the case validation process and then categorized as type 1 (combin-ing type 1, type 1a, and type 1b) and type 2. Other types (including gesta-tional diabetes mellitus, hybrid type, maturity onset of diabetes in youth, sec-ondary diabetes, type unknown by the reporting source, type designated as other, and missing type) were excluded. In a study of the full SEARCH cohort, the provider’s diagnosis was shown to be consistent with a classification based on diabetes autoantibodies and esti-mated insulin sensitivity (17). Control participants were confirmed as not hav-ing diabetes by fasthav-ing glucose levels ob-tained at the SEARCH-CC study visit (12,18).
The response rate was 53% in case participants and 49% in control partici-pants (12) for a total sample size of 722 participants (445 with type 1 diabetes, 91 with type 2 diabetes, and 186 control participants). Participants were similar in age, sex, and race/ethnicity to nonpartici-pants (12,18). We further excluded partic-ipants with missing data on plasma arsenic species concentrations (n= 7), BMI (n= 8), parental educational level (n= 2), and vi-tamin B12 (n= 17), resulting in a total of 688 participants for the current study (429 with type 1 diabetes, 85 with type 2 diabetes, and 174 control participants). Participants$18 years of age and parents of participants,18 years of age provided written informed consent.
Data and Sample Collection
Trained staff used a standardized protocol to collect sociodemographic data (sex, age, race/ethnicity, parental educational level), conduct a physical examination (blood pressure, height and weight to assess BMI, waist circumference), and collect
15Deparment of Medicine, University of North
Carolina Gillings School of Global Public Health, Chapel Hill, NC
Corresponding authors: Maria Grau-P ´erez, [email protected], and Ana Navas-Acien, [email protected].
Received 13 April 2016 and accepted 13 October 2016.
This article contains Supplementary Data online at http://care.diabetesjournals.org/lookup/ suppl/doi:10.2337/dc16-0810/-/DC1.
fasting blood and urine samples (12). Waist circumference was measured just above the uppermost lateral border of the right ilium based on National Health and Nutrition Examination Study protocol (19). Height was measured with a stadiom-eter. Weight was measured with an elec-tronic scale. Age- and sex-specific BMI z scores were derived on the basis of Centers for Disease Control and Preven-tion naPreven-tional standards (20). Obesity was defined as having a BMI$95th percentile for age and sex.
Blood samples were obtained under conditions of metabolic stability after at least 8 h of fasting. Specimens were pro-cessed at the sites and shipped within 24 h to the central laboratory (North-west Lipid Metabolism and Diabetes Research Laboratories, University of Washington, Seattle, WA) and stored at,270°C. Total folate and vitamin B12 concentrations in plasma were an-alyzed by using an AccuBind ELISA kit (Monobind, Lake Forest, CA) while fol-lowing the manufacturer’s protocol. A reference analysis of folate was per-formed in 50 randomly selected samples by microbial assay (21) in the Nutrition
Obesity Core of the Nutrition Research Institute (Kannapolis, NC).
Plasma Arsenic Determinations
In 2014, stored aliquots of 0.5 mL plasma per participant were shipped to the laboratory of M.St. at the University of North Carolina where they were ana-lyzed for arsenic species. The iAs, MMA, and DMA concentrations were measured in 25mL of plasma by using hydride gen-eration–cryotrapping inductively coupled mass spectrometry (22). The limits of de-tection were 0.63 ng arsenic/L for iAs and 0.05 ng arsenic/L for MMA and DMA. The intraassay coefficients of variation were 3.6% for iAs, 3.8% for MMA, and 3.3% for DMA. To ensure accuracy of the analysis, a standard reference material, Arsenic Species in Frozen Human Urine (SRM 2669; National Institute of Standards and Technology) diluted in deionized water was analyzed with approximately every other group of samples for a total of 34 times. The average concentrations of iAs, MMA, and DMA in SRM 2669 determined by hydride generation– cryotrapping inductively coupled mass spectrometry represented 90.4%, 94.5%,
and 79.6% of the certified values, respec-tively (Supplementary Table 1). For addi-tional quality control, SRM 2669 was diluted in human plasma. The averaged concentrations determined by 12 inde-pendent analyses represented 97.1%, 98.6%, and 89.0% of the certified values for iAs, MMA, and DMA, respectively (Supplementary Table 2).
We used the sum of iAs, MMA, and DMA concentrations (∑As) to assess total arsenic exposure. The proportions of iAs, MMA, and DMA over their sum and multiplied by 100 (expressed as iAs %, MMA%, and DMA%) were used as arsenic metabolism biomarkers.
Statistical Analysis
Statistical analyses were performed using R version 3.1.2 software (23). Dif-ferences in characteristics between par-ticipants with type 1 and type 2 diabetes and control participants were deter-mined with Mann-Whitney Utest for continuous variables andx2test for cat-egorical variables (Table 1). Because ar-senic metabolism biomarkers add up to 100%, we graphically described the distribution of arsenic metabolism by
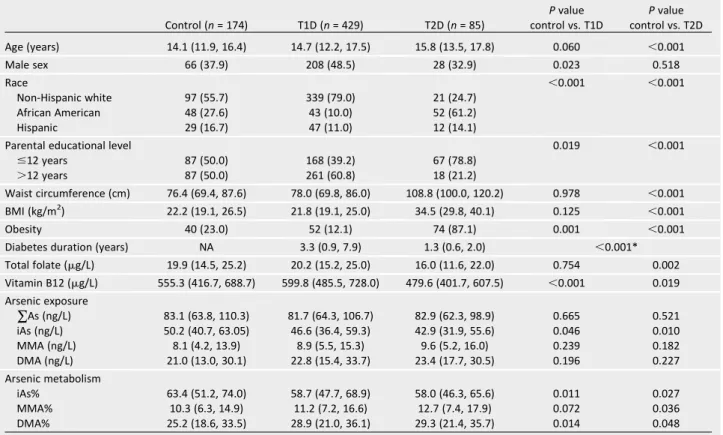
Table 1—Participant characteristics by diabetes status
Control (n= 174) T1D (n= 429) T2D (n= 85)
Pvalue control vs. T1D
Pvalue control vs. T2D
Age (years) 14.1 (11.9, 16.4) 14.7 (12.2, 17.5) 15.8 (13.5, 17.8) 0.060 ,0.001
Male sex 66 (37.9) 208 (48.5) 28 (32.9) 0.023 0.518
Race ,0.001 ,0.001
Non-Hispanic white 97 (55.7) 339 (79.0) 21 (24.7)
African American 48 (27.6) 43 (10.0) 52 (61.2)
Hispanic 29 (16.7) 47 (11.0) 12 (14.1)
Parental educational level 0.019 ,0.001
#12 years 87 (50.0) 168 (39.2) 67 (78.8)
.12 years 87 (50.0) 261 (60.8) 18 (21.2)
Waist circumference (cm) 76.4 (69.4, 87.6) 78.0 (69.8, 86.0) 108.8 (100.0, 120.2) 0.978 ,0.001
BMI (kg/m2) 22.2 (19.1, 26.5) 21.8 (19.1, 25.0) 34.5 (29.8, 40.1) 0.125 ,0.001
Obesity 40 (23.0) 52 (12.1) 74 (87.1) 0.001 ,0.001
Diabetes duration (years) NA 3.3 (0.9, 7.9) 1.3 (0.6, 2.0) ,0.001*
Total folate (mg/L) 19.9 (14.5, 25.2) 20.2 (15.2, 25.0) 16.0 (11.6, 22.0) 0.754 0.002
Vitamin B12 (mg/L) 555.3 (416.7, 688.7) 599.8 (485.5, 728.0) 479.6 (401.7, 607.5) ,0.001 0.019
Arsenic exposure
∑As (ng/L) 83.1 (63.8, 110.3) 81.7 (64.3, 106.7) 82.9 (62.3, 98.9) 0.665 0.521 iAs (ng/L) 50.2 (40.7, 63.05) 46.6 (36.4, 59.3) 42.9 (31.9, 55.6) 0.046 0.010
MMA (ng/L) 8.1 (4.2, 13.9) 8.9 (5.5, 15.3) 9.6 (5.2, 16.0) 0.239 0.182
DMA (ng/L) 21.0 (13.0, 30.1) 22.8 (15.4, 33.7) 23.4 (17.7, 30.5) 0.196 0.227
Arsenic metabolism
iAs% 63.4 (51.2, 74.0) 58.7 (47.7, 68.9) 58.0 (46.3, 65.6) 0.011 0.027
MMA% 10.3 (6.3, 14.9) 11.2 (7.2, 16.6) 12.7 (7.4, 17.9) 0.072 0.036
DMA% 25.2 (18.6, 33.5) 28.9 (21.0, 36.1) 29.3 (21.4, 35.7) 0.014 0.048
case-control status by using a triplot (diagram with three axes) and com-pared the compositional means of iAs%, MMA%, and DMA% in participants with type 1 and type 2 diabetes compared with control participants (Fig. 1). We also reported the pairwise Spearman correlations between∑As concentrations and each arsenic metabolism biomarker (Supplementary Fig. 1) and graphically de-scribed the median and interquartile range for ∑As, iAs, MMA, DMA, iAs%, MMA%, and DMA% across participant subgroups (Supplementary Fig. 2). Sup-plementary Figs. 1 and 2 represent anal-yses conducted only among participants without diabetes because control partic-ipants are more likely to represent the source population.
Odds ratios (ORs) and 95% CI compar-ing arsenic levels for each type of diabe-tes with control were computed by using progressively adjusted logistic re-gression models (Table 2). Arsenic was modeled as log-transformed for∑As, iAs, MMA, and DMA concentrations and in the original scale for arsenic
metabolism biomarkers (iAs%, MMA%, and DMA%). Instead of reporting the re-sults for a change in 1 log-unit (arsenic concentrations) or in 1 unit (arsenic me-tabolism biomarkers), the ORs (95% CI) for type 1 or type 2 diabetes were re-scaled for an interquartile range differ-ence in arsenic levels (i.e., comparing participants in the 75th vs. the 25th per-centiles of each arsenic variable based on the distribution among control par-ticipants). The goal of rescaling was to report the magnitude of the association for a difference in exposure levels that is relevant for the study population and to facilitate the comparison across vari-ables (24). Model 1 was unadjusted. Model 2 was adjusted for age ous), sex (male, female), BMI (continu-ous), parental educational level (#12 years, .12 years), and race/ethnicity (non-Hispanic white, African American, and Hispanic). Model 3 was further ad-justed for total folate (continuous) and vitamin B12 (continuous). We ran addi-tional models to assess possible nonlin-ear relationships. First, each arsenic
variable was introduced as tertile cate-gories, and the ORs of each type of di-abetes were compared with arsenic tertiles 2 and 3 to the lowest tertile (Supplementary Table 3). The cutoffs for the tertiles were based on the per-centiles of probabilities tertiles 1/3 and 2/3 of each arsenic variable in control participants. Second, we graphically es-timated the ORs of each type of diabetes based on restricted quadratic splines with knots at the 10th, 50th, and 90th percentiles of each arsenic variable dis-tribution (Supplementary Figs. 3–6).
One-carbon metabolism plays a role in arsenic metabolism. In an exploratory analysis, we evaluated the potential in-teraction of folate and vitamin B12 lev-els with arsenic metabolism on diabetes by including the product regression term of each arsenic variable with cate-gorical folate and vitamin B12 variables in the fully adjusted model (Fig. 2).
Several sensitivity analyses were per-formed to evaluate the consistency of thefindings. First, we adjusted the mod-els for geographical area (South Carolina and Colorado) (Supplementary Table 4) with similar findings. Second, we re-peated the analyses with the exclusion of participants with extreme values in arsenic variables (Supplementary Table 5). Third, because of the unbalanced number of participants with type 1 di-abetes and control participants, we re-peated the analyses for a 1:1 ratio for a total of 174 control participants and 174 participants with type 1 diabetes (selected at random among the 429), with similar findings (Supplementary Table 6). Finally, given the possibility that arsenic could contribute to type 1 and type 2 diabetes in similar ways, we also analyzed both types of diabetes jointly (Supplementary Table 7).
RESULTS
Participant Characteristics
Compared with control participants, participants with type 1 diabetes were older, more likely to be male and non-Hispanic white with higher parental ed-ucational level and to be leaner with higher vitamin B12 levels. Participants with type 2 diabetes were older, more likely to belong to racial/ethnic minority groups, and more likely to be obese with lower parental educational level and lower plasma folate and vitamin B12 levels (Table 1). Participants with both
type 1 and type 2 diabetes had similar concentrations for ∑As, MMA, and DMA and lower concentrations for iAs as well as lower iAs%, higher MMA%, and higher DMA% than control partici-pants. When considering the three arsenic metabolism biomarkers simultaneously, controls had higher iAs% and lower MMA% and DMA% compared with par-ticipants with type 1 or type 2 diabetes (Fig. 1).
The iAs% was strongly and negatively correlated with MMA% and DMA% (Spearman correlations20.65 and20.92, respectively), whereas the correlation be-tween MMA% and DMA% was weak and positive (0.36) (Supplementary Fig. 1).
∑As concentrations were similar across participant subgroups (Supplementary Fig. 2). For arsenic metabolism bio-markers, we found some differences by race/ethnicity, parental educational level, and obesity status (Supplementary Fig. 2).
Plasma Arsenic and Odds of Diabetes
Plasma∑As concentrations were not as-sociated with type 1 diabetes compared with control (fully adjusted OR [95% CI] for an interquartile range difference in log-transformed ∑As concentrations 0.88 [0.69, 1.12]) (Table 2). The direction of the association for the corresponding interquartile range difference, however, was different for the individual arsenic species, with a significant inverse associ-ation for iAs (0.84 [0.71, 0.99]) and non-significant positive associations for MMA (1.22 [0.93, 1.60]) and DMA (1.15 [0.92, 1.43]), although these associations were significant in sensitivity analysis that ex-cluded participants with extreme arsenic concentrations (1.42 [1.03, 1.96] for MMA and 1.33 [1.03, 1.72] for DMA) (Supplementary Table 5).
For arsenic metabolism, the ORs (95% CI) of type 1 diabetes were 0.68 (0.50, 0.91), 1.33 (1.02, 1.74), and 1.28 (1.01, 1.63) for an interquartile range difference in iAs%, MMA%, and DMA%, respectively (Table 2, model 3). Flexible models based on tertiles (Supplemen-tary Table 3) and quadratic splines (Supplementary Figs. 3 and 4) showed similar findings. For type 2 diabetes, the associations with plasma arsenic concentrations and arsenic metabolism biomarkers were not statistically sig-nificant but mostly in the same direc-tion as for type 1 diabetes (Table 2 and Supplementary Figs. 5 and 6). In analyses
for both types of diabetes combined, we found no interaction between any of the arsenic variables and type of diabetes (P= 0.99 for∑As, iAs%, MMA%, and DMA%). The fully adjusted OR (95% CI) of diabetes combined compared with control for an interquartile range difference in∑As, iAs%, MMA%, and DMA% distributions were 0.92 (0.74, 1.15), 0.71 (0.54, 0.93), 1.33 (1.04, 1.70), and 1.23 (0.99, 1.53), respectively.
Interaction of Arsenic With Folate and Vitamin B12
In interaction analysis, the fully adjusted ORs (95% CI) of type 1 diabetes for an interquartile range difference in MMA% were 0.98 (0.70, 1.38) and 1.80 (1.25, 2.58) among participants with folate lev-els below and above the median, re-spectively (P for interaction = 0.02) (Fig. 2). We also found an interaction between MMA% and folate for both types of diabetes combined (Pfor inter-action = 0.01) (data not shown) but not for type 2 diabetes (Fig. 2). We found no other statistically or borderline interac-tions between folate categories and other arsenic measures (data not shown). No effect modification by vitamin B12 was observed (data not shown).
CONCLUSIONS
In children and adolescents who partic-ipated in the SEARCH-CC study, type 1 diabetes was associated with lower plasma iAs% and higher MMA% and DMA%. For type 2 diabetes, the associ-ations were in the same direction but not statistically significant possibly be-cause of the smaller number of cases.
In analyses with type 1 and type 2 di-abetes combined, we found no effect modification by type, suggesting that the association between arsenic metab-olism biomarkers and diabetes may be independent of diabetes type, although this interaction analysis may lack power as a result of the small number of type 2 diabetes cases. The associations of ar-senic metabolism biomarkers and dia-betes remained after adjustment for sociodemographic factors, BMI, and biomarkers of one-carbon metabolism nutrients. In interaction analyses, the association between MMA% and type 1 diabetes was stronger for participants with higher folate levels. Similar but non-significant interaction between MMA% and folate was found for type 2 diabetes. Plasma∑As was not associated with either type of diabetes, although type 1 diabetes was associated with lower iAs concentrations in multiadjusted analy-ses and with higher MMA and DMA in analyses that excluded arsenic outliers. Because concentrations of∑As or indi-vidual arsenic species in plasma are not established biomarkers of arsenic expo-sure, the lack of association between
∑As and diabetes in this study does not necessarily exclude a possible asso-ciation for arsenic exposure assessed with more established biomarkers, such as arsenic species in urine. A pos-sible explanation for lower plasma iAs but higher MMA and DMA concentra-tions in participants with type 1 and maybe type 2 diabetes compared with control participants is that plasma ar-senic concentrations may reflect the
impact of arsenic metabolism, with faster methylation processes (higher MMA% and DMA%) resulting in lower iAs concentrations.
Participants came from areas of Colo-rado and South Carolina that surrounded large cities, and they were most likely ex-posed to low levels of iAs in drinking water compared with other rural areas of the U.S. (25). The major source of iAs exposure in the study population was probably through diet [rice, grains, and juices (2,26)]. Information on the exact sources, however, is not available.
Few studies have evaluated the health effects of arsenic exposure in chil-dren beyond studies of birth outcomes, infectious diseases, and neurocognitive outcomes (27–29). In adults, arsenic ex-posure has been associated with diabe-tes in populations exposed to drinking water arsenic levels .100 mg/L (30) and,100mg/L (3,11,31). Several pro-spective studies are available. Baseline urinary concentrations of∑As were as-sociated with incident diabetes in rural Arizona (32) and Colorado (33) but not in rural areas of the southwestern and mid-western U.S. (9). These studies reported no association with the individual ar-senic species.
For arsenic metabolism, increasing evidence suggests an association with diabetes, although the nature and im-plications of this relationship are not clearly understood. For cancer and car-diovascular disease, higher MMA% and lower DMA% in urine have generally been associated with a higher risk of disease (34,35). For diabetes, however,
studies have shown that the relation-ship with arsenic metabolism is in the opposite direction, with a positive as-sociation between higher DMA% and diabetes in urine, including cross-sectional evidence from Bangladesh (36) and Mexico (11) and prospective evidence from the U.S. (9). Experimentalfi nd-ings support that increased DMA% could be related to diabetes develop-ment because the toxic trivalent form of DMA, DMA(III), has been shown to in-hibit insulin-stimulated glucose uptake in cultured adipocytes (37) and as a potent inhibitor of glucose-stimulated insulin secretion by isolated pancreatic islets (7).
We included folate and vitamin B12 in model adjustments and interac-tion analyses based on evidence that suggests a role for vitamins involved in regulating one-carbon metabolism with both arsenic metabolism and metabolic-related outcomes (13–15). Although the relationship with vitamin B12 is less clear, the association between plasma folate and enhanced arsenic metabolism is well established (13,14). Clinical trials in highly arsenic-exposed populations in Bangladesh showed that folate supple-mentation reduced iAs% and MMA% in urine, reduced total arsenic and MMA concentrations in blood, and increased DMA% in urine (13,14). The one-carbon metabolism cycle generates methyl groups, which are necessary for the oxida-tive methylation of arsenite to MMA(V) and MMA(III) to DMA(V). Data on the re-lationship between folate and vitamin B12 with diabetes are limited. Current ex-perimental and epidemiological evidence suggests that both excesses and defi cien-cies in folate may be associated with type 2 diabetes–related outcomes (15). Less is known about the association be-tween one-carbon metabolism and type 1 diabetes. The currentfindings suggest a potentially complex interconnection among one-carbon metabolism, arsenic metabolism, and diabetes, which warrants additional research, including experimen-tal studies.
Strengths of this study include the large number of type 1 diabetes cases available, the similarity of characteris-tics of study cases to all cases identified in South Carolina and Colorado, the ac-curacy of provider type using autoanti-bodies and insulin sensitivity in the main SEARCH study (17), and the ability to
adjust for relevant confounders, includ-ing one-carbon metabolism nutrients. The study has several limitations. The number of type 2 diabetes cases was small, and we could not evaluate the association between arsenic and type 2 diabetes with sufficient power. Most studies of arsenic exposure and metab-olism measured iAs and methylated ar-senic species in urine. Because urine samples were not collected, we could not compare the current findings in plasma with those traditional measures. Studies that measured arsenic in whole blood found a good correlation with ar-senic in urine (38). Arar-senic measured in blood and plasma could potentially
re-flect biologically effective dose better than urine because it is in more direct contact with relevant tissues (10). An-other advantage is that concentrations in plasma do not need to be adjusted for urine dilution (4). Data on the repeat-ability of arsenic concentrations in plasma or in other biomarkers in chil-dren exposed to low arsenic through the diet are missing. Similar to most epidemiologic studies, we could not differentiate between trivalent and pentavalent forms of arsenic species. The ability to make this distinction would be useful given the inverse as-sociation between iAs concentrations and iAs% with diabetes in the current study and the potential role of MMA(III) and DMA(III) to explain thosefindings. Because of the cross-sectional design, we cannot evaluate the direction of the relationships between arsenic measures in plasma and diabetes de-velopment. The findings, however, would be important even if diabetes changed arsenic metabolism and inter-nal dose because this would imply that diabetes can affect susceptibility to arsenic-related health effects, includ-ing cancer risk.
In conclusion, we found that arsenic metabolism, characterized by the rela-tive proportions of iAs and methylated arsenic species in plasma, was associ-ated with type 1 diabetes in children and adolescents who participated in SEARCH-CC. In particular, low iAs% ver-sus high MMA% and DMA% were asso-ciated with a higher odds of type 1 diabetes. Low iAs concentrations were also associated with a higher prevalence of type 1 diabetes. In post hoc analy-sis, we found an interaction between
MMA% and folate levels, with stronger associations between MMA% and type 1 diabetes among participants with higher folate levels in plasma. Thesefindings provide novel evidence that links ar-senic and diabetes in youth and support the need for additional research that fo-cuses specifically on the relationship with arsenic metabolism, including a careful evaluation of the interplay be-tween arsenic metabolism and one-carbon metabolism on type 1 and type 2 diabetes development.
Funding.This study was supported by the National Institute of Diabetes and Digestive and Kidney Diseases (NIDDK) (DK059184, DK056350, and Intramural Research Program of NIDDK) and the National Institute of Environ-mental Health Sciences (NIEHS) (R01-ES-021367, R01-ES-025216, P30-ES-010126, 5P42-ES-10349, and Intramural Research Program of NIEHS).
Duality of Interest.No potential conflicts of interest relevant to this article were reported.
for the integrity of the data and the accuracy of the data analysis.
Prior Presentation.Parts of this study were presented in abstract and oral form at the International Society for Environmental Epide-miology 28th Annual Conference, Rome, Italy, 1–4 September 2016.
References
1. Kuo CC, Moon K, Thayer KA, Navas-Acien A. Environmental chemicals and type 2 diabetes: an updated systematic review of the epidemio-logic evidence. Curr Diab Rep 2013;13:831–849 2. European Food Safety Authority. Scientific opinion on arsenic in food: Panel on Contami-nants in the Food Chain. EFSA J 2009;7:1351. Available from http://www.efsa.europa.eu/en/ scdocs/scdoc/1351.htm. Accessed 12 December 2011
3. Navas-Acien A, Silbergeld EK, Pastor-Barriuso R, Guallar E. Arsenic exposure and prevalence of type 2 diabetes in US adults. JAMA 2008;300: 814–822
4. Maull EA, Ahsan H, Edwards J, et al. Evaluation of the association between arsenic and diabetes: a National Toxicology Program workshop review. En-viron Health Perspect 2012;120:1658–1670 5. Dangleben NL, Skibola CF, Smith MT. Arsenic immunotoxicity: a review. Environ Health 2013; 12:73
6. Lu K, Abo RP, Schlieper KA, et al. Arsenic exposure perturbs the gut microbiome and its metabolic profile in mice: an integrated meta-genomics and metabolomics analysis. Environ Health Perspect 2014;122:284–291
7. Douillet C, Currier J, Saunders J, Bodnar WM, Matouˇsek T, St ´yblo M. Methylated trivalent ar-senicals are potent inhibitors of glucose stimu-lated insulin secretion by murine pancreatic islets. Toxicol Appl Pharmacol 2013;267:11–15 8. National Research Council.Arsenic in Drink-ing Water. Washington, DC, National Acade-mies Press, 1999
9. Kuo CC, Howard BV, Umans JG, et al. Arsenic exposure, arsenic metabolism, and incident di-abetes in the Strong Heart Study. Didi-abetes Care 2015;38:620–627
10. Currier JM, Ishida MC, Gonz ´alez-Horta C, et al. Associations between arsenic species in exfoliated urothelial cells and prevalence of di-abetes among residents of Chihuahua, Mexico. Environ Health Perspect 2014;122:1088–1094 11. Mendez MA, Gonz ´alez-Horta C, S ´anchez-Ram´ırez B, et al. Chronic exposure to arsenic and markers of cardiometabolic risk: a cross-sectional study in Chihuahua, Mexico. Environ Health Perspect 2016;124:104–111
12. Dabelea D, Mayer-Davis EJ, Lamichhane AP, et al. Association of intrauterine exposure to maternal diabetes and obesity with type 2 di-abetes in youth: the SEARCH Case-Control Study. Diabetes Care 2008;31:1422–1426
13. Gamble MV, Liu X, Ahsan H, et al. Folate and arsenic metabolism: a double-blind, placebo-controlled folic acid-supplementation trial in Bangladesh. Am J Clin Nutr 2006;84:1093–1101 14. Peters BA, Hall MN, Liu X, et al. Folic acid and creatine as therapeutic approaches to lower blood arsenic: a randomized controlled trial. Environ Health Perspect 2015;123:1294–1301
15. Finer S, Saravanan P, Hitman G, Yajnik C. The role of the one-carbon cycle in the devel-opmental origins of type 2 diabetes and obesity. Diabet Med 2014;31:263–272
16. Hamman RF, Bell RA, Dabelea D, et al.; SEARCH for Diabetes in Youth Study Group. The SEARCH for Diabetes in Youth study: ratio-nale,findings, and future directions. Diabetes Care 2014;37:3336–3344
17. Dabelea D, Pihoker C, Talton JW, et al.; SEARCH for Diabetes in Youth Study. Etiological approach to characterization of diabetes type: the SEARCH for Diabetes in Youth Study. Diabe-tes Care 2011;34:1628–1633
18. Liese AD, Puett RC, Lamichhane AP, et al. Neighborhood level risk factors for type 1 dia-betes in youth: the SEARCH Case-Control Study. Int J Health Geogr 2012;11:1
19. Fern ´andez JR, Redden DT, Pietrobelli A, Allison DB. Waist circumference percentiles in nationally representative samples of African-American, European-African-American, and Mexican-American children and adolescents. J Pediatr 2004;145:439–444
20. Kuczmarski RJ, Ogden CL, Grummer-Strawn LM, et al. CDC growth charts: United States. Adv Data 2000 (314):1–27
21. Tamura T. Determination of food folate. J Nutr Biochem 1998;9:285–293
22. Matouˇsek T, Currier JM, Troj ´ankov ´a N, et al. Selective hydride generation- cryotrapping-ICP-MS for arsenic speciation analysis at pico-gram levels: analysis of river and sea water reference materials and human bladder epithe-lial cells. J Anal At Spectrom 2013;28:1456–1465 23. R Core Team. R: a language and environment for statistical computing [Internet], 2014. Vienna, Austria, R Foundation for Statistical Computing. Available from http://R-project.org. Accessed 27 October 2016
24. Babyak MA. Rescaling continuous predictors in regression models [article online]. Psychosom Med 24 September 2009. Available from http://stattips .blogspot.com/2009/08/rescaling-continuous-predictors-in.html. Accessed 27 October 2016 25. Ryker SJ. Mapping arsenic in ground water [article online]. Geotimes 2001;46:34–36. Avail-able from http://water.usgs.gov/nawqa/trace/ pubs/geo_v46n11/fig2.html. Accessed 27 October 2016
26. Davis MA, Mackenzie TA, Cottingham KL, Gilbert-Diamond D, Punshon T, Karagas MR. Rice consumption and urinary arsenic concentrations in
U.S. children. Environ Health Perspect 2012;120: 1418–1424
27. Laine JE, Bailey KA, Rubio-Andrade M, et al. Maternal arsenic exposure, arsenic methylation efficiency, and birth outcomes in the Biomarkers of Exposure to ARsenic (BEAR) pregnancy cohort in Mexico. Environ Health Perspect 2015;123: 186–192
28. Rager JE, Yosim A, Fry RC. Prenatal expo-sure to arsenic and cadmium impacts infectious disease-related genes within the glucocorticoid receptor signal transduction pathway. Int J Mol Sci 2014;15:22374–22391
29. Tolins M, Ruchirawat M, Landrigan P. The developmental neurotoxicity of arsenic: cog-nitive and behavioral consequences of early life exposure. Ann Glob Health 2014;80:303– 314
30. Tseng CH, Tai TY, Chong CK, et al. Long-term arsenic exposure and incidence of non-insulin-dependent diabetes mellitus: a cohort study in arseniasis-hyperendemic villages in Taiwan. En-viron Health Perspect 2000;108:847–851 31. Maull EA, Ahsan H, Edwards J, et al. Evalu-ation of the associEvalu-ation between arsenic and diabetes: a National Toxicology Program work-shop review. Environ Health Perspect 2012;120: 1658–1670
32. Kim NH, Mason CC, Nelson RG, et al. Arsenic exposure and incidence of type 2 diabetes in southwestern American Indians. Am J Epidemiol 2013;177:962–969
33. James KA, Marshall JA, Hokanson JE, Meliker JR, Zerbe GO, Byers TE. A case-cohort study examining lifetime exposure to inorganic arsenic in drinking water and diabetes mellitus. Environ Res 2013;123:33–38
34. Melak D, Ferreccio C, Kalman D, et al. Ar-senic methylation and lung and bladder cancer in a case-control study in northern Chile. Toxicol Appl Pharmacol 2014;274:225–231
35. Chen Y, Wu F, Liu M, et al. A prospective study of arsenic exposure, arsenic methylation capacity, and risk of cardiovascular disease in Bangladesh. Environ Health Perspect 2013; 121:832–838
36. Nizam S, Kato M, Yatsuya H, et al. Differ-ences in urinary arsenic metabolites between diabetic and non-diabetic subjects in Bangladesh. Int J Environ Res Public Health 2013;10:1006– 1019
37. Walton FS, Harmon AW, Paul DS, Drobn´a Z, Patel YM, Styblo M. Inhibition of insulin-dependent glucose uptake by trivalent arsenicals: possible mechanism of arsenic-induced diabetes. Toxicol Appl Pharmacol 2004;198:424–433