ADOLESCENT EXPOSURE TO COMMUNITY VIOLENCE AND LATER LIFE C-REACTIVE PROTEIN: TESTING THE MODERATING EFFECT OF RACE ACROSS
LEVELS OF NEIGHBORHOOD POVERTY
Max Reason
A thesis submitted to the faculty at the University of North Carolina at Chapel Hill in partial fulfillment of the requirements for the degree of Masters of Arts in the Sociology Department
Chapel Hill 2016
ii © 2016 Max Reason
iii ABSTRACT
Max Reason: Adolescent Exposure to Community Violence and Later Life C-Reactive Protein: Testing the Moderating Effect of Race Across Levels of Neighborhood Poverty
(Under the direction of Liana Richardson)
Exposure to community violence is an adolescent stressor experienced by a majority of Americans, however the impact this early-life stressor has on adulthood measures of C-Reactive Protein (CRP) is unknown. Additionally, the moderating effect of African American racial status and high-poverty neighborhood residency remains to be explored, as well as the
intersecting interaction of both of these disadvantaged statuses, often mutually experienced in the United States. Using a nationally representative longitudinal dataset, results show that as
iv
AKNOWLEDGEMENTS
I would like to thank my advisor Liana Richardson for her extensive and helpful edits throughout the entire writing process, as well as Kathie Harris and Tony Perez for their assistance in the data and methods section of my thesis. I would additionally like to thank my fellow sociology graduate students who offered me advice and assistance at all stages of the project through informal meetings and academic workshops.
v
TABLE OF CONTENTS
LIST OF TABLES ...vii
LIST OF FIGURES ... viii
Introduction ... 1
Background ... 4
Adolescent Exposure to Community Violence and Adulthood Inflammation ... 4
Moderation by Neighborhood SES ... 6
Moderation by African American Racial Status ... 9
Moderation of the Racial Effect by Neighborhood Poverty ... 12
Data and methods ... 15
Data ... 15
Variables ... 16
Statistical Test ... 24
Results ... 29
Discussion ... 33
Conclusion ... 36
vi
APPENDIX B: List of items used in the creation of control variables
Recent Illness, Recent Infection and Medication Use ... 43
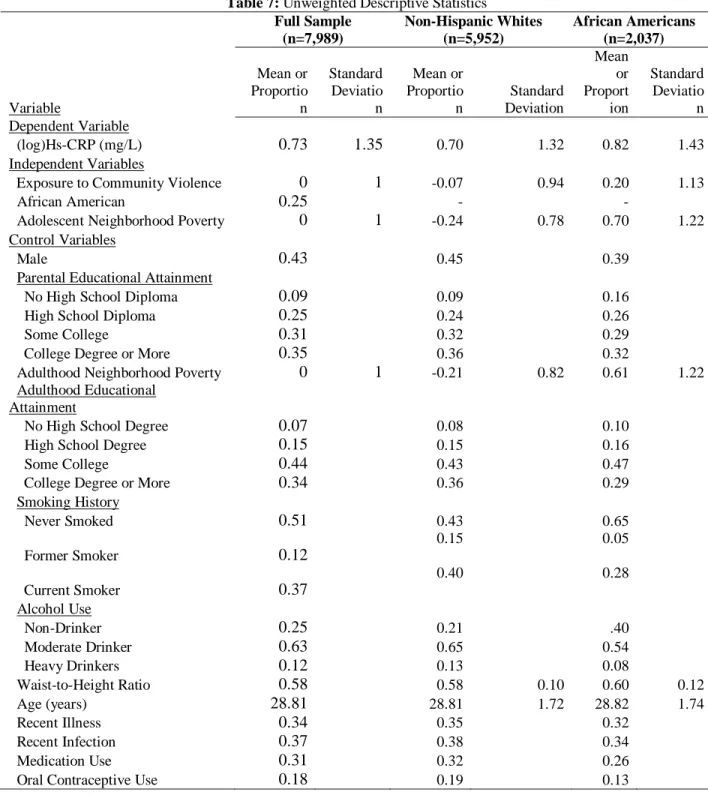
APPENDIX C: Unweighted Descriptive Statistics ... 44
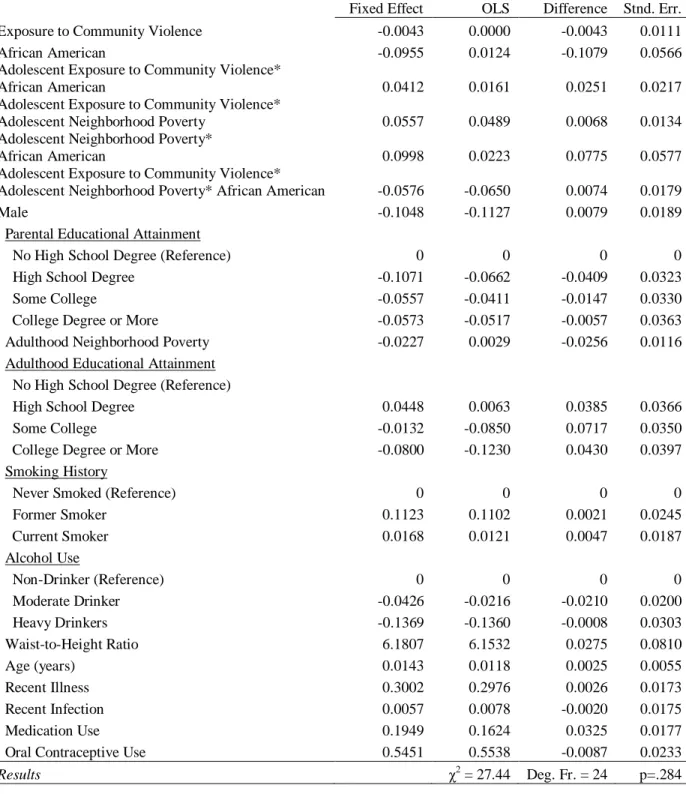
APPENDIX D: Ordinary Least Squared vs. Fixed Effects vs. Random Effects ... 45
vii
LIST OF TABLES
Table 1: Weighted Descriptive Statistics ... 24
Table 2: (log)Hs-CRP regressed on Adolescent Exposure to Community Violence, Race, Adolescent Neighborhood Poverty, Interaction Terms, and Control Variables ... 31
Table 3: “Do you usually feel safe in your neighborhood?” ... 39
Table 4: “Do you feel safe in your school?” ... 40
Table 5: “The last time you were in a physical fight, where did it occur?” ... 41
Table 6: “The last time you were in a physical fight, with whom did you fight?” ... 41
Table 7: Unweighted Descriptive Statistics ... 44
viii
LIST OF FIGURES
1
INTRODUCTION
In the United States, large and persistent health disparities exist between racial and socioeconomic groups, a disturbing phenomenon that has long been documented within the social science literature (Antonovsky 1967, DuBois 1899). Though the processes through which disparities in health develop are complex and multifaceted, researchers have suggested that differential exposure to stress between advantaged and disadvantaged social groups is one of the primary mechanisms through which health disparities are created and are maintained over generations (Thoits 2010). A considerable amount of the more recent research on disadvantage and resulting health disparities has focused on how exposure to stress can lead to population level differentials in inflammation, due to this biomarker’s strong association with many later life
health outcomes, including obesity and insulin resistance (Yudkin et al. 1999), heart attack and stroke (Ridker et al. 1998), coronary heart disease (Danesch et al. 2004) and overall mortality (Harris et al. 1999). Research on stress and health has found that increased levels of stress can lead to increased levels of internal damage and inflammation (Sapolsky 1994) and that youth who experience high levels of stress in early life may suffer from a “programming” of the body
that leads to a more intense internal response to stress, which in turn causes greater harm to the body and higher levels of inflammation when presented with stressors in the future (Miller et al. 2011). For this reason, individuals who experience chronic or acute stress early in the life course are particularly vulnerable to the negative inflammatory outcomes that result from stress
2
Youth within two disadvantaged groups, African Americans and those living in high poverty neighborhoods, are much more likely than non-Hispanic Whites and those in low poverty neighborhoods to experience both chronic, daily stressors, such as economic pressures (Conger et al. 2002) or feelings of insecurity (Nazmi et al. 2010), and more acute traumatic events, from overt discrimination (Lewis et al. 2010) to police harassment (Brunson and Weitzer 2009). Additionally, African Americans are disproportionately represented within high poverty neighborhoods (Sharkey 2013), leading many youth within this racial group to simultaneously experience stressors associated with both inclusion in a minority racial status and an
economically disadvantaged group. In addition to this greater exposure to stress, several studies have found that African American youth and youth living in high poverty neighborhoods have a more intense and prolonged stress reaction when exposed to a laboratory imposed acute stressor (Hackman et al. 2012). This indicates that life course measures of inflammation for individuals within these groups may be higher not only because they are exposed to greater amounts of stress, but also because their internal reaction to stress is elevated.
Within the extant literature on stress and life course health, several early life stressors have been found to be associated with higher rates of inflammation later in life, including
childhood maltreatment (Danese et al. 2009, Coelho et al. 2014), interpersonal violence (Heath et al. 2013), and overt discrimination in women (Cunningham et al. 2012). One early life stressor for which the life course inflammatory outcomes have not been well researched is exposure to community violence, i.e.,“[victimization by or witnessing of] intentional acts of interpersonal violence committed in public areas by individuals who are not intimately related to the victim”
3
physical victimization within their community, while 57.9 percent will witness a violent act (Finkelhor et al. 2013). While the long term health effects of adolescent exposure to community violence have not been investigated, several findings from previous research support further investigation into the impact of community violence exposure on inflammation. For example, in small sample, cross-sectional studies of adolescents, self-reported exposure to community violence was associated with both irregular patterns of diurnal cortisol (Suglia et al. 2010) and higher basal blood pressure and heart rate (Murali and Chen 2005), three negative health outcomes that are indicative of a dysregulated internal stress response, the primary biological mechanism through which stress exposure leads to higher rates of inflammation within the body (Miller et al. 2011). In addition, previous research has noted an association between community violence and psychological health issues, such as depression (Fowler et al. 2009, Chen 2010), and poor health behaviors such as smoking (Brady 2006), both of which are co-morbid with higher levels of inflammation (Copeland et al. 2012, O’Loughlin 2008) and inflammation-related
diseases (Fan et al. 2008, Erhardt 2009). Finally, racial minorities and people living in low-SES neighborhoods are significantly more likely to experience both exposure to community violence (Voisin 2007, Stein et al. 2003) and heightened levels of inflammation (Khera et al. 2005, Ranjit et al. 2007, Broyles et al. 2012), indicating a possible correlation between this type of early life stress and disparities in inflammation later in life.
In order to determine whether early life exposure to community violence may influence disparities in inflammation later in the life course, the current study used longitudinal data on a nationally representative sample of individuals from adolescence into early adulthood and
4
2004). This study had three aims. The first was to identify if exposure to community violence in adolescence (ages 12-17) is associated with CRP in early adulthood (ages 24-32). The second was to use statistical moderation to determine if the effect of adolescent community violence exposure on early adulthood measures of CRP differs between non-Hispanic Whites and African Americans and between those who spent adolescence in high poverty neighborhoods vs. low poverty neighborhoods. Finally, this study investigated if the racial disparity in the effect of exposure to adolescent community violence in determining early adulthood levels of CRP was moderated by adolescent neighborhood SES.
Background
Adolescent Exposure to Community Violence and Adulthood Inflammation
In order to understand how adolescent exposure to community violence may lead to higher levels of inflammation later in the life course, this study draws on the Biological Embedding of Childhood Adversity model (Miller et al. 2011). Posited by Miller and colleagues, the Biological Embedding of Childhood Adversity model theorizes that early life stressors that occur during sensitive periods of early life development have the ability to
biologically “program” the way the body responds to future environmental or social stressors. In
instances of perceived stress, the body activates several internal regulatory mechanisms that are designed to prepare an individual for acute instances of potential danger, two of which are the hypothalamic-pituitary-adrenacortical (HPA) axis and the sympathetic nervous system (SNS). These “fight-or-flight” (Jansen et al. 1995) response mechanisms cause several short-term
5
environmental and social stressors as “threats”, 2) responds to these perceived stressors with a much stronger activation of the HPA-axis and SNS, and 3) is less sensitive to hormonal signals that call for the dissipation of the stress response once the threat has passed. As a result, the authors of the theory posit that the dysregulation of the HPA-axis and the SNS due to this early life “programming” of these stress response systems “fosters a chronic inflammatory state in the body”, an inflammatory state that is associated with higher levels of inflammatory markers (such
as CRP), tissue damage, blood pressure and several other negative later life health outcomes (Miller et al. 2011, Sapolsky 1993).
Exposure to community violence could be one stressor that leads to the activation of the internal stress processes described above, and heightened levels of exposure may lead to the development of an over-active and dysregulated stress response system and a heightened state of inflammation later in the life course. Many of the community violence acts to which one may fall victim, such as being shot, stabbed or jumped, are life threatening in nature, and would therefor elicit activation of the HPA-axis and the SNS. Witnessing a violent event may also have the same effect on an adolescent. Indeed, previous studies have found that heightened levels of past community violence exposure are associated with greater levels of cortisol secretion in the face of a laboratory stressor (Suglia et al. 2010). As a key hormone released in the process of returning the body to homeostasis, measures of cortisol after an exposure to a controlled stressor can be utilized as a measure of stress reactivity and HPA-axis functioning (Miller et al. 2007), and higher rates of cortisol reactivity have been shown to be associated with higher rates of CRP (Nijm et al. 2007).
6
levels of CRP later in life, including childhood maltreatment (Danese et al. 2009, Coelho et al. 2009), interpersonal violence (Heath et al. 2013), and overt discrimination in women
(Cunningham et al. 2012). Given these findings, exposure to community violence may also act as an early life stressor that is associated with higher levels of CRP later in the life course. Hypothesis A: There will be a positive association between levels of exposure to community violence in adolescence and CRP in adulthood.
Moderation by Neighborhood SES
In addition to the effect that adolescent exposure to community violence may have on CRP in early adulthood, the possible moderating effect of social disadvantage also needs to be explored. According to the Biological Embedding of Childhood Adversity model, the stress that results from living in a disadvantaged situation in early life, such as a neighborhood with a high level of poverty, has the ability to elicit chronic, early life activation of the HPA-axis, with known consequences for health into the future. Several social-scientific theories of health have also noted how the stress associated with social disadvantage and adversity can lead to poor health outcomes later in the life course (Geronimus 1991, Perlin 1981, Thoits 2010). However, the Biological Embedding of Childhood Adversity model also states that exposure to a
disadvantaged social situation early in the life course can lead to an alteration of the way in which the body activates the internal stress response in the face of a stressor. Pro-inflammatory programming of the HPA-axis early in life inhibits the regulatory feedback loop that returns the body to a state of homeostasis after experiencing a stressor, leading to a prolonged and
7
chronic stress resulting from a disadvantaged neighborhood environment, exposure to this stressor could result in a longer, more detrimental activation of the HPA-axis. Indeed, research has shown that neighborhood disadvantage is associated with a more intense cortisol reaction in adolescents exposed to a laboratory based stressor (Hackman et al. 2012), indicating that this same population would elicit more intense stress reactivity in the face of an acute stressor such as exposure to community violence.
Within high poverty neighborhoods, children and adolescents face several stressors at a much higher rate than their peers in more well-off neighborhoods that may increase their stress reactivity when exposed to community violence. Youth in high poverty neighborhoods often feel less safe within them (Popkin et al. 2010) and parents will often use this fear of the
neighborhood to limit the amount of interaction children and adolescents have with members of their neighborhood (Kimbro and Schachter 2011). In addition to anxiety over one’s safety,
residents of high poverty neighborhoods also report higher levels of depression (Galea et al. 2007) and suicidal thoughts (Dupere et al. 2009), both of which are associated with greater cortisol reactivity (Burke et al. 2005, O’Connor et al. 2016). Finally, youth living in high
poverty neighborhoods are more likely to experience community violence in the first place (Buka et al. 2001, Stein et al. 2003). This early exposure to community violence may increase the stress reactivity of individuals who experience similar forms of violence later in the life course, and indeed, research has shown that self-reported community violence exposure is indicative of a higher cortisol reaction in the presence of a laboratory induced stressor (Suglia et al. 2010)
8
exposed to community violence. Within high poverty neighborhoods, access to healthy food is often limited, with many of these neighborhoods being classified as “food deserts” where
grocery stores with fresh fruits and vegetables are non-existent (Walker et al. 2010). In these neighborhoods, a majority of residents must shop for food at convenience stores or cornershops that sell mostly “junk” food high in sugars and fats, the cheapest and most available nutrition (Drewnowski and Darmon 2005), or fast-food chains, which are more widely available in neighborhoods with a high percentage of households in poverty (Smoyer-Tomic et al. 2008). High poverty neighborhoods also often lack safe public spaces in which to play (Charles 2003), an important form of exercise for children and adolescents (McCurdy et al. 2010), and the walkability of these neighborhoods is often poor (Booth et al. 2005). As a result of these phenomena, rates of overweight and obesity are higher in high poverty neighborhoods (Janssen et al. 2006, Black and Macinko 2008, Booth et al. 2005). This association between high poverty neighborhoods and obesity could have repercussions for the effect of adolescent community violence exposure on later levels of inflammation; in a meta-analysis of the extant literature, Rodriguez et al. (2015) found that most studies reported abdominal fat and obesity to be positively associated with measures of stress reactivity.
Exposure to heightened levels of environmental toxins is another means by which growing up in a high poverty neighborhood might increase the effect of exposure to community violence on stress reactivity, outside of direct exposure to perceived stressors. Because of
9
particles and oxides of nitrogen increased (Hajat et al. 2013). Important measures of air quality, both of these pollutants are found to increase several measures of inflammation within the body (Hajat et al. 2015, Pope III et al. 2004), and some evidence exists to support that this increase in inflammation is due to activation of the HPA-axis in response to these air-born pollutants (Sirivelu et al. 2006). In line with the Biological Embedding of Childhood Adversity Model, consistent activation of the HPA-axis in response to air pollution could compromise this internal stress mechanism early in the life course, leading to a heightened stress reactivity in the presence of a later stressor, such as community violence. Indeed, research has found that the link between stress and health is more pronounced in residents who live in neighborhoods near hazardous waste facilities (Matthews and Wang 2010).
Moderation by African American Racial Status
10
(Zeiders et al. 2014), leading to increased stress reactivity in response to community violence events experienced in adolescence.
For many in this racial group, the disadvantage can begin even before birth. Stress experienced by mothers throughout the life course as a result of racial discrimination can be detrimental to the health of their children later in the life course by negatively impacting birth outcomes (Geronimus 1992). Children born to African American women are twice as likely to be born low birth weight (Martin et al. 2015) and this relationship between race and birth weight has been found to transcend socioeconomic status, with college educated mothers more likely to give birth to a low-birth weight child than even the least educated non-Hispanic White mothers (Mustillo et al. 2004). It has been well established that the experiences of an individual during the fetal stages of development can have lifelong impacts on health (Barker et al. 2002,
Richardson et al. 2012). Being born low birth weight has been shown to be associated with myriad diseases later in the life course (White et al. 2009), including hyperactivity of the HPA-axis as measured by increased cortisol reactivity (Clark 1998, Ward et al. 2004). Prenatal pro-inflammatory programing of the HPA-axis could potentially act as a mechanism through which African Americans experience higher levels of inflammation later in life.
After being born, African Americans are often exposed to discrimination stress and many adolescents in this racial group report overt experiences of discrimination during daily
11
adolescents (a group that experiences discriminatory stress at levels similar to African Americans (Rosenbloom and Way 2004)), higher levels of perceived discrimination were associated with stronger cortisol reactivity (Zeiders et al. 2012). However, in a sample of middle-aged non-Hispanic Whites and African Americans, Fuller-Rowell et al. (2012) determined that for African Americans, higher self-reported instances of discrimination were associated with a steeper, or more healthy diurnal cortisol slope, indicating that perceived discrimination was associated with a less extreme stress-response for this population. The authors do note, however, that this relationship may not be seen in younger African Americans, who are just beginning to adopt their racial identity during this sensitive period of development. If discriminatory stress experienced in childhood and adolescence can lead to an increased stress response and dysregulation of the HPA-axis later in life, African Americans would be more negatively impacted by other experienced stressors, including community violence, leading to a greater effect of these stressors in determining later life levels of CRP.
Finally, African Americans are more likely to be the victims of multiple forms of violence in the first two decades of the life course. For instance, exposure to community violence is more prevalent among African Americans (Voisin 2007, Aisenberg and Herrenkohl 2008), and though death is a rare outcome of violence exposure, homicide rates are around six times higher for African Americans than for non-Hispanic Whites. In fact, for African
Americans between 15 and 29, it is the leading cause of death (CDC 2014). Due to the heavier burden that members of this race face when it comes to violence exposure, rates of
12
among U.S. adolescents are much higher for African Americans than for non-Hispanic Whites (12.8 percent vs. 7.7 percent) (Finkelhor et al. 2011). Past exposure to violence is known to increase the level of stress reactivity in the face of subsequent stressors (Suglia et al. 2010, Aiyer et al. 2014). This could lead to higher levels of later life CRP among African Americans
compared to other groups.
Hypothesis 2: The positive association between adolescent exposure to community violence and
early adulthood CRP will be moderated by both race and neighborhood poverty in such a way
that the magnitude of this effect will be greater for people who spent their adolescence in high
poverty neighborhoods and for African-Americans.
Moderation of the Racial Effect by Neighborhood Poverty
13
(Sharkey 2013). This relationship also transcends individual level SES, with half of all middle- and upper-class African Americans living in neighborhoods with greater than twenty percent poverty (Sharkey 2013). And, while there are plenty of whites experiencing poverty at the individual and household level in the United States, many are able to live in middle- and high-SES neighborhoods as a result of their white racial status, causing the disadvantage of low neighborhood SES to be a burden felt mostly by African Americans (Reardon et al. 2015). Finally, this relationship is persistent across generations, as a majority of the African American youth who grow up in these disadvantaged neighborhoods remain in them throughout the life course, leading to an “inheritance of the ghetto” for this population across time (Sharkey 2013, p.
45).
The strong association between African American racial status and high neighborhood poverty may have implications for the relationship between exposure to community violence and CRP. According to the social vulnerability hypothesis (Pampel and Rogers 2004), people who experience the highest levels of socioeconomic disadvantage will be the most adversely affected by the factors that can deteriorate health, and that the gap in health between those who
experience these negative health factors and those that do not will grow as socioeconomic
14
neighborhood disadvantage increased, the likelihood of being a current drinker increased for African Americans relative to non-Hispanic Whites, and that among those who consume alcohol, the gap in the amount consumed when binge drinking increased between non-Hispanic Whites and African Americans. However, some research has found evidence contrary to the premise of the social vulnerability hypothesis. In a study looking at pregnancy outcomes for White and African American teenage mothers, Coley et al. (2015) found that the racial gap in rates of preterm birth was greatest in the most affluent neighborhoods, and in an investigation of the intersecting effect of race and neighborhood poverty on allostatic load, Bird et al. (2010) found that while allostatic load had a positive relationship with neighborhood poverty, the strength of this relationship did not vary by race.
While these studies have produced mixed findings on the relationship between race and neighborhood poverty in determining a given health outcome, in the one study investigating the effect of stress within a framework of social vulnerability, Kruger and Chang (2008) found that former smoking status increased the effect of stress on predicting mortality, but only among those at the lowest levels of socioeconomic status. Within higher SES groups, they found no difference in the effect of stress on mortality between those who did and did not formerly smoke. While Kruger and Chang did not mention this in their study, previous research has found
15
White counterparts. This would lead to a widening of the gap in the effect of adolescent exposure to community violence on early adulthood CRP as adolescent neighborhood poverty rates increase between African Americans and non-Hispanic Whites.
Hypothesis 3: As exposure to adolescent community violence increases, so too will measures of
early adulthood CRP, but the gap in the effect of community violence on CRP levels between
African Americans and non-Hispanic Whites will widen as levels of adolescent neighborhood
poverty increase.
Data and methods
Data
Data for this study come from the National Longitudinal Study of Adolescent to Adult Health (Add Health) (Harris 2009). To date, Add Health has carried out four waves of data collection on a nationally representative sample of Americans through in-home surveys,
collecting information on the health and health correlates of individuals from the sensitive period of adolescence up through early adulthood. My study will utilize the first and fourth waves. The first wave was conducted during the 1994-1995 school year when respondents were in the
seventh through twelfth grades. It was also at this wave that a short questionnaire was
16
are indicative of disease and disease risk. Additional anthropometric and cardiovascular measures were also collected at this wave.
For the final analytic sample, 11,065 respondents had both measures of CRP and the proper sampling weights to account for Add Health’s complex survey design. Because the current study focuses on health differentials between non-Hispanic Whites and African Americans, those who did not report membership in one of these two racial groups were excluded (n=2,404). Finally, all those without measures for any of the independent variables were excluded (n=672), around 6.1 percent of the eligible sample. Most excluded for this reason were missing neighborhood contextual data. The final analytic sample included 7,989
respondents. Variables
C-Reactive Protein: HsCRP was collected through blood spots taken during the in-home
interview and is measured in mg/L of blood. CRP has been found to be a strong measure of later life heart disease morbidity (Danesh et al. 2004), and previous research has described the proper method in which to collect and analyze hsCRP measures obtained through blood spot collection (McDade 2004). This method was utilized in the Add Health sample and additional information regarding the collection and processing of hsCRP in Add Health can be found elsewhere
(Whitsel et al. 2012). Reliability of these biomarker measures at Wave IV was found to be good (Whitsel et al. 2012). The final CRP variable was transformed with a log10 transformation to account for the strong right skew that exists in the data.
17
items that represented this sort of experience are utilized. All community violence items were prefaced with the phrase “During the past twelve months, how often did each of the following
things happen”, to which respondents replied “0-Never”, “1-Once”, and “2-Twice or more”. The six items were “You saw someone shoot or stab another person”, “Someone pulled a knife or gun on you”, “Someone shot you”, “Someone cut or stabbed you”, “You got into a physical
fight”, and “You were jumped”.
Much of the previous research investigating community violence has utilized scales that were created by simply summing the number of violence events that a person has experienced, or by creating dummy variables in which respondents were coded as ever having experienced that form of community violence before summing all of the 0/1 responses in order to create a final scale. One major assumption when creating a scale of community violence that simply sums the number of community violence events experienced by each individual is that all forms of this violence exposure are equally harmful, and in turn will have the same effect on the outcome variable being studied. Several authors have noted this assumption could be potentially
problematic, as certain instances of exposures to community violence are more severe, and will likely have a much greater impact on the individual (Suglia et al. 2008, Trickett et al. 2003, Overstreet 2000). In order to correct for this problematic assumption, all non-zero responses for each community violence item were weighted by the inverse of the probability that the event was experienced by the analytic sample the number of times it was experienced (“once” or “twice or
more”). All zero responses were given a value of zero. The weighting of these items can be shown in the following two equations:
18
where 𝑠𝑖𝑗 is a score 𝑠, given to respondent i for community violence item j, 𝑃𝑗𝑘 is the probability
that community violence item j was experienced k number of times in the analytic sample, and 𝑘̂𝑖𝑗 is the observed number of times respondent i reported they had experienced community
violence event j. After the items were weighted, all community violence items were summed for each respondent (α=.7). Scores were then normalized with a mean of zero and standard
deviation of one, with higher scores representing greater exposure to community violence in adolescence. Normalization helps to account for the strong right skew in the distribution of exposure to community violence within the analytic sample and previous research using these items in Add Health has utilized this tactic (Harding 2009).
19
However, one assumption of using these inverse probability weights is that the severity of each community violence event is equal to the inverse of the probability that a respondent would experience it the number of times in which he or she did. Additionally, because the wording of the items used to create the Exposure to Community Violence Scale do not ask the respondent to specify the perpetrator of the violence, it is nearly impossible to determine if the violence experienced by the respondents was carried out by strangers, individuals known to the
respondent, friends of the respondent, siblings, or even parents. This makes it difficult to ensure the constructed measure of exposure to community violence exactly matches the conceptual definition, particularly as it pertains to the idea that this form of violence is perpetrated by individuals who “are not intimately related to the victim”. Additional tests were carried out to establish that the created Exposure to Community Violence measure was not in fact measuring other forms of violence often experienced by adolescents. Results from these tests can be found in the Appendix A.
Race: To indicate a respondent’s race, a dummy variable was created in which all Whites who did not report Hispanic ethnicity were coded as zero (0) and all those who reported being Black or African American with no Hispanic ethnicity were coded one (1).
Adolescent Neighborhood Poverty: To measure overall neighborhood poverty during
adolescence, an index was created using principal components analysis (Jolliffe 2002) on three block-group level variables at Wave I: proportion of households below the 1989 poverty level, proportion of residents over age 19 without employment, and proportion of residents over age 25 without a high school degree. Previous research has noted that the variables of income,
employment status and education to compose the core of “socioeconomic status” (Cowen et al.
20
75.31 percent of the variance between these three items, with all three items having factor
loading scores ≥.85. The final Adolescent Neighborhood Poverty factor variablewas normalized
with a mean equal to zero and a standard deviation of one, in which higher scores are indicative of higher neighborhood poverty.
Interaction Terms: In order to test the potential moderating effect of race and neighborhood poverty on the relationship between adolescent community violence and early adulthood measures of CRP, two interaction terms were created. The first variable, for testing the moderating effect of race, was created by taking the product of each respondent’s Exposure to Community Violence Scale score and what they were coded on the race variable. The second variable, testing the moderating power of adolescent neighborhood poverty in this relationship, was created by taking the product of each respondent’s Adolescent Neighborhood Poverty score
and their Exposure to Community Violence score. To investigate racial differences in the effect of community violence on CRP outcomes across levels of neighborhood poverty, a three-way interaction term was created that was the product of each respondent’s Exposure to Community
Violence Scale score, their Adolescent Neighborhood Poverty score, and their race dummy variable. Additionally, because models utilizing three-way interaction terms require that every derivation of possible two-way interaction terms is included (Dawson and Richter 2006), an interaction term of each respondent’s Adolescent Neighborhood Poverty score and race dummy was also created.
Control Variables: Biological sex of the respondent was recorded at the Wave I interview and a 0/1 dummy variable was created to indicate whether the respondent is a female (0) or a male (1). Educational attainment of the the sample respondents’ parents was chosen as an indicator of
21
health outcomes than income in the United States (Schnittker 2004). If information on
educational attainment was only available for one parent or guardian, that information was used. If an adolescent in the analytic sample had educational attainment for both parents or guardians, the higher of the two was used. In instances where the adolescent does not have data for the parent questionnaire (~15 percent of the Wave I sample), the highest education level of either the adolescent’s resident mother or father, as reported by the adolescent respondent during the Wave
I in-home interview, was utilized. The final Parental Education variable is coded as “0= No High School Diploma, 1= High School Diploma, 2= Some College, 3= College Degree or More”.
In addition to adolescent measures of SES, measures of adult SES were also included, as measure of inflammation may be affected by contemporary experiences of disadvantage (Link and Phelan 1995, Phelan et al. 2010). For individual level adult SES, educational attainment at Wave IV was used, with the categories of education being the same as they were in the Parental Education variable. Additionally, a measure of neighborhood SES at Wave IV was created using similar items to those used in the Adolescent Neighborhood poverty variable (proportion of population below the poverty level in the last 12 months, proportion of persons 16 and over
unemployed, and proportion 25 years and over with less than a high school diploma). However, at Wave IV, linked census data on these items are not available at the block-groups level, so the scale of neighborhood SES in adulthood was derived from measures at the census-tract level. The assumed impact of using census-tract level measures is that scores of a respondents
22
difference between most metrics measured at the block-group verses the census-tract level is usually small (Iceland and Steinmetz 2003).
In addition to SES, several other control variables from the fourth wave of data collection were included in the models. Smoking history and past year alcohol consumption were included as controls, due to their ability to impact rates of CRP in adulthood (O’Connor et al. 2009). Smoking was coded into a three category variable as “0=Never Smoked” “1=Former Smoker” “2=Current Smoker”, with former smoker including respondents who report ever smoking
cigarettes every day for a month, but did not report any cigarette usage in the last month. This is in line with research that found CRP levels to be higher in former smokers that those who never smoked, with current smokers faring the worse on this measure of inflammation (Wannamethee et al., 2007). Alcohol was coded as a three category variable in which respondents were
categorized as non-drinkers, moderate drinkers, and heavy drinkers, following research that has found a U-shaped relationship between alcohol consumption and CRP, with moderate drinkers reporting lower levels than non-drinkers or heavy drinkers (Pai et al. 2006). Moderate drinkers were defined as those who reported drinking alcohol in the last year, but less than three days a week.
Finally, additional Wave IV controls were added for the factors that have the ability impact CRP at a biological level (O’Connor et al. 2009). As a measure of adiposity,
23
weeks, they were coded as a “1” in the dichotomous variable Recent Illness. If respondents
reported that they had an infection or more persistent disease that has been shown to affect measures of CRP, they were coded as a “1” in the control variable Recent Infection. Reported
use of any medications that may influence CRP outcomes was also controlled for by flagging current medication users in the variable Medication Use. An additional variable was created to capture if the respondent was currently using oral contraceptives. Information on which
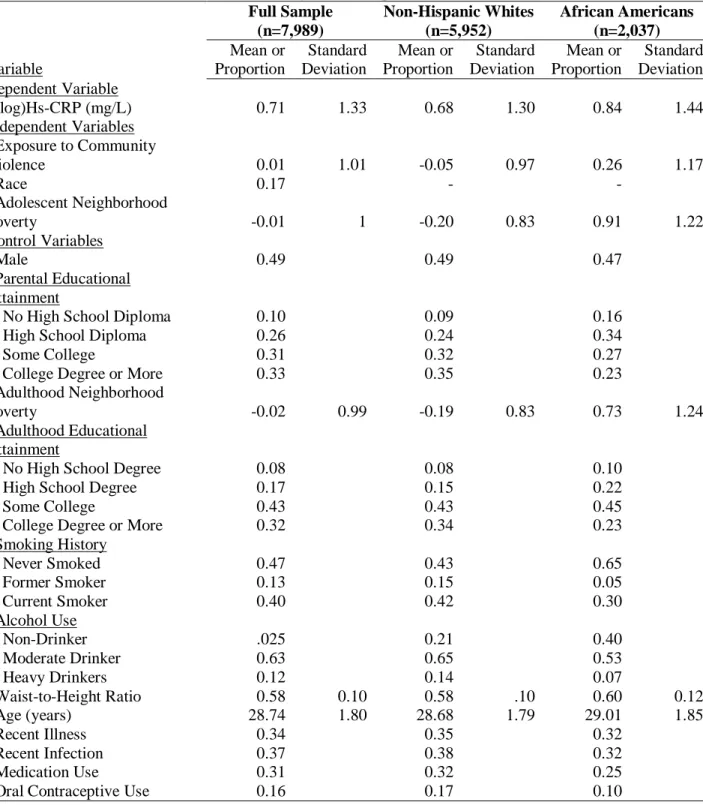
illnesses, infections, and medications were used in the creation of the CRP control variables, can be found in the Appendix B. Weighted descriptive statistics can be found in Table 1.
24
Table 1: Weighted Descriptive Statistics Full Sample (n=7,989) Non-Hispanic Whites (n=5,952) African Americans (n=2,037) Variable Mean or Proportion Standard Deviation Mean or Proportion Standard Deviation Mean or Proportion Standard Deviation Dependent Variable
(log)Hs-CRP (mg/L) 0.71 1.33 0.68 1.30 0.84 1.44
Independent Variables
Exposure to Community
Violence 0.01 1.01 -0.05 0.97 0.26 1.17
Race 0.17 - -
Adolescent Neighborhood
Poverty -0.01 1 -0.20 0.83 0.91 1.22
Control Variables
Male 0.49 0.49 0.47
Parental Educational Attainment
No High School Diploma 0.10 0.09 0.16
High School Diploma 0.26 0.24 0.34
Some College 0.31 0.32 0.27
College Degree or More 0.33 0.35 0.23
Adulthood Neighborhood
Poverty -0.02 0.99 -0.19 0.83 0.73 1.24
Adulthood Educational Attainment
No High School Degree 0.08 0.08 0.10
High School Degree 0.17 0.15 0.22
Some College 0.43 0.43 0.45
College Degree or More 0.32 0.34 0.23
Smoking History
Never Smoked 0.47 0.43 0.65
Former Smoker 0.13 0.15 0.05
Current Smoker 0.40 0.42 0.30
Alcohol Use
Non-Drinker .025 0.21 0.40
Moderate Drinker 0.63 0.65 0.53
Heavy Drinkers 0.12 0.14 0.07
Waist-to-Height Ratio 0.58 0.10 0.58 .10 0.60 0.12
Age (years) 28.74 1.80 28.68 1.79 29.01 1.85
Recent Illness 0.34 0.35 0.32
Recent Infection 0.37 0.38 0.32
Medication Use 0.31 0.32 0.25
25 Statistical Tests
In order to test the effect of adolescent exposure to community violence on the
continuous measure of early adulthood levels of CRP, as well as to investigate the hypothesized moderating power of race, neighborhood poverty, and the combination of both in this
relationship, Ordinary Least Squared (OLS) regression was utilized.
In Model 1, the bivariate model of the log of each respondent’s hs-CRP measure was regressed on their Exposure to Community Violence Scale (ECV) score. The equation for the model is as follows:
log ℎ𝑠 − 𝐶𝑅𝑃̂ 𝑖 = 𝛽0+ 𝛽1(𝐸𝐶𝑉𝑖) + 𝑒𝑖
Where log ℎ𝑠 − 𝐶𝑅𝑃̂ 𝑖 is the estimated logged value of hs-CRP based on the model, 𝛽0 is the intercept for all respondents, and 𝛽1 is the estimated coefficient of the effect of exposure to
community violence on early adulthood CRP. The final term, 𝑒𝑖, represents the error term for
each individual in the model, i.e. the value of each individuals residual.
In Model 2, control variables were added to the bivariate model. For efficiency sake, the equation has been shortened so that all beta coefficients for each control variable are represented by the term 𝛽𝑥−𝑁(𝐶𝑜𝑛𝑡𝑟𝑜𝑙𝑠𝑖). Controls remained in all subsequent models.
log ℎ𝑠 − 𝐶𝑅𝑃̂ 𝑖 = 𝛽0+ 𝛽1(𝐸𝐶𝑉𝑖) + 𝛽2−𝑁(𝐶𝑜𝑛𝑡𝑟𝑜𝑙𝑠𝑖) + 𝑒𝑖
In Model 3, the focal independent variables of African American (AA) and Adolescent Neighborhood Poverty (ANP) were added into the model, leading to a regression equation of
log ℎ𝑠 − 𝐶𝑅𝑃̂ 𝑖 = 𝛽0 + 𝛽1(𝐸𝐶𝑉𝑖) + 𝛽2(𝐴𝐴𝑖) + 𝛽3(𝐴𝑁𝑃𝑖) + 𝛽4−𝑁(𝐶𝑜𝑛𝑡𝑟𝑜𝑙𝑠𝑖) + 𝑒𝑖
in which 𝛽2 is the coefficient estimate for the effect of being an African American on hs-CRP net of all other variables, and 𝛽3 is the estimated effect of adolescent neighborhood poverty. For all
26
In Model 4, two-way interaction terms were included in the models in order to test for the theorized moderating effect of race (AA) and adolescent neighborhood poverty (ANP) in the relationship between adolescent community violence and early adulthood CRP. For this model, the regression equation is,
log ℎ𝑠 − 𝐶𝑅𝑃̂ 𝑖 = 𝛽0+ 𝛽1(𝐸𝐶𝑉𝑖) + 𝛽2(𝐴𝐴𝑖) + 𝛽3(𝐴𝑁𝑃𝑖) + 𝛽4(𝐸𝐶𝑉𝑖 ∗ 𝐴𝐴𝑖) + 𝛽5(𝐸𝐶𝑉𝑖∗
𝐴𝑁𝑃𝑖) + 𝛽6(𝐴𝑁𝑃𝑖∗ 𝐴𝐴𝑖) + 𝛽7−𝑁(𝐶𝑜𝑛𝑡𝑟𝑜𝑙𝑠𝑖) + 𝑒𝑖
where 𝛽4− 𝛽6 are coefficient estimates of the change in the effect of a focal independent
variable based on the value of another focal independent variable. Inclusion of these interactions also changes the interpretation of the base focal variables from which they are derived. For example, interpretation of 𝛽1 is no longer the estimated effect of adolescent exposure to
community violence on early adulthood CRP, but it is now the effect of exposure to community violence for an individual who is coded as a “0” for both the African American and Adolescent
Neighborhood Poverty variables, i.e., a non-Hispanic White who experienced adolescence in a neighborhood with the mean level of neighborhood poverty. This is because the total effect of exposure to community violence is no longer 𝛽1, but is now 𝛽1+ 𝛽4 + 𝛽5, or all of the terms in
which a value for exposure to community violence is included. In this example, a non-Hispanic White who spent adolescence in a neighborhood with the mean level of poverty would have a value of “0” for both African American and Adolescent Neighborhood Poverty, which in turn means 𝛽4 ⇒ 0 and 𝛽5 ⇒ 0, causing them to drop out of the model and leading to an effect equal
to 𝛽1. However, for an African American within the sample, the value of African American = 1, thus, 𝛽4 ≠ 0 and the total effect of adolescent exposure to community violence equals 𝛽1+ 𝛽4
(assuming a value of “0” for Neighborhood Adolescent Poverty and a coefficient 𝛽4 ≠ 0). This
27
terms allows for differing slope estimates for the effect of community violence exposure as a function of both race and neighborhood poverty level.
In model, Model 5, a three-way interaction term between Adolescent Exposure to
Community Violence, African American, and Adolescent Neighborhood Poverty was added to the model to test if the hypothesized racial difference in the effect of adolescent exposure to
community violence on early adulthood CRP was moderated by levels of neighborhood poverty.
log ℎ𝑠 − 𝐶𝑅𝑃̂ 𝑖 = 𝛽0+ 𝛽1(𝐸𝐶𝑉𝑖) + 𝛽2(𝐴𝐴𝑖) + 𝛽3(𝐴𝑁𝑃𝑖) + 𝛽4(𝐸𝐶𝑉𝑖 ∗ 𝐴𝐴𝑖) +
𝛽5(𝐸𝐶𝑉𝑖 ∗ 𝐴𝑁𝑃𝑖) + 𝛽6(𝐴𝑁𝑃𝑖∗ 𝐴𝐴𝑖) + 𝛽7(𝐸𝐶𝑉𝑖 ∗ 𝐴𝑁𝑃𝑖 ∗ 𝐴𝐴𝑖) + 𝛽8−𝑁(𝐶𝑜𝑛𝑡𝑟𝑜𝑙𝑠𝑖) + 𝑒𝑖
In this final regression equation, the inclusion of the three-way interaction term adds an
additional layer of complexity to the interpretation of the other focal independent variable terms, however the logic is still the same as in the previous equation (Model 4). As in the previous example, the total effect of adolescent exposure to community violence on early adulthood CRP is the sum of all the terms that include a value for the AdolescentExposure to Community Violence Scale, thus, the total effect of community violence exposure is 𝛽1+ 𝛽4+ 𝛽5+ 𝛽7. In the case of the non-Hispanic White adolescent exposed to the mean level of adolescent
neighborhood poverty, 𝛽4 ⇒ 0, 𝛽5 ⇒ 0, and 𝛽7 ⇒ 0, and the effect of community violence
exposure is only 𝛽1 (assuming a 𝛽1 coefficient ≠ 0). Similarly, for an African American who
spent adolescence in a neighborhood with the mean level of neighborhood poverty, the total effect of adolescent exposure to community violence would be 𝛽1+ 𝛽4, as their value for
28
and 𝛽7 would not zero out, and assuming that none of these β coefficients equal zero, the
estimated effect of exposure to community violence for this individual would be 𝛽1 + 𝛽4+ 𝛽5+
𝛽7.
Though the interpretation for a three-way interaction can quickly become complex, especially when dealing with continuous variables, inclusion of these terms allows me to investigate the effect of neighborhood poverty in moderating the racial effect of adolescent exposure to community violence on early adulthood measures of CRP, an effect that would not be seen by simply including interaction terms that are the product of community violence exposure and the focal disadvantaged social groups.
OLS vs. Fixed Effects vs. Random Effects
Because Add Health was collected at Wave I using a complex, school based sampling method consisting of 132 middle and high schools, many respondents naturally lived in the same census block-groups, the unit of aggregation being used to define neighborhoods in the current study. On average, the number of respondents per block-group was 3.5 (min=1, max=90). Because of the possible unobserved factors within a specific neighborhood that might have an effect on either the dependent or independent variables within the sample, typically, OLS would be called into question and use of a more consistent (but less efficient) model may be necessary. Due to this concern, models with both fixed and random neighborhood effects were run and established statistical hypothesis tests were carried out in order to compare coefficients between these more consistent models, and the more efficient OLS model. Ultimately, these tests did not show that the parameter estimates of the OLS equations were statistically different from the other more fixed and random effect methods of estimation. For this reason, and due to the
29
test of OLS was chosen as the regression method in the current study. A full breakdown of the hypothesis tests can be found in the Appendix C.
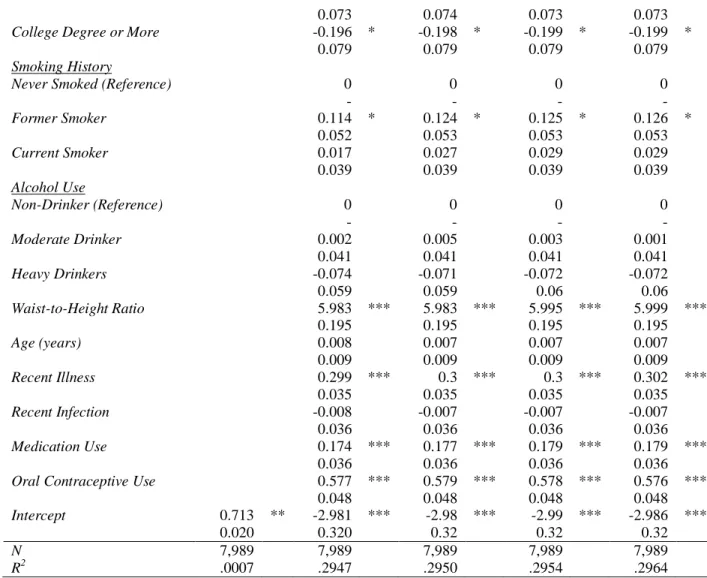
Results
Results from the five regression equations can been found in Table 2. All regressions feature census block-group cluster robust standard errors and proper sampling weights to account for Add Health’s complex survey design.
In Model 1, the bivariate regression of CRP on adolescent exposure to community violence, a significant, negative effect was found. Using the formula 100(𝑒𝛽− 1) in order to
state the coefficients as percent changes due to one unit increases in the independent variables, it can be seen that one standard deviation increase in the amount of community violence
experienced in adolescence was associated with a 3.56 percent decrease in the level of CRP in early adulthood. With the inclusion of the control variables in Model 2 however, this association became non-significant. In Model 3, African American and Adolescent Neighborhood Poverty were added to the model. The effects for both were significant, however the signs were different, with African American racial status being associated with a 7.14 percent increase in CRP, while a one standard deviation increase in adolescent neighborhood poverty was associated with a 0.8 percent decrease in early adulthood CRP. In Model 4, inclusion of the three two-way interaction terms led to a slight attenuation of the effect of African American and increased the magnitude of Adolescent Neighborhood Poverty. The signs for both remained the same as in Model 3. None of the two-way interactions were found to be significant. Finally, in Model 5,
30
both African American and Adolescent Exposure to Community Violence, and the positive effect of the interaction term between adolescent exposure to community violence and neighborhood poverty became significant.
31
Table 2: (log)Hs-CRP regressed on Adolescent Exposure to Community Violence, Race, Adolescent Neighborhood Poverty, Interaction Terms, and Control Variables
Model 1 Model 2 Model 3 Model 4 Model 5
β/SE β/SE β/SE β/SE β/SE
Adolescent Exposure to
Community Violence -0.035 * 0.003 0.001 -0.006 -0.006
0.018 0.016 0.016 0.019 0.019
African American
0.069 * 0.060 * 0.049
0.048 0.049 0.048
Adolescent Neighborhood Poverty
-0.008 ** -0.014 ** -0.015
0.02 0.025 0.025
Adolescent Exposure to Community Violence* African American
0.007 0.054
0.042 0.044
Adolescent Exposure to Community Violence* Adolescent Neighborhood Poverty
0.024 0.054 ***
0.015 0.02
Adolescent Neighborhood Poverty*African American
0.014 0.029
0.04 0.04
Adolescent Exposure to Community Violence* Adolescent Neighborhood Poverty* African American
-0.087 ***
0.033
Male -0.153 *** -0.151 *** -0.149 *** -0.15 ***
0.039 0.039 0.039 0.039
Parental Educational
Attainment
No High School Diploma
(Reference) 0 0 0 0
- - - -
High School Diploma
-0.056 -0.057 -0.059 -0.06
0.068 0.068 0.068 0.068
Some College
-0.051 -0.051 -0.053 -0.053
0.069 0.068 0.069 0.069
College Degree or More
-0.051 -0.052 -0.057 -0.057
0.070 0.069 0.07 0.07
Adulthood Neighborhood
Poverty 0.023 0.017 0.018 0.019
0.019 0.02 0.02 0.02
Adulthood Educational
Attainment
No High School Diploma
(Reference) 0 0 0 0
- - - -
High School Diploma
-0.064 -0.066 -0.065 -0.064
0.082 0.082 0.082 0.082
Some College
32
0.073 0.074 0.073 0.073
College Degree or More
-0.196 * -0.198 * -0.199 * -0.199 *
0.079 0.079 0.079 0.079
Smoking History
Never Smoked (Reference)
0 0 0 0
- - - -
Former Smoker
0.114 * 0.124 * 0.125 * 0.126 *
0.052 0.053 0.053 0.053
Current Smoker
0.017 0.027 0.029 0.029
0.039 0.039 0.039 0.039
Alcohol Use
Non-Drinker (Reference)
0 0 0 0
- - - -
Moderate Drinker
0.002 0.005 0.003 0.001
0.041 0.041 0.041 0.041
Heavy Drinkers
-0.074 -0.071 -0.072 -0.072
0.059 0.059 0.06 0.06
Waist-to-Height Ratio
5.983 *** 5.983 *** 5.995 *** 5.999 ***
0.195 0.195 0.195 0.195
Age (years)
0.008 0.007 0.007 0.007
0.009 0.009 0.009 0.009
Recent Illness
0.299 *** 0.3 *** 0.3 *** 0.302 ***
0.035 0.035 0.035 0.035
Recent Infection
-0.008 -0.007 -0.007 -0.007
0.036 0.036 0.036 0.036
Medication Use
0.174 *** 0.177 *** 0.179 *** 0.179 ***
0.036 0.036 0.036 0.036
Oral Contraceptive Use
0.577 *** 0.579 *** 0.578 *** 0.576 ***
0.048 0.048 0.048 0.048
Intercept 0.713 ** -2.981 *** -2.98 *** -2.99 *** -2.986 ***
0.020 0.320 0.32 0.32 0.32
N 7,989 7,989 7,989 7,989 7,989
R2 .0007 .2947 .2950 .2954 .2964
Figure 1 shows a graph of the final regression equation. The green and blue lines
33
both non-Hispanic Whites and African Americans at two standard deviations of poverty above the mean compared to those in the same race living in poverty one standard deviation above the mean, though with different signs between the races.
Discussion
The current study was aimed at investigating the effect of exposure to community violence in adolescence on later life levels of CRP, a measure of health that is known to be predictive of later life disease morbidity and mortality, and for which the association with other stressors has been well established. In addition, this study investigated whether the stressors and disadvantages inherent to being an African American and growing up in a high poverty
neighborhood moderate the effect of exposure to community violence on CRP, and how their intersection alters this effect. To my knowledge, this is the first study that has looked at how the
-3
.4
-3
.2
-3
-2
.8
-2
.6
-2
.4
lo
g
C
R
P
0 2 4 6
ECV
Af. Am., +2 std.dev/pov erty White, +2 s td.dev/poverty Af. Am., +1 std.dev/pov erty White, +1 s td.dev/poverty
34
impact of race on determining the magnitude of the effect of a stressor on inflammation may vary at different levels of neighborhood poverty.
The first hypothesis, that increasing levels of community violence exposure in
adolescence will be associated with higher levels of CRP among all adolescents in the sample, was not supported by the findings. In the bivariate model, the association was significant, though negative, indicating lower levels of early adulthood CRP as a result of increasing adolescent exposure to community violence. However, this association was highly attenuated after inclusion of the controls and became non-significant. This is most likely because male gender, one of the control variables, is highly associated with both exposure to community violence and CRP, but in the opposite direction, with males experiencing more community violence (Voisin 2007, Stein et al. 2003) and lower overall levels of CRP (Khera et al. 2007).
The second hypothesis, that race and neighborhood poverty will moderate the focal relationship in such a way that being an African American and increased levels of neighborhood poverty would lead to a greater positive effect between adolescent exposure to community violence and early adulthood CRP, was partially supported. The interaction effect of race and community violence on CRP was not statistically significant, while there was a positive and statistically significant interaction effect of neighborhood poverty and community violence on CRP. So while the African American racial disadvantage did not increase the effect of exposure to community violence on CRP, increasing neighborhood poverty did.
Finally, the third hypothesis, that the gap in the effect of adolescent exposure to
community violence in predicting early adulthood levels of CRP between African Americans and non-Hispanic Whites will increase with increasing levels of neighborhood socioeconomic
35
hypothesized. Specifically, while the racial gap in the effect of adolescent exposure to community violence did increase as neighborhood poverty increased, African Americans reported lower levels of CRP as a result of exposure to community violence than non-Hispanic Whites in neighborhoods with levels of poverty greater than the mean of the sample. In fact, African Americans saw a decrease in early adulthood CRP as levels of adolescent exposure to community violence rose, and this effect became stronger as neighborhood poverty increased.
36
consistent with this assertion as well. For example, Fuller-Rowell et al. (2012) found that higher levels of perceived discrimination were associated with healthier cortisol outcomes for adult African Americans and that this relationship was strongest at the lowest levels of SES.
This paper does have some limitations. First, while difference-in-means tests were performed in order to validate the constructed measure of adolescent exposure to community violence, the items within Add Health did not ask respondents to specifically report where they were exposed to the violence or who performed the violence. Thus, this measure could also be capturing exposure to forms of violence that do not fall within the definition of community violence, especially given the high probability of experiencing multiple forms of violence among those who have any exposure to violence (Finkelhor et al. 2009). Additionally, as data on inflammation were only available at Wave IV, controlling for CRP or stress reactivity at baseline was not an option in the current study. Though it was hypothesized that the disadvantage of African American racial status and high neighborhood poverty would compromise the internal stress response early in the life course, I was not able to actually measure this directly or use this information to account for individual level variation in early life.
Conclusion
37
dependent on an individual’s race, their neighborhood environment, and the intersection of the
two. Based on the assertion of the Adaptive Calibration Model that exposure to stress overtime may decrease the effect of subsequent stressors on poor health outcomes such as inflammation, future studies analyzing the role of intersecting disadvantages as moderating factors between stress and health should investigate whether these moderating effects change across the life course. Additionally, qualitative study aimed at determining how youth from different racial and socioeconomic backgrounds interpret how stressful exposure to community violence is and how these interpretations may change as individuals age through adolescence may help to inform future quantitative study about these complex relationships.
Future research also should consider possible mediating factors that might account for the differing slopes seen in the relationship between early life community violence exposure, race, and later life measures of inflammation at varying levels of neighborhood poverty. Mediators in this relationship could include externalizing and internalizing behaviors that are known to be associated with both community violence (Fowler et al. 2009) and inflammation (Copeland et al. 2012, Slopen et al. 2013), and for which prevalence rates are highly varying between race
38
Appendix A: Testing the measure of Adolescent Exposure to Community Violence Scale Based on the National Child Traumatic Stress Network (2016) definition of exposure to community violence as “[victimization by or witnessing of] intentional acts of interpersonal violence committed in public areas by individuals who are not intimately related to the victim”, it
was important to verify that the measure of adolescent exposure to community violence available in Add Health was 1). measuring violence experienced in a public place (such as neighborhood or a school) and 2). not measuring violence that was perpetrated by persons that the respondent was “intimately related” to. In order to do this, several difference in means tests were carried
out.
Looking first at whether or not the measure of community violence was in fact measuring violence exposure within the community, a difference-in-means test for the violence measure was conducted between the portion of the analytic sample that claimed they felt safe in their neighborhood and the portion that did not. Feelings of safety have been found to be negatively associated with violence victimization (Henrich et al. 2004), so a statistically significant higher score on the Adolescent Exposure to Community Violence Scale among those who do not feel safe in their neighborhood may indicate that this measure is indeed measuring violence
experienced in these settings. Results show that there was a significant difference in the mean of this measure between the two groups, with those not feeling safe averaging a score on the
39
“Table 3: Do you usually feel safe in your neighborhood?”
# of Observations Mean Standard Error 95% C.I.
“Yes” 7,381 -.033908 .0112059 -.0558748 -.0119413
“No” 718 .3449779 .0476066 .2515128 .438443
Difference .378886 .0388746 .4550901 .3026818
Deg. Fr.=8,097 t = -9.1464 p = .0000
Within Wave I of Add Health, respondents were also asked to rate how safe they felt within their schools, another setting in which they may be exposed to community violence, or where they may interact with community violence perpetrators. Respondents reported feelings of school safety by responding to the phrase “You feel safe in your school” on the five-point Likert scale from “Strongly agree” to “Strongly disagree”. This scale was dichotomized so that those who disagreed or strongly disagreed were coded as “no” in order to conduct a
difference-in-means test. In line with the previous test, higher scores of the community violence measure among those who do not feel safe in their school may indicate that this measure is actually tapping into measures of violence experienced in one’s community. Results below show that
there was a significant difference in the means of the Adolescent Exposure to Community
40
“Table 4: Do you feel safe in your school?”
# of Observations Mean Standard Error 95% C.I.
“Yes” 6,968 -.0636397 .0110726 -.0853454 -.0419341 “No” 1,013 .399476 .0416553 .3177355 .4812166
Difference .4631158 .0330981 .5279968 .3982348
Deg. Fr.=7,979 t = -13.9922 p = .0000
In order to validate that the created measure of community violence was not actually measuring violence exposure in the home, two difference-in-means tests were conducted looking at a sub-sample of the analytic sample that reported ever being in a physical fight. When asked about their last physical fight, respondents were also asked about where they engaged in the fight, and with whom they fought. If adolescents who experience violence of some form (here, a fight) in their own home systematically score lower on the Adolescent Exposure to Community Violence Scale than their peers who claim their last fight was in the community, this may
indicate that the created measure actually is measuring violence exposure in the community, and not at home.
41
“Table 5: The last time you were in a physical fight, where did it occur?”
# of Observations Mean Standard Error 95% C.I.
“At home” 745 -.0442236 .0323708 -.1077724 .0193253 “Not at home” 3,860 .3512035 .0200897 .3118161 .3905909
Difference .395427 .0478909 .4893161 .301538 Deg. Fr.=4,603 t = -8.2568 p = .0000
Finally, looking at the relationship between who the respondents last fought and their scores on the created community violence measure, respondents were separated between those who reported last fighting with a family member or romantic partner and those who reported last fighting with a stranger, a friend, or someone within the community. Results below show that again, there is a statistically significant difference in the mean value of adolescent exposure to community violence measure between these two groups. Those that last fought a family member or romantic partner averaged a score on the Adolescent Exposure to Community Violence Scale .325 standard deviations lower than those who last fought with a member of their community.
“Table 6: The last time you were in a physical fight, with whom did you fight?”
# of Observations Mean Standard Error 95% C.I. “Relative or
Partner” 678 .0046493 .0360694 -.066172 .0754707 “Not a relative
or partner” 3,946 .3291784 .0196776 .2905992 .3677576 Difference .3245291 .0497723 .4221065 .2269517 Deg. Fr.=4622 t = -6.5203 p = .0000
42
definition of “community violence”, there are several limitations. First, feelings of insecurity
43
Appendix B: List of items used in the creation of control variables Recent Illness, Recent Infection and Medication Use
Symptom items used in the Recent Illness variable
Have you had any of the following conditions in the last two weeks? Mark all that apply. 1. Cold or Flu-like symptoms such as sore throat, runny nose, or cough
2. Fever
3. Night sweats
4. Nausea or vomiting or diarrhea 5. Blood in stool (feces) or in urine 6. Frequent urination
7. Skin rash or abscess
Disease and acute infections items used in the Recent Infection variable
Has a doctor, nurse or other health care provider ever told you that you have or had: 1. Asthma, chronic bronchitis or emphysema
2. Hepatitis C
Have you had any of the following conditions in the last four weeks? Mark all that apply. 1. Gum disease (gingivitis; periodontal disease) or tooth loss because of cavities 2. Active infection
3. Injury 4. Acute illness 5. Surgery
6. Active seasonal allergies (hay fever)
Medication items used in the Medication Use variable
1. NSAID/Salicylate Medication Use in the Past 24 Hours 2. NSAID/Salicylate Medication Use in the Past 4 Weeks 3. Cox-2 Inhibitor Medication Use in the Past 4 Weeks 4. Inhaled Corticosteroid Medication Use in the Past 4 Weeks 5. Corticotropin/Glucocorticoid Medication Use in the Past 4 Weeks 6. Antirheumatic/Antipsoriatic Medication Use in the Past 4 Weeks 7. Immunosupressive Medication Use in the Past 4 Weeks