C
2013. The American Astronomical Society. All rights reserved. Printed in the U.S.A.
THE STRUCTURE, ORIGIN, AND EVOLUTION OF INTERSTELLAR HYDROCARBON GRAINS
J. E. Chiar1, A. G. G. M. Tielens2, A. J. Adamson3, and A. Ricca1
1SETI Institute, Carl Sagan Center, 189 Bernardo Avenue, Mountain View, CA 94043, USA;[email protected],Alessandra.Ricca-1.nasa.gov 2Leiden Observatory, P.O. Box 9513, NL-2300 RA Leiden, The Netherlands;[email protected]
3Gemini Observatory, Northern Operations Center, 670 North A’ohoku Place, Hilo, HI 96729, USA;[email protected] Received 2012 July 12; accepted 2013 April 23; published 2013 May 24
ABSTRACT
Many materials have been considered for the carrier of the hydrocarbon absorption bands observed in the diffuse interstellar medium (ISM). In order to refine the model for ISM hydrocarbon grains, we analyze the observed
aromatic (3.28, 6.2μm) and aliphatic (3.4μm) hydrocarbon absorption features in the diffuse ISM along the line
of sight toward the Galactic center Quintuplet Cluster. Observationally,sp2bonds can be measured in astronomical
spectra using the 6.2μm CC aromatic stretch feature, whereas the 3.4μm aliphatic feature can be used to quantify
the fraction ofsp3 bonds. The fractional abundance of these components allows us to place the Galactic diffuse
ISM hydrocarbons on a ternary phase diagram. We conclude that the Galactic hydrocarbon dust has, on average,
a low H/C ratio andsp3 content and is highly aromatic. We have placed the results of our analysis within the
context of the evolution of carbon dust in the ISM. We argue that interstellar carbon dust consists of a large core of aromatic carbon surrounded by a thin mantle of hydrogenated amorphous carbon (a-C:H), a structure that is a natural consequence of the processing of stardust grains in the ISM.
Key words: astrochemistry – dust, extinction – ISM: lines and bands – ISM: molecules – techniques: spectroscopic
Online-only material:color figures
1. INTRODUCTION
Carbonaceous dust is the carrier of a number of infrared absorption features: specifically at∼3.4, 6.8, and 7.2μm, as well as the strong UV resonance at 2175 Å. In the Milky
Way, absorption bands due to the CH stretching (3.4μm)
and deformation (6.85, 7.25μm) modes of methyl (CH3) and
methylene (CH2) groups in aliphatic hydrocarbon materials
are detected along lines of sight that probe the local diffuse interstellar medium (ISM) within 3 kpc of the Sun (Adamson et al.1990; Sandford et al.1991; Pendleton et al.1994; Whittet et al.1997) and along the line of sight toward the Galactic center
(Butchart et al.1986; McFadzean et al.1989; Sandford et al.
1991; Pendleton et al.1994; Tielens et al.1996; Chiar et al.2000,
2002). The 3.4μm absorption band has also been detected in
one young planetary nebula, AFGL 618 (Lequeux & Jourdain
de Muizon1990; Chiar et al.1998). In recent years,
ground-based,Spitzer Space Telescope, andAKARIobservations have
revealed that absorption bands of aliphatic hydrocarbons are also common in dense and dusty galactic nuclei of Seyfert and
UltraLuminous InfraRed Galaxies (ULIRGs; Imanishi 2000;
Spoon et al. 2001,2004; Mason et al. 2004; Imanishi et al.
2006; Armus et al.2007; Dartois & Mu˜noz-Caro2007; Kondo et al.2012). In the Galactic diffuse ISM, absorption at∼3.3μm due to the C–H stretch in aromatics has been discussed by Chiar et al. (2000,2002; cf. Section3.1). An absorption band due to the CC stretch in aromatic hydrocarbons has been detected in the diffuse ISM in one extragalactic source; however, the weaker corresponding CH stretch eluded detection (Dartois et al.2007). A wide variety of materials have been considered as the carrier of these interstellar hydrocarbon bands mainly differ-ing in their production methods (cf. Pendleton & Allamandola
2002). What these materials generally have in common is that
they contain aromatic and aliphatic functional groups. The best-studied material which also provides the best fit to the IR observations is hydrogenated amorphous hydrocarbon (a-C:H;
Duley1994; Duley et al.1998; Mennella et al.2002). Labora-tory studies have shown that hydrogenated amorphous carbon materials may be responsible for the 2175 Å feature (Mennella et al.1996; Schnaiter et al.1999; Gadallah et al.2011).
In this paper, we combine previously published spectra of
the Galactic center Quintuplet sources from theInfrared Space
Observatory(ISO; Chiar et al.2000) and previously unpublished
3.02–3.65μm spectra from UKIRT-CGS4 of six individual
Quintuplet Cluster sources in order to investigate the nature and structure of the carbonaceous dust in the diffuse ISM. In Section2, we describe the previously publishedISOspectra and new UKIRT spectra. In Section3, we describe the characteristics and assignments of the absorption features as well as the resulting column densities of the CC and CH vibrational modes. Based on the measurements and calculations presented in
Section3, we deduce the structure of the hydrocarbon grains
in Section 4. Finally, we conclude with a discussion of the
evolution of carbonaceous grains in Section5 and summarize
our results in Section6.
2. OBSERVATIONS AND DATA REDUCTION
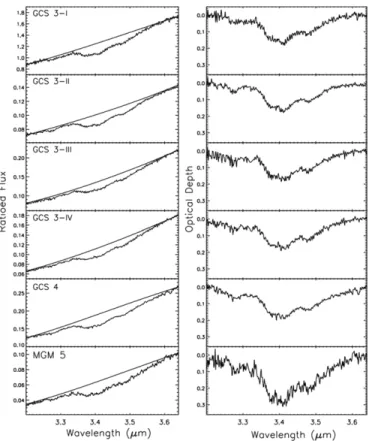
Using the United Kingdom Infrared Telescope (UKIRT) and the cooled grating spectrometer, CGS4, we obtained spectra in the Quintuplet region using the 1 pixel 0.61 slit, effectively sampling the dust with higher spatial resolution than possible
with ISO-SWS. With UKIRT-CGS4, we obtained spectra of
GCS3-I, II, III, and IV; GCS4; and MGM5 from 2.9 to 3.64μm
on UT 2000-06-21. The 40 lines mm−1grating and the 1 pixel
(0.61) slit resulted in a resolving power of λ/Δλ ∼ 1400.
Figure 1.Ratioed flux spectra with fitted third-order polynomial (left panels) and corresponding resulting optical depth spectra (right panels).
right-hand panel of Figure1. TheISO-SWS 2 to 13μm spectrum of the Quintuplet region was previously analyzed by Chiar et al.
(2000). The ISO-SWS beam was large at 14×20, so the
observations that were centered on GCS 3 I included GCS 3-I,
II, III, and IV. The 6μm region of the previously published
ISO-SWS spectrum is shown in Figure2.
The Quintuplet region likely suffers from differential extinc-tion (e.g., Figer et al.1999), however, given the uniformity of the profile shape and depth of the hydrocarbon absorption fea-tures presented here, we are confident that the dust properties and extinction have negligible variation for these particular lines of sight. With this in mind, we averaged the spectra from the individual lines of sight to create a high signal-to-noise mean
spectrum. The resulting high S/N spectrum allows us to more
accurately measure the substructure of the hydrocarbon compo-nents. To compute the weighted average, we first calculated the standard deviation at each wavelength across the spectrum with respect to a smooth function that follows the feature shape. The average standard deviation was then used to weight each
spec-trum in computing the mean profile that is shown in Figure2.
3. THE ASTRONOMICAL HYDROCARBON SPECTRUM
3.1. The Carrier(s) of the Absorption Features
The 3.2 to 3.65μm astronomical spectrum contains both
aro-matic and aliphatic (and, likely, olefinic) absorption bands. The
5.6 to 6.5μm region contains olefinic and aromatic
compo-nents. To be consistent with the analysis in the literature of the hydrocarbon bands, we uses Gaussian profiles to decom-pose the bands (e.g., Gielen et al.1996; Ristein et al.1998). In this way, we avoid assuming that the bands have strong wings such as Lorentzian and Drude shapes (see discussion in Jones 2012c). In order to disentangle these components, we carried out
3.2 3.3 3.4 3.5 3.6 0
0.05
0.1
0.15
0.2
Optical Depth
5.6 5.8 6 6.2 6.4 6.6 0
0.1
Wavelength (μm)
Figure 2.Left panel: optical depth spectrum computed from the weighted average of the observed spectra for the six quintuplet lines of sight. Of the five fitted Gaussians shown, four (green lines) are representative of the aliphatic hydrocarbon component, and one (red line) is representative of the aromatic component. The narrow feature that dips below the (red) aromatic band may be an olefinic component; this component has been omitted from the Gaussian fit. The co-added result of the fitted Gaussians is represented by the purple line. Right panel: optical depth spectrum of the 6μm region. Aromatic (red) and olefinic (dark blue) components are shown. The absorption feature represented by the light blue Gaussian is unidentified, but could be due to carbonyl groups. The co-added result of the fitted Gaussians is represented by the purple line. See text for description.
(A color version of this figure is available in the online journal.)
independent Gaussian fits to the 3.4 and 6.2μm observed
ab-sorption features4 (Figure2). The (mean) diffuse ISM 3.4μm
spectrum is decomposed into five Gaussians representing thesp2
CH,sp3CH
3and CH2asymmetric, andsp3CH3and CH2
sym-metric modes (Figure2, left panel). The central wavelengths and widths of these components were allowed to vary within limits determined by various laboratory experiments that produced hy-drocarbon films (Heitz et al.1998; Gielen et al.1996; Dischler 1983; Ristein et al.1998). The Gaussians that peak longward of
3.3μm represent the aliphatic hydrocarbon bands. Shortward of
the aliphatic bands is a broad band centered at 3.3μm (red curve
in Figure2discussed below), which we attribute to aromatics.
Superposed on this band is a relatively narrow (∼25 cm−1) band
centered at 3.28μm which we attribute to the olefinic CH mode. This narrow band (which dips below the red smooth Gaussian curve that represents the broader aromatic band) is omitted from the fitting procedure.
In the Quintuplet line of sight, there is also dense cloud mate-rial as evidenced by the observed H2O-ice absorption feature at
3μm (Chiar et al.2000). Chiar et al. (2000) used the observed
3μm H2O-ice feature to constrain and subtract the
contribu-tion of ice absorpcontribu-tion in the 6μm region in the Quintuplet
spectrum. We use that ice-subtracted 6μm spectrum here. The
resulting ice-subtracted 6μm spectrum closely resembles
pre-viously published ice-free 6μm spectra (cf. Chiar et al.2000), lending confidence that there is no residual ice absorption in the Quintuplet spectrum (Chiar et al.2000, their Figure 8).
Ex-perimental studies of hydrocarbon films show that the 6μm
hydrocarbon absorption feature is likely due to both aromatic
and olefinic modes (Wexler1967; Bour´ee et al.1996). These
studies show that the olefinic band is narrower and peaks at shorter wavelengths (λ0∼6.1μm) than the aromatic CC mode
which peaks at∼6.3μm (Bour´ee et al.1996; Choi et al.2001). While we use these central wavelengths to guide the decompo-sition of the astronomical 6μm spectrum, it is apparent that a third component at∼6.0μm is present (light blue curve). This absorption may be due to carbonyl groups which absorb in this
region (Wexler1967). The 6μm spectrum with the best fitted
Table 1
Fit Parameters for Diffuse ISM Hydrocarbon Feature
Mode Central Wavelength Δλ Δν Integrated Area Absorption Strength Column Density
(μm) (μm) (cm−1) (cm−1) (×10−18cm group−1) (×1018group cm−2)
CH3(sp3) asym. 3.376 0.05 47.2 6.55 24.3 0.27
CH2(sp3) asym. 3.420 0.05 42.8 6.74 15.2 0.44
CH3(sp3) sym. 3.474 0.05 41.0 4.96 23.7 0.21
CH2(sp3) sym. 3.520 0.05 40.4 2.76 14.8 0.19
CH (sp2)a 3.289 0.09 81.8 0.37 2.58 1.44
CC (sp2)b 6.19, 6.25 0.06, 0.16 15, 40 1.05, 1.20 0.275c 8.19
Notes.
aValues are for the aromatic mode only.
bValues are for olefinic and aromatic modes, respectively. Absorption strength is for the aromatic band; column density is the sum of both bands using the aromatic strength. See text for details.
cAbsorption strength for CC mode is in units of cm atom−1.
three Gaussian curves is shown in Figure2(right panel). The
parameters (central wavelength, full width at half-maximum, and integrated area) for the aromatic and aliphatic modes are listed in Table1.
In the 3.2 to 3.65μm region, the fitting procedure described above results in a broad,Δν∼80 cm−1, aromatic band centered
at 3.289μm. A much narrower absorption feature centered at
3.28μm toward the Galactic center was discussed by Pendleton
et al. (1994), but these authors state that the analysis of the feature was made difficult by incomplete cancellation of telluric and standard star features, so identification with an interstellar feature was left as an open question. A similarly narrow feature
centered at 3.28μm (Δν ∼ 25 cm−1) was detected by Chiar
et al. (2000) toward the Quintuplet Cluster line of sight; this feature, which we also detect in the spectra presented here (most apparent in the median spectrum in Figure2, left panel), is likely the olefinic C–H mode of hydrogenated amorphous carbon grains. Chiar et al. (2002) find a broad feature (∼100 cm−1)
centered around 3.3μm in their analysis of six spectra along
the line of sight toward the Galactic center central cluster.
They found a strong correlation between the 3.4μm aliphatic
feature and the 3.3μm broad aromatic feature, supporting our
assignment of the 3.3μm band to a component of the dust. While the CH stretch in polycyclic aromatic hydrocarbons (PAHs) is a logical candidate for this absorption, typical astronomical
3.3μm PAH emission features have much narrower widths
(∼30 cm−1; Sellgren2001 and references therein). Although
temperature effects can lead to broadening of the profile because of higherJlevels being populated at higher temperature (Joblin
et al.1995), a width near 100 cm−1 would imply temperatures
greater than∼2000 K, much too high for the diffuse ISM, where
the temperature of dust grains is constrained to 10–25 K (Mathis
et al. 1983). Brooke et al. (1999) observe a similarly broad
(74 cm−1) absorption feature that is blue-shifted (λ
0 =3.25μm)
compared to the diffuse ISM feature in several lines of sight toward dense clouds, where the feature is attributed to cold aromatic hydrocarbons.
As the sight lines toward the Quintuplet sources show ice absorption (Chiar et al.2000; Moneti et al.2001), we also
con-sider PAHs embedded in an H2O-ice matrix. PAHs embedded
in H2O-ice have broader bands compared to PAHs in inert
ma-trices, but the bands are still narrow (Δν ∼ 10–20 cm−1 for
the CH stretch band andΔν ∼4–10 cm−1 for the CC stretch
band; Bernstein et al.2005) compared with the astronomical
absorption features discussed here. Thus, PAHs (icy or other-wise) are not strong candidates for the diffuse ISM absorption
features. It is more likely that the aromatic absorption features are caused by a component of the hydrocarbon dust, linked to the aliphatics.
3.2. Column Densities
To better understand the nature of the diffuse ISM hydro-carbons, we calculate the column densities of the aromatic and aliphatic components. We then use these column densities to calculate the relative abundances of the components which, in turn, define the hydrocarbon structure (i.e., the placement of the diffuse ISM data point on the ternary phase diagram). The intrinsic strength of the absorption components is needed in order to calculate the column density of the absorber. There has been extensive discussion in the literature on the intrinsic strength of solid hydrocarbon absorption features (Tanaka et al. 1990; Gielen et al.1996; Furton et al.1999; Choi et al.2001;
Robertson2002). The independent measurements of IR
absorp-tion strength,σgroup, and H-content can be calculated for each
bond group by
σgroup=ωp/Aatom, (1)
where ωis the band frequency (cm−1) andpis equal to 1, 2,
3 in CHp. The proportionality constant,Aatom (per H atom for
the CH modes), takes into account the effects of the dielec-tric medium (the carbonaceous matrix) on the intrinsic strength of the bands and has been determined from laboratory stud-ies of hydrocarbon films. We assume that each bonding type (i.e., spy CHx) has a different proportionality constant that is
the same for all hydrocarbon films. Forsp3modes, these
con-stants areAatom=3.85×10²¹atoms cm−2for CH2modes and
3.65×10²¹atoms cm−2for CH
3modes (Tanaka et al.1990). The
intrinsic strength for thesp2CH mode is determined from the
intensity ratios per CH bond:sp3CH:sp3CH
2:sp2CH:sp1CH=
1:10:3.4:3.4 (Gielen et al. 1996), which translates to
sp2CH:sp3CH2 =3.4:20 per group. For the CC mode, we use
the absorption spectrum measured by Choi et al. (2001) for
a-C:H films to compute an absorption strength, assuming a density
of 2 g cm−3, typical for amorphous carbon (Robertson2002).
The absorption strengths (Table1) are in units of cm atom−1for
the CC mode and cm group−1for the CH modes. The strengths
in Table1are approximately a factor of two larger than those
used in previous work (e.g., Sandford et al. 1991; Pendleton
material, and did not take into account the effects of the car-bon matrix on the band strength. The latter correction factor is, of course, imperative for a proper comparison to laboratory studies on the structure of hydrocarbon films and for a correct placement on the ternary diagram relative to laboratory studies of well-characterized materials.
Computed column densities for CC and CH modes in the diffuse ISM are based on the integrated areas determined by the
Gaussian fit shown in Figure2(Table1). Column densities are
calculated in the usual way:
N =τΔν/σgroup(cm−2) (2)
whereτΔνis the integrated area of the individual hydrocarbon
component as measured by the fitted Gaussian andσgroupis the
intrinsic strength per group.
4. CARBON STRUCTURE
Carbonaceous materials show a great diversity in properties because the four valence electrons of carbon can exist in three hybridization states—sp3, sp2, and sp1—and four structural
states, aliphatic (alkane), olefinic (alkene), aromatic, and alkyne (Robertson 2002). In sp3 hybridization, all four electrons are
bonded through covalentσorbitals to neighboring atoms which
is the basis of a diamond-like network. In sp2 hybridization,
three of the electrons make such directed σ bonds forming
a plane, while the fourth electron is in a π-orbital. The π
electrons of adjacent carbon atoms can conjugate, forming
weaker π bonds perpendicular to this plane, resulting in a
graphitic structure or quasi-linear olefinic chains. These olefinic components can be important structural bonding units, in addition to the aliphatics, especially at low hydrogen content (Jones2012a). In thesp1 hybridization, only two electrons are
inσ bonds leading to linear chains, and the other two electrons are inπbonds.
The physical properties of a-C:H materials are intimately
linked to their microscopic structure (Robertson 2002). In
an astrophysical context, these materials have been studied
from a theoretical point of view (Jones 1990, 2012a,2012b,
2012c) and relevant laboratory studies have been performed
(Duley & Williams 1983; Duley1984, 1994). Hydrogenated
amorphous carbon films consist of a strongly cross-linked
three-dimensional network where aromatic clusters and/or aliphatic
chains are bonded through aliphatic structures. The tetrahedrally
bonded carbon (sp3 hybrids) leads to a three-dimensional
network that provides the material hardness, while the aromatic clusters (sp2 hybrids) in the network set the optical properties because they control the optical gap of the material. The various forms of carbonaceous materials are then distinguished by their H content that is directly linked tosp3/sp2ratio. Conversely, by
measuring the fraction ofsp2,sp3, and H in the material, the
physical properties can be determined.
Following, e.g., Robertson (2002) and Jacob & M¨oller (1993), the structural characteristics of a-C:H films can be visualized through a ternary diagram that plots thesp2,sp3, and H fraction,
which are normalized so that their sum is unity. This ternary
diagram (Figure 3) is a triangle where the apexes represent
(counterclockwise from the top) sp3, sp2, and H content.
Consider first the sp3 content (top apex): horizontal lines in
the diagram represent constantsp3 fractions with unity at the
top and zero at the bottom. The arrow on the right-hand side of the triangle indicates the direction of increasingsp3fraction.
Similarly, thesp2fraction is given by considering the left-hand
Figure 3.Ternary diagram for hydrocarbon materials. Placement of the various forms of hydrocarbons on this diagram is discussed in detail by Robertson (2002) and Jacob & M¨oller (1993). Glassy carbon materials such as soot, chars, and graphite have puresp2 bonds and are located in the lower left of the diagram. Diamond-like carbon lies at the apex of the diagram because of its puresp3bonds. The locations of sputtered amorphous carbon (a-C), tetrahedral amorphous carbon (ta-C), tetrahedral hydrocarbon (ta-C:H), and amorphous hydrocarbon (a-C:H) are also shown. The lower right-hand corner of the diagram represents the region where no stable hydrocarbon films can be formed. The loci of the GC diffuse ISM hydrocarbons as determined by the absorption strengths determined in this work and by Ristein et al. (1998) are represented by the circle and square, respectively.
corner as the apex and the right-hand side as the base. Constant
sp2fractions are again parallel to the base with unity in the apex
(left-hand corner) and zero on the base. The H-content is given by the right-hand corner as the apex and the left-hand side as the base. In a similar way, constant H fraction is given by lines parallel to this base with unity in the right-hand corner and zero at the base. Pure graphite and pure diamond are located in the
sp2 and sp3 apexes, respectively. The shaded right corner of
the diagram represents the region where no stable hydrocarbon films can form. At the edge of this “no network” region, the hydrogen content is low enough for polymers to form.
The characterization of different carbonaceous material and their location in the ternary diagram has been described by
Ferrari & Robertson (2000) and Robertson (2002). In an
astrophysical context, the ternary diagram has been introduced by Dartois et al. (2007). Along thesp2–sp3side of the triangle,
the fraction of sp3-bonded C increases and disorder increases
because the hexagonal graphitic structure is broken up by the
introduction of defects. In a-C material, there are some sp3
sites and the amorphous carbon is more disordered because of the incorporation of odd-membered and distorted rings (Figure3). For ta-C material, there is moresp3content and the
sp2 configuration changes from rings to short (olefinic) chains
(Figure3). In a-C:H, thesp3 sites form a continuous network
of CC bonds and thesp2C are arranged as small clusters. For
low H content, thesp2C is aromatic in nature while for high H content, olefinic chains dominate. A large part of thesp3bonding
in a-C:H is due to saturation of bonding with H and, indeed, the
sp3 fraction is directly linked to the hydrogen content. The H
content in ta-C:H is low and hence, unlike for a-C:H there is
no polymeric regime. The ta-C:H films with highsp3 fraction
Table 2
Hydrogen and Carbon Content in ISM Grains
Atom Mode Abundance
(×10−4)
Carbon sp2 1.49
sp3 0.13
Hydrogen sp2 0.26
sp3 0.31
Typical carbon polymers such as polystyrene and polyvinyl have a very high H-content and little to no cross linking of the carbon-chains. Those are located along the 80% H content line. Simple molecular solids are located beyond this line in this corner of carbon films. Solids consisting of PAH molecules are located
along the base line connecting thesp2and H apexes while pure
alkane solids are along the line connectingsp3and H apexes.
Given this propensity of bonding and compositional varia-tions, many different carbonaceous materials have been pro-duced using a variety of techniques and characterized by dif-ferent analytical methods. These materials do not uniformly cover the ternary diagram but, rather, are concentrated in spe-cific regions, basically because these production methods result in materials with systematic variations in their structure. These regions are indicated in Figure3. Conversely, we can determine the properties of a material by locating it on this ternary
dia-gram. Table1summarizes the observed characteristics of the
different IR bands that can be used to determinesp2,sp3, and H
content. While some of these have been reported before in other studies, some—notably the aromatic H and aromatic C—have only been measured in a few and very special environments. Here, we discuss all available constraints on the three material characteristics that span up the ternary diagram for carbon dust in the diffuse ISM.
The abundance of elemental carbon (and hydrogen) involved in the aliphatic and aromatic absorption features cannot be accurately calculated because, for the Galactic center, the
total hydrogen column in not known. Assuming N(H)/AV
appropriate for the solar neighborhood, and AV ∼ 29 mag
(estimated from near-IR color excess by Figer et al.1999), we
deduce the C and H abundances listed in Table2. We emphasize
that the abundances listed in Table2should only be considered
indicative rather than firm measurements. Strictly speaking, we
cannot assume theN(H)/AV ratio which is derived from local
UV studies, since the dust-to-gas fraction in the Galactic center region is likely to be much higher than the local value in view of
the Galactic elemental abundance gradient (Smartt et al.2001;
Cunha et al. 2007). In addition, the silicate and carbon dust
IR bands optical depth per unit magnitude of visual extinction are much stronger in the Galactic center than in the local ISM (Roche & Aitken1985; Pendleton et al.1994) indicating different dust characteristics and thus a different gas-to-dust ratio. Fortunately, one does not have to accurately calculate
the hydrogen column,N(H), in order to compute the fractional
abundances ofsp2, sp3, and H for the observed astronomical
hydrocarbons.
The hydrogen content of carbon grains can be measured
through the IR absorption features of the aliphatic CH2 and
CH3 modes and the aromatic CH mode. Experimental studies
on laboratory materials have shown that these modes have to be carefully unblended—basically because different types of functional groups have intrinsic strengths that can vary by an order of magnitude—but if carefully done, the derived
H-content is in good agreement with other analytical techniques
(Ristein et al. 1998). To be consistent with the experimental
analysis, for the aliphatic component of the carbon grains, we
use the asymmetric CH stretching modes of the CH2and CH3
groups (Table 1). We assume that all sp3 carbon atoms are
bonded to at least one H, so we are ignoring diamond-like structures (materials in the upper apex of the ternary diagram).
As the observed interstellar 3.4μm band is characteristic for
a:C–H material (see below) and experiments have shown that
essentially allsp3 sites in a-C:H are hydrogenated (Robertson
2002), this is a reasonable assumption for this work. One
measure of thesp2fraction results from the aromatic CH mode.
However, that is only a good measure of thesp2carbon if the
H/C ratio is high and, consequently, the aromatic domains are
small (Jones 2012a). In contrast, the 6.2μm CC feature is a
direct measure of the C fraction insp2. We have decomposed
this latter measure into an olefinic (feature around 1640 cm−1)
and an aromatic (feature around 1580 cm−1) component (see
Figure2; Section3.1) but for the purpose of the ternary diagram, we have added them together. We note that the measured H/C ratio in the aromatic component of interstellar carbon dust
is small (Table 1). We take the CH2 and CH3 abundances as
our measure of the sp3 carbon Hence, we ignore any “pure”
C sp3 network. Essentially, we are assuming that interstellar
carbon has an a-C:H structure rather than a ta-C:H structure (see above). These determinations of thesp2andsp3fractions
and the H-content are summarized in Table 2 and shown on
the ternary diagram (Figure 3). The values derived for the
sp2 and sp3 fractions and the H content do depend on the
adopted intrinsic strength of the relevant vibrational modes. We have adopted values which are entirely consistent with the physical chemistry literature on amorphous hydrocarbon films. As an indication of the systematic uncertainty, somewhat different intrinsic strengths were adopted by Ristein et al. (1998) and this moves the location of interstellar solid carbon on the ternary diagram slightly (Figure3). The values adopted by Jones (2012a) are also very similar.5 Earlier studies on interstellar hydrocarbon dust adopted values that were a factor two different (see Section3.2). As those are not consistent with the location of the hydrocarbon solids in the ternary diagram, we do not consider these here.
The results of our analysis firmly place interstellar carbon
dust—on average—as a highly aromatic material (Figure 3).
This merely reflects the large carbon column density required
to explain the observed 6.2μm band, which is due to an
in-trinsically very weak CC mode. The small H/C and sp3/sp2
ratio derived here for the Galactic center direction are in agree-ment with studies of local interstellar carbon dust (Pendleton &
Allamandola2002). In the local ISM, the CC stretch at 6.2μm
has not been detected and, indeed, we would not have expected to detect it given the low visual extinction of the sight-lines
(AV 10 mag ). The total solid carbon andsp2 fraction can,
however, be estimated from measured gas phase abundances and the UV extinction curve. Adopting an elemental carbon
abundance of 3×10⁻⁴ and an interstellar gas phase C
abun-dance of 1.5×10⁻⁴(Cardelli et al.1996), the ratio of aliphatic
H—as measured by the 3.4μm band—to all solid carbon is
0.15 (Pendleton et al.1994). In the local solar neighborhood,
almost all of the carbon in solid form also has to be sp2 in
order to explain the observed strength of the 2175 Å feature
Diffuse ISM
H-interaction
UV
small hydrocarbons
(CCH, c-C3H2,C4H) Aromatic Soot
Dense Cloud Soot with ice layer
C60
free-flying PAHs
a-C:H surface layer Basic Building Blocks
Stellar Ejecta
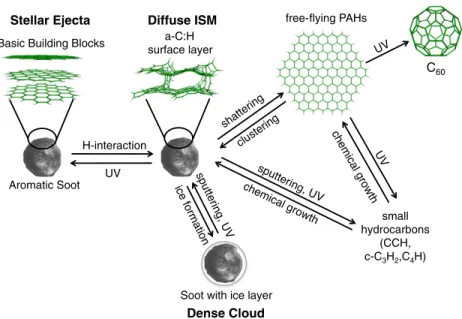
Figure 4.Soot injected by C-rich asymptotic giant branch stars has a highly aromatic character with large graphene sheets stacked into nano grains. Processing by H atoms and UV photons in the ISM quickly produces a thin (∼10 Å) surface layer of a-C:H material in diffuse interstellar clouds. In dense clouds, this a-C:H layer is lost by photolysis. Shattering by grain–grain collisions in strong shocks in the warm intercloud medium produces free-flying PAH molecules. This shattering is counteracted by clustering in dense cloud environments. Shocks and UV photolysis in the ISM will fragment these PAHs into small hydrocarbons and/or isomerize them into very stable fullerene molecules. Figure adapted from Jones (2009).
(A color version of this figure is available in the online journal.)
(Draine2003). Assuming that allsp3carbon is in aliphatic CH2
or CH3groups, the derivedsp3/sp2fraction is 0.05. These
num-bers are in reasonable agreement with the values derived here for the Galactic center sources (Tables1and2). Dartois et al. (2007), in their pioneering study of interstellar carbon grains, focused on observations of the ULIRG IRAS 08752+3915 and
had only upper limits for the aromatic CH and the sp2
com-ponent. Hence, they were forced to use indirect constraints to locate interstellar grains in this source on the ternary plot. These constraints were based upon an evaluation of the structure of a-C:H in terms of random covalent networks. Essentially, this boils down to assuming that the structure of interstellar carbon dust resembles that of hydrogenated amorphous carbon and con-sists of small aromatic domains connected by aliphatic (and/or olefinic) chains (Jones1990,2012a). As our analysis shows, the aromatic H/C ratio and the aliphatic/aromatic-C ratio are very small and, consequently, the aromatic domains are actually very large. Indeed, it has been well recognized that the observed low H/C fraction forces us to conclude that the structure of inter-stellar carbon dust consists of large aromatic moieties connected by small aliphatic chains (Pendleton & Allamandola2002) and our analysis presents further observational underpinning of this notion.
The analysis of the IR absorption bands due to interstellar carbon dust represent an average of the dust along the sightline. We recognize, however, that the observed profile of the inter-stellar 3.4μm band with its detailed substructure dominated by
CH2 and CH3 groups in a ratio of2 (Sandford et al.1991;
Pendleton et al.1994) is indicative of hydrogenated amorphous
carbon, a-C:H, characterized by a relatively high H/C ratio
(0.5). As this inferred microscopic H/C ratio of the material
carrying the interstellar 3.4μm band is much higher than the
average H/C ratio derived from our analysis, this is indicative of a two (or even multi) component mixture in a ratio of about 1:3. In principle, these components could be fully independent.
However, we envision the a-C:H as a mantle on top of pure aromatic carbon grains. This core–mantle structure is a natu-ral consequence of the processing of carbon stardust grains by
thermal H atoms, UV photons and/or interstellar shocks in the
ISM. We discuss this in some detail in Section5.
5. EVOLUTION OF CARBON DUST IN THE ISM
Figure4(adapted from Jones2009) summarizes the
evolu-tion of interstellar carbon dust and the processes that play a role therein. Carbon-rich asymptotic giant branch (AGB) stars inject highly aromatic carbon stardust into the ISM. In the ISM, this carbon stardust is processed by UV photons and thermal H atoms
in diffuse clouds and by implanted protons/H atoms in shock
waves, creating a thin surface layer of hydrogenated amorphous carbon material. In shock waves, besides H-implantation, dust will also be sputtered, losing some surface atoms, and shattered through grain–grain collisions, forming PAH molecules. The latter process can be counteracted by coagulation of PAHs in dense clouds. PAH molecules are also lost through UV pro-cessing leading to cages, rings, and small (hydro)carbon chains as well as possibly to C60. Depending on the kinetics involved,
PAHs may grow through reactions with carbon species. In dense clouds, carbon dust will acquire ice mantles which are quickly removed through photodesorption in the diffuse ISM or through sputtering in frequent, weak shocks. We will discuss each of these aspects in more detail below.
Figure 5.Top panel:ISO-SWS spectrum of IRC+10216. Inset shows wavelength region of CH stretch in aliphatic hydrocarbons. Overlaid is the polynomial used to create the optical depth spectrum in the panel below. Bottom panel: optical depth spectrum for IRC+10216 (solid line). Superposed is the GC GCS3 spectrum scaled to the depth expected for theAV of IRC+10216 and
τ/AV =0.004 for the local ISM (Pendleton et al.1994).
dust budget in the form of hydrogenated amorphous carbon from a hitherto unidentified stellar source operating in the
high-temperature window (see Section 5.1)—and that these dust
components are not processed at all in the ISM. However, we deem that inconsistent with our general understanding of the origin and evolution of interstellar dust.
5.1. Carbon Stardust
Observational, experimental, and theoretical studies all agree that carbon stardust has a highly aromatic character with a very low H-content. Near-infrared spectroscopy of C-rich AGB stars can be used to place stringent upper limits on the
strength of the 3.4μm aliphatic hydrocarbon band. We have
analyzed ISO/SWS (from the Sloan et al. 2003 database) of
the prototypical C-rich AGB object, IRC+10216 (Figure 5),
and two carbon AGB stars (not shown), AFGL 3068 and AFGL 3099, which are representative members of the class of extreme C-stars that dominate the carbon stardust budget of the local ISM. While these objects are very bright at
near-infrared wavelengths and hence the ISO/SWS spectra
have very high signal-to-noise, the spectra show C2H2 and
HCN bands around 3.4μm that somewhat hamper detection
of the aliphatic bands and we have therefore adopted very
conservative local continua to determine τ3.4 as shown for
IRC+10216 (Figure5). The results are summarized in Table3.
The total visual extinctions toward these objects is dominated by circumstellar dust and has been determined through model
Table 3
Hydrogen and Carbon Content in ISM Grains
Source AV τ3.4/AV
(mag)
IRC+10216 18–27 <0.0003
AFGL 3068 63–86 <0.0005
AFGL 3099 23–30 <0.001
AFGL 618 59–98 0.001–0.002
Local ISM · · · 0.004
fits to the spectral energy distribution (Martin & Rogers1987;
Le Bertre1997). The 3.4μm aliphatic hydrocarbon absorption
band has been observed toward the extreme, C-rich post-AGB object, AFGL 618, with an optical depth of 0.1 (Chiar et al.
1998). The visual extinction range,AV =59–98 mag, toward
this object has been determined from hydrogen recombination lines in the spectrum. The derivedτ(3.4μm)/AV ratios (Table3) are much less toward these stardust sources than observed in the local diffuse ISM (Pendleton et al. 1994). It is clear that the H-content and hydrogenated amorphous carbon character of carbon stardust is much less than the already low values derived for ISM dust (Table2; Section4).6
Analysis of the spectral energy distribution and (infrared) molecular absorption spectra of C-rich AGB stars reveal that the temperature at the inner shell where dust is formed is near 1000 K (Le Bertre1997; Martin & Rogers1987; Fonfr´ıa et al. 2008; Keady et al.1988). This temperature is characteristic for the carbon soot formation window that converts acetylene into large PAH molecules and then soot (Frenklach & Feigelson 1989; Cherchneff et al.1992; Cherchneff2012).
A variety of laboratory studies have focused on the structure of interstellar carbon dust analogs (Mennella et al.1995,1996, 2003; Schnaiter et al.1999; J¨ager et al.2008,2009; Gadallah
et al. 2011). These studies show that carbon soot formed at
∼1000 K has a very highsp2character (>0.9; J¨ager et al.2009;
C. J¨ager 2012, private communication). The H content of the soot produced in this low-temperature window has not been quantified, but is very low. The resulting soot grains are highly graphitic, consisting of large graphene layers (up to 3 nm). These sizes are comparable to the largest PAH
molecules—C222H42—detected in the MALDI-TOF7studies of
these experiments. Soot formation in this temperature window proceeds through the formation of large PAHs and their con-densation and further growth onto grains. Experimental studies do reveal a second window of carbon soot formation at much higher temperatures (>1700 K; J¨ager et al.2008,2009). Soot formed under these conditions has a much higher H-content
and a much lowersp2/sp3 ratio. However, observations show
that carbon dust forms around∼1000 K (the low temperature
window) in C-rich AGB ejecta (see above). In consequence, the higher temperature soot window is of little relevance for the C-star dust budget. It is tempting to speculate that the fullerenes observed to dominate the IR spectra of some, very unique planetary nebulae (e.g., Tc1; Cami et al.2010) are the byproduct of the soot formation process in this high temperature window but the underlying cause for the opening up of this soot window in these objects is unclear.
6 The limit placed on the aliphatic absorption feature is an estimate, and although the emission across this band should be minimal, a proper radiative study would be necessary to firmly quantify the amount of hydrocarbons in these evolved star environments.
Some peculiar C-rich post-AGB objects show an appreciable
3.4μm emission band accompanying their PAH emission
fea-tures. These so-called 21μm objects are low metallicity stars
with a mass of1M formed some 10 billion years ago (van
Winckel2003). As a class, these objects have not been very
important contributors to the stardust budget over the history of
the Milky Way. The peak position and profile of the 3.4μm
band in these objects—quite distinct from that of the
well-known 3.4μm band accompanying the 3.3μm interstellar PAH
feature8—agrees well with the absorption feature in the ISM
and is therefore likely due to aliphatic groups attached as side groups to the PAH skeleton (cf. Joblin et al.1996). The observed flux in the 3.4μm aliphatic hydrocarbon band is typically com-parable to that in the 3.3μm aromatic CH band. As the intrinsic strength of the former is some 10 times stronger per group than the latter (Joblin et al.1996), the aliphatic to aromatic charac-ter of the emission carrier is still very small (∼0.1), even in
these types of objects. We emphasize that these 3μm emission
features originate from shells at very large distances from the central star (Meixner et al.1999). The temperature of the dust in these shells is observed to be much too low to allow dust emis-sion at such short wavelengths and the carriers must therefore be molecular in nature (Hony et al.2003). Hence, these aliphatic groups do not necessarily have any bearing on the character of the carbon dust. Finally, spatially resolved spectroscopy of the 3.3 and 3.4μm features in some of these 21μm objects reveals that the relative strength of the aliphatic to aromatic bands de-creases with distance from the central stars (Goto et al.2003, 2007). As aliphatic CH2/CH3groups are more susceptible than
aromatic H to UV photolysis, this likely reflects processing of the emitting molecules by UV photons from the interstellar radi-ation field, penetrating the envelope (Joblin et al.1996). In any case, there is no evidence that the carbon dust released by these objects into the ISM has a high hydrogenated amorphous carbon character. Quite likely, as for the dominant carbon soot facto-ries of the interstellar medium (cf. IRC+10216), in these objects, carbon dust is formed around 1000 K and is consequently highly aromatic as well.
5.2. Hydrogenation of Carbon Stardust: H-interaction and UV Photolysis
In a series of experiments, Mennella and others (Furton &
Witt1993; Mennella et al.2001,2002; Mennella2006) have
investigated the evolution of carbon solids under the influence of a flux of H atoms and UV photons. The results show that down to the lowest temperature investigated (80 K), exposure of an aromatic solid to a flux of H atoms leads to the formation of aliphatic CH2and CH3groups until a saturation value is reached.
The cross section for this process isσH1–2×10⁻¹⁸cm2per
H atom. Under the influence of UV photons, aliphatic H is lost
with a cross section ofσUV 10−19 cm2 per UV photon. In
steady state, the H/C coverage,θ(H/C), is given by
θ(H/C) =
1 + σUVNuv
σHvHnH
−1
θsat(H/C), (3)
withNuv the UV photon flux (108Go photons cm−2 s−1 with
Gothe radiation field in units of the Habing average interstellar
radiation field), andvHandnHthe atomic H velocity and density.
We take the saturation value,θsat(H/C), to be 0.5, typical for
a-C:H material. For a typical diffuse cloud with an atomic H
8 Generally attributed to hydrogenated PAHs (Dopfer2011).
density of 102 cm−3 and a temperature of 100 K, we arrive at
a fractional coverage of 0.66 of the saturation value or about 0.3. AsGo/nHis approximately constant for diffuse clouds in
an ISM in pressure and thermal equilibrium, this value will not vary much in the ISM. This steady state value is reached after
a time>104 yr. Thus, exposure to atomic H and UV photons
quickly converts a surface layer of aromatic grains into a-C:H material in the ISM. The thickness of this layer will depend on the porosity of the grains but in the experiments the measured saturation absorption strength of 1.6×103cm g−1corresponds
to a H/C value averaged over the sample of 0.2 and hence about
1/3 of the sample has been converted into a-C:H material.
The interstellar 3.4μm band has not been observed toward
sources behind molecular clouds (Allamandola et al. 1992;
Chiar et al.1996; Brooke et al.1996), indicating that the balance of hydrogenation and dehydrogenation shifts toward the latter
in these environments. Following Mennella et al. (2001), we
attribute this to the formation of a thin ice layer on the surfaces of carbon dust grains during the transition from a diffuse cloud to a dense molecular cloud. Mennella et al. (2001) have studied the loss of the aliphatic hydrocarbon band and these experiments show that the 3.4μm band is lost after exposure of (ice-covered) a-C:H grains to a fluence of 3×10¹⁹photons cm−2. Observations
show that ice mantles are formed when the visual extinction exceeds 3 mag (Whittet et al.2001). For this visual extinction, the UV flux that grains are exposed is 3×10¹³photons yr−1and
the 3.4μm band is lost in 106yr. The timescale for ice formation isτ 3×10⁷/n
Hyr per ice layer (see, e.g., Hasegawa & Herbst
1993; Cazaux et al. 2010). Thus, in 106 yr, an ice mantle of
some 30 layers is formed at a density of 300 cm−3. Hence, we
surmise that these ice layers as well as the conversion of atomic into molecular hydrogen will stop the hydrogenation process.
5.3. a-C:H Formation by Ion Processing in Interstellar Shocks
For fluences in excess of 1015 ions cm−2, shock processing
of carbon solids by impinging H atoms in shock waves will convert aromatic carbon surfaces into hydrogenated amorphous
carbon (Tielens et al. 1994 and references therein). For
typ-ical interstellar shocks (100 km s−1), fluences in excess of 1019(a/1000 Å) ions cm−2 are expected. The estimated range
of atomic H at these energies is some 10 Å or some 5 basal planes. Hence a thin layer of hydrogenated amorphous carbon will be formed with a H/C ratio of0.5 (Tielens et al.1994). If this process were the main cause of the observed a-C:H
com-ponent in the diffuse ISM, the observed (average) H/C ratio
(Table2) for interstellar grains would imply a typical radius for interstellar carbon grains of50 Å.
5.4. The Destruction of Carbon Grains in Interstellar Shocks
The rapid destruction of dust grains by interstellar shocks has long been recognized as a key problem for studies of the evolution of interstellar dust (Draine & Salpeter 1979; Dwek & Scalo 1980; McKee1989; Jones et al.1994,1996). Theoretical lifetimes for dust grains in the ISM are calculated to be only 400–600 Myr, depending on size and composition. This is much shorter than the injection timescale for stardust
into the ISM (2×10³Myr). This conundrum has been taken
to imply that interstellar dust is rapidly reformed in the ISM by (unknown) processes (Tielens2005; Draine 2009; Jones &
Nuth2011). There are two aspects (cf. McKee1989) that enter
size and material characteristics, and of shock velocity. (2) A convolution of these shock destruction results with a model for the distribution of shock frequencies in the ISM of the Milky Way. Here, we revisit these aspects, focusing on interstellar carbon dust.
Besides implantation and the conversion of graphitic to a-C:H material, impinging H ions may also sputter some C-atoms from
C-grains. As the grain temperatures are rather low (T 300 K),
chemical sputtering is of no concern. Because of its potential as internal lining for tokamak reactors, sputtering of carbon solids is an active area of research and this has been reviewed
by Tielens et al. (1994) for astrophysical purposes. Measured
yields for H and He at the relevant low energies (50–200 eV) are quite low (Ysput10−2for H andYsput10−1for He). It should
be understood that as the surfaces of carbon solids are quickly processed to hydrogenated amorphous carbon by the sputtering process, the exact nature and structure of the starting material is not very important. Indeed, they all have similar sputtering yields. The widely used carbon solid yields by Tielens et al. (1994) present a reasonable fit to these data. We note that a recent study by Serra D´ıaz-Cano & Jones (2008) arrives at slightly higher sputtering yields (factor of two). Partly, that reflects an adopted mean mass of the sputtered atoms which is in between the H and C mass. Such a low mass does not seem warranted. Replacement of a internal H atom in a a-C:H material by an impinging H atom does not produce net (carbon) sputtering loss (recall that the sputtering yield per impinging H atom is much less than unity). The C binding energy adopted in this study seems also somewhat low and the resulting sputtering yields are high compared to the experimental data available. Hence, in our analysis, we will adopt the destruction rates derived by Jones et al. (1994,1996), which are based upon the sputtering yields of Tielens et al. (1994).
In each sojourn into the warm intercloud medium, a grain will typically be shocked by one 100 km s−1shock. Theoretical models for sputtering of carbon solids in interstellar shocks
lead to the injection of 5% of the solid carbon into the
gas phase for such a shock (Jones et al. 1996). Somewhat
higher,10%, sputtering losses occur for faster radiative shocks (vs 200 km s−1) but such shocks are four times less likely to occur.
Observationally, evidence for the destruction of carbon dust in interstellar shocks is scant as the observations are challenging because of the intrinsic weakness of the relevant UV Cii absorp-tion line. However, recent observaabsorp-tions of the Ciiabsorption line in the ISM support the idea that the larger grains in dense clouds are fragmented into smaller grains in the low density regions of the neutral ISM (Parvathi et al.2012). Depletion studies of sil-icon, magnesium, and iron are much more straightforward. For these species, observations reveal distinct and systematic differ-ences in the level of depletion between the cloud and intercloud
phases of the ISM (Savage & Sembach1996). As material
cy-cles much more rapidly between the phases of the ISM than it is injected by stars, this depletion pattern reflects a balance of ISM processes; e.g., between shock destruction in the intercloud
medium and reaccretion in the denser environment of Hiclouds
(Tielens1998,2009). The observed large difference in the de-pletion between these two phases of the ISM, then demonstrates directly that the processes involved—shock destruction and accretion—operate on a timescale similar to the timescale at which material is mixed from the cloud to the intercloud medium
and back (Tielens1998). This mixing timescale is much less
(30 million years) than the timescale at which new dust is
injected into the ISM. Thus, specifically, some 10% of the iron, 15% of the magnesium, and some 30% of the silicon is returned to the gas phase upon each sojourn into the intercloud medium and then rapidly re-accreted once the material is cycled back to the (diffuse) cloud phase. This leads to the formation of a thin, outer skin that protects underlying grain material against destructive processing in shocks (Tielens1998).
For silicon and magnesium, these differences in depletion between cloud and intercloud phases are slightly larger than theoretical models for sputtering of silicate materials would predict, indicating that the re-accreted material is in the form of mantle with a somewhat lower binding energy than silicates. The depletion pattern of oxygen indicates that it participates in this shock-sputtering and reaccretion cycle. However, carbon does not show a difference in depletion between the cloud and intercloud medium; e.g., the observed variation in the depletion between these phases is less than 10% (Sofia et al.2004). This is much less than for silicon, implying that carbon grains are less affected than silicate grains in the ISM by typical 100 km s−1 shocks. This is in good agreement with theoretical models
for such shock waves (Jones et al.1996). So, the interstellar
depletion studies force us to a model where mantles accreted in the diffuse ISM are oxide-based rather than carbonaceous. We
note that the 3.4μm band is not polarized toward the Galactic
center while the silicate band is (Adamson et al.1999; Chiar
et al.2006). Hence, the hydrogenated amorphous carbon dust
component does not form a layer on top of silicate grains. This dichotomy between oxide and carbon dust mantles implies that
distinct chemical/physical processes dominate their formation
and we attribute this to accretion and surface chemistry for the oxides and atomic H interaction with graphitic grains for the carbonaceous grains.
The destruction of carbon solids can be more important in the hot gas associated with supernova remnants. In those environments, grains are destroyed through thermal sputtering and, theoretical models show that, depending on the grain residence time in the hot gas (e.g., the expansion/rejuvenation of the supernova remnant), an extensive surface layer can be
removed (Tielens2005; Bocchio et al.2012). Observationally,
a large fraction (60%) of the solid carbon has been returned to the gas phase in the intermediate and high velocity gas associated with Orion’s cloak (Welty et al.2002). This “cloak” material is associated with the hot bubble in the Orion–Eridanus
region and refers to a 100 km s−1 shock propagating in a
region with a pre-shock density of10−3 cm−3 (Welty et al.
2002). Thus, rather than shocking a warm intercloud medium
region, these observations refer to a shock propagating into hot intercloud medium gas and reflects probably the rejuvenation of a preexisting supernova remnant by a new supernova, where it should be understood that the current velocity of the gas is only a lower limit to the shock velocity as the shocked gas may
have been slowed down by now (Cowie1978). Curiously, while
carbon dust has been largely destroyed, much less silicon and
iron (10%) has been returned to the gas phase (Welty et al.
of different sizes lose the same thickness surface layer. These differences between destruction in the warm and hot phases of the ISM might be reconciled if carbon dust grains are much
smaller than silicate grains. Small sizes (50 Å) coupled with
their low specific density ensure that carbon dust is rapidly stopped in radiative shocks and faces little destruction while large, and denser, silicate grains are betatron accelerated and suffer much larger sputtering losses (Jones et al.1994). In hot gas that fully erodes 50 Å carbon grains, the fractional destruction of large silicate grains could still be small (3Δa/a 0.1 for
Δa =50 Å anda=1500 Å).
The total mass of hot intercloud medium gas in the Milky
Way is some 108M
but in the plane this is only some
MHIM 107M. Typically, OB associations form massive
stars over an ΔτOB = 10–20 Myr time interval. Moreover,
the lifetime of the lowest mass (8M) core collapse
progen-itor is some 40 Myr. For example, the age spread of the Orion OB association subgroups—responsible for the Orion–Eridanus superbubble—is in excess of 10 Myr and the youngest
sub-groups are still forming (Brown et al. 1994; Blaauw 1991).
Essentially, after the first core collapse supernova explosion, subsequent ones merely rejuvenate the superbubble and their energy is expended in driving the (slow) expansion of swept-up ISM (Shull & Saken1995). However, the shocks associated with this expansion are too slow to contribute to processing interstel-lar dust (McKee1989). The timescale for reprocessing all of the
ISM through superbubbles is then (MISM/MHIM)ΔτOB (7×
109/107) 107=7×10⁹yr. Hence, while hot gas in superbubbles may destroy most of their associated carbon dust, on a galactic scale they are of little importance for the dust destruction budget. Runaway OB stars and supernovae Type Ia may explode out-side of such superbubbles. Censuses of local OB stars show that some 10%–20% of all OB stars may be ejected from their
association and explode in the field (Gvaramadze et al.2011;
Bragan¸ca et al.2012; Fujii & Portegies Zwart2011). Analysis of a variety of galactic and extragalactic data shows that some 80%–90% of the core collapse supernovae explode within su-perbubbles and only a small fraction explode in the field (Higdon & Lingenfelter1980,2005). This is not too surprising as B stars are the predominant core collapse supernova progenitors and only a very small fraction (a few percent) end up as runaways. Based on galactic chemical evolution models, the ratio of Type Ia to core collapse supernovae is 15% over cosmic timescales (Tsujimoto et al.1995) or about 3×10⁻³ yr−1. The Type Ia supernova rate for Sbc galaxies is measured to be1.1×10−13
per unit stellar mass (Li et al.2011). With a stellar mass of
6×10¹⁰M
, this yields a Type Ia supernova rate of 7×10⁻³
for the Milky Way. Here, for convenience, we will adopt the former. In addition to their low frequency, the runaway Type II supernova and Type Ia supernova may be much less effective in destroying interstellar dust as they tend to explode well above the gas disk and this may amount to factor three in the
effec-tive supernova rate (McKee1989). Taking an overall supernova
rate of 2×10⁻²for the Milky Way of which 0.15 are runaway
OB stars or Type Ia supernova and 0.33 of those occur in the gas disk, we arrive at an effective supernova rate of 10−3;
al-most an order of magnitude less than adopted by McKee (1989).
Such supernovae would process∼300M of ISM material in
the hot gas and destroy all the dust therein. The resulting life-time of dust against destruction by these supernovae is then (MISM/MSNR)k−eff1(7×109/300) 1032×1010yr.
Summarizing this discussion, we conclude that observa-tional and theoretical evidence shows that low velocity,
radia-tive shocks (<250 km s−1)—the predominant shocks in the
ISM—are not effective in destroying interstellar carbon dust. Carbon dust is effectively processed in the hot gas associated with supernova remnants (e.g., non-radiative fast shocks). How-ever, little interstellar gas is processed by such regions as nova energy is mainly expended in rejuvenating existing super-novae, eventually blowing superbubbles that vent into the lower halo. As an aside, we note that silicate dust is more effectively processed by low velocity shocks but the sputtered material is rapidly re-accreted into an (oxide) mantle, protecting the un-derlying core against further processing (Tielens2005,2009). Hence, neither the carbonaceous grains nor the silicate grains are very effectively destroyed by supernova shocks.
5.5. Carbon Dust Growth in the ISM
There is indirect observational evidence for accretion of man-tles in the diffuse ISM in the variation of the depletion pattern of silicon, magnesium, iron and other refractory elements between diffuse clouds and the intercloud medium. However, carbon does not participate in this depletion pattern (cf. Section5.4). This has several implications for carbon solids. First, as we rec-ognized in Section5.4, carbon solids are not readily destroyed in the typical shocks in the warm intercloud medium. Second, as there is a large reservoir of gaseous carbon available in dif-fuse clouds, accretion and mantle formation in the difdif-fuse ISM does not involve carbon. Hence, the re-accreted thin outer layer of interstellar dust has an oxide rather than a carbide structure. This difference in chemical behavior between carbon and, e.g., silicon is not understood: perhaps, accreted carbon is rapidly
cycled to volatile compounds (e.g., CH4, CO) that are readily
photodesorbed rather than become integrated into a carbide, silicate, or oxide network (Tielens2009).
Carbon solid formation is perhaps possible in dense molec-ular clouds. In the transition from diffuse atomic clouds to molecular clouds, the gas will go through a phase lasting some 106yr in which small hydrocarbon radicals and acetylene
deriva-tives are abundant. During this so-called early time chemistry,
the predominant form of carbon in diffuse clouds, C+, is
con-verted into the dominant carbon bearing species in molecular clouds, CO, and hydrocarbon radicals and acetylene deriva-tives are the molecular intermediaries. It is possible that these species react with PAHs and carbon solids through barrier-less neutral–neutral reactions (Parker et al.2012). This reaction path-way for carbon dust growth may be assisted by the prevalent FUV photons present during this transition phase, creating rad-ical sites on dust grain surfaces. However, this chemrad-ical route toward carbon dust growth has not been quantified.
Past models for the growth of carbonaceous solid material in dense molecular clouds have invariably focused on car-bonaceous mantles formed by energetic processing (e.g., UV photolysis or ion bombardment) of simple molecular ice mix-tures. There is ample experimental evidence for the impor-tance of this process in laboratory settings (Greenberg et al.
1995; Allamandola et al. 1999; Schutte et al. 1992).
How-ever, there is no observational evidence for the importance of energetic processing of simple ices in the ISM. In this con-text, residues produced by photolysis of ice mantles—con-taining the dominant interstellar ice molecules, H2O, CH3OH,
NH3, and CO—invariably produces absorption in the 4 to
8μm region due to nitrogen and oxygen bearing compounds
that are much stronger than the 3.4μm hydrocarbon bands.
infrared absorption spectrum of dust in the diffuse ISM (Schutte et al.1998; Chiar et al.2000; Pendleton & Allamandola2002;
Dartois et al. 2005). Moreover, the radical HCO is readily
formed in photolyzed mixtures of H2O and CO ice; however, its
distinctive carbonyl mode at 5.6μm has never been observed
in interstellar ice spectra (Tielens2013). Similarly, the organic inventory of hot cores—derived from evaporating interstellar ices near the newly formed star—is at odds with energetic pro-cessing of interstellar ices. Indeed, photolysis of ices will lead to a wide range of simple molecular products, much in con-trast to hot cores that show much chemical specificity (Tielens 2013). The latter two arguments suggest that the UV field inside dense clouds is less than assumed in these laboratory-analog studies.
5.6. PAHs and Carbon Stardust: Shattering and Coagulation
Theoretical studies of processing of interstellar PAHs by shock waves and UV photons in the ISM yield very short lifetimes, of the order of 108yr (Micelotta et al.2010a,2010b). While this lifetime is somewhat uncertain as the relevant binding energy of carbon is not well known for astrophysical relevant PAHs, this timescale is quite short compared to the injection timescale of PAHs by C-rich AGB stars. Hence, as some 10% of the elemental C is locked up in interstellar PAHs, there must be rapid replenishment process in the ISM. One such process could be shattering by grain–grain collisions in low velocity interstellar shocks (Jones et al.1996). This is a very attractive process given the highly aromatic nature and the presence of large graphene sheets in carbon soot (J¨ager et al.2009). This process will be counteracted by sputtering of the resulting PAH fragments in the shock which is calculated to be important for shock velocities of 100 km s−1or larger (Micelotta et al.2010a).
We note however that during each sojourn of a dust grain in the
warm neutral medium it will see some four 50 km s−1 shocks
as compared to only one 100 km s−1shock. So, shattering may
still be important as a source of interstellar PAHs.
Actually, calculations show that shattering is very efficient, completely breaking down a majority of the carbon dust into
small fragments even for a shock velocity of 50 km s−1(Jones
et al.1996) and perhaps even lower. Within this context, shat-tering of carbon dust must be counteracted by rapid coagulation in cloud environments. Joblin and coworkers (Rapacioli et al. 2005; Bern´e et al.2007) have analyzedSpitzerIRS spectra of photodissociation regions and concluded that the smallest car-bon dust grains consist of clustered PAHs. These so-called very
small grains are so small (300 C-atoms) that they evaporate
into their constituent PAH molecules when exposed to strong
UV fields (Rapacioli et al.2006). Larger PAH clusters would,
however, be stable against UV-driven evaporation. With 10% of the elemental C locked up in PAHs, the total cross section of PAHs is 10−21cm2/H atom. As most collisions are expected to lead to effective growth, the clustering rate is6×10−18n
Hs−1
in diffuse clouds. If all the solid carbon (1.5×10⁻⁴ per H atom) is in the form of small fragments, this timescale would be a factor of five faster. With the former number, a
cluster-ing collision takes about 25 Myr at a density 102 cm−3. So,
for clustering to be effective in building up larger structures
requires long timescales (100 Myr) in dense environments
(103cm−3). These values seem somewhat prohibitive and it is
unclear whether a balance between coagulation and shattering is possible, but perhaps the fragmentation efficiency is less than theoretically estimated.
6. SUMMARY
We have used new and previously published spectra of the aromatic and aliphatic hydrocarbon stretching vibrations to assess the structure of hydrocarbon dust in the diffuse ISM.
For the line of sight that probesAV ∼29 mag of diffuse ISM
dust along the line of sight toward the Galactic center Quintuplet Cluster, the aromatic 3.28μm CH and 6.2μm CC, in addition to
the well-studied 3.4μm aliphatic CH stretching modes, are all
detected. Careful decomposition of the various modes and use of experimentally determined absorption strengths appropriate for hydrocarbon films allow us to use these features to calculate
the fractional sp2, sp3, and H content in the carbonaceous
grains. The structure of the diffuse ISM hydrocarbons can be understood by use of the ternary diagram which describes these fractional abundances in graphic form. The low H and high aromatic content (large aromatic domains) of the diffuse ISM carbonaceous dust result in the diffuse ISM point being located
near thesp2apex along the bottom edge of the diagram.
We have placed the results of our analysis within the context of the evolution of carbon dust in the ISM. In our view, interstellar carbon dust consists of a large core of aromatic carbon surrounded by a thin layer of hydrogenated amorphous carbon. This structure is a natural consequence of the processing of stardust grains in the ISM. Analysis of IR observations of the main, stellar, carbon dust sources reveals that carbon stardust injected into the ISM has a highly aromatic character and consists mainly of large graphene sheets with very little aliphatic or aromatic hydrogen. This is in good agreement with experimental and theoretical studies. The surface layers of carbon stardust are then quickly hydrogenated by the action of thermal H atoms in diffuse interstellar clouds. This process is counteracted by UV photolysis. In the diffuse ISM, the balance of these processes will be lead to a hydrogenated
amorphous carbon surface structure with a high H/C (0.5)
ratio. In dense clouds, on the other hand, the surface will revert back to a fully aromatic structure. In any case, only a small surface layer of the grains is affected by these processes. We have also reexamined observational and theoretical evidence for carbon dust destruction by strong shocks and conclude that low velocity (<200 km s−1) shocks are not very effective in
destroying carbon dust. High velocity (200 km s−1),
non-radiative shocks are much more prone to destroy carbon dust but only a very small fraction of the ISM is processed by supernovae at these kinds of velocities. Overall, the lifetime of carbon stardust against sputtering in shocks is expected
to be very long (>7 × 10⁹ yr). Finally, we examine the
interrelationship between carbon stardust and PAH molecules. Shattering collisions of carbon stardust grains in strong shock waves may be an important source of interstellar PAHs, but it is unclear whether clustering of PAHs can reform these clusters again in the diffuse ISM.