STRUCTURE AND FUNCTION OF THE NES RELAXASE AND C-TERMINAL DOMAINS REQUIRED FOR VANCOMYCIN RESISTANCE TRANSFER
Jonathan Seaver Edwards
A dissertation submitted to the faculty of the University of North Carolina at Chapel Hill in partial fulfillment of the requirements for the degree of Doctor of Philosophy in the Department
of Biochemistry and Biophysics.
Chapel Hill 2012
Approved By:
©2012
Abstract
JONATHAN SEAVER EDWARDS: Structure and Function of the NES Relaxase and C-terminal Domains Required for Vancomycin Resistance Transfer
(Under the direction of Matthew R. Redinbo)
Antibiotic resistance has become a large burden in the healthcare setting due to increasing rates of mortality and increased healthcare costs due to extended treatment. Staphylococcus aureus is one of the most prevalent healthcare associated infections (HAI) and has recently become resistant to vancomycin (VRSA). This is a serious problem as vancomycin is one of the last lines of defense against resistant gram-positive bacteria. Given this new resistance combined with the fact that novel antibiotic approval has steadily been decreasing we sought to better understand the process of conjugative plasmid transfer (CPT) for the vancomycin resistance plasmid in S. aureus, pLW1043.
We focused on a key enzyme involved in CPT, the relaxase. The relaxase on pLW1043 has been identified through sequence analysis and is termed the nicking enzyme of S. aureus (NES). The relaxase initiates and terminates CPT. When CPT has been initiated the relaxase will bind to and nic the DNA at a specific location on the plasmid termed the oriT.
We hypothesized that inhibition of the relaxase would halt the spread of antibiotic resistance and could result in a novel class of antibiotics. To investigate this hypothesis, we set out to determine the structure of NES, understand its biological function, and investigate its interaction with the oriT DNA. Little work has been conducted in gram-positive bacteria and by understanding this critical enzymes role in CPT we hoped to provide new insights to the scientific community.
Dedication
Acknowledgements
It would be impossible to adequately thank or list all of those who have supported me in my endeavors and helped to shape the person I am today. I consider myself extremely lucky to have so many loving and motivating people in my life. Without them, I would not have been able to complete my graduate work and have the motivation to continue on. I will do my best to thank those who have been instrumental in this journey of life and I hope to impart my sincerity and appreciation to you all.
and I am forever grateful to the life lessons you have instilled upon me. From learning how to be an honest and genuine person to experiencing cultures throughout the world, what you have taught me will stay with me forever. I consider myself lucky to have known each one of you and I am honored to be part of our loving family.
There is one special person I have to acknowledge that means more to me than he will ever know. Peter D’Amato was instrumental in my development from a young boy into a man. The amount of people’s lives he touched in a positive light is impossible to count. He was a loving father, devoted coach, and an excellent mentor. I still remember the life lessons he taught us on the way to soccer games or during sleepovers at his house. I love to cook because of him and I have a serious respect for Stevie Ray Vaughan, imparted through evenings of listening and watching him play the guitar. Mr. D’Amato’s love of life was amazing and his sense of what was important never waivered. I know he is looking down on all of us that were in his life, and I hope I can be half as good of a man as he was. Thank you.
I would like to acknowledge Bob Lenzi, my high school biology teacher. I still talk to him today and he was instrumental in allowing me to develop my passion for science. Were it not for him, I would have never majored in biology and gone down the path I am on today. I am still puzzled as to how and why he put up with my antics, but I am forever grateful for it. He took me under his wing, taught me how to play racquetball after school, and is a great friend. I will never forget his patience and wisdom.
I could write an entire thesis about why my P.I., Matt Redinbo, is the best advisor on this campus. Without him I would not have had nearly as many chances to learn new aspects of science and business or grow as a scientist like I did. None of this would have been possible without the environment he provided. He leads our lab as a friend and mentor. His scientific insights are amazing and I have already been able to see the effects of what he has imparted on me during my interviews. Through my time in his lab I have not only been able to grow as a scientist but as a person, through the independence he allows. We have had some great times together, even if he did bring that guy Bill to dinner in San Francisco. I consider him a great friend and look forward to seeing what new scientific discoveries come from his work. I would also like to thank my committee: Gary Pielak, Ed Collins, Steve Matson, and Stephen Frye. They were instrumental in helping me through graduate school, both scientifically and on a personal level. Their foresight and knowledge set me up for success.
Table of Contents
List of Tables ... xii
List of Figures ... xiii
List of Abbreviations and Symbols ... xv
Chapter 1: Staphylococcus aureus Antibiotic Resistance and Conjugative DNA Transfer ... 1
1.1 Staphylococcus aureus Effect on Healthcare and Antibiotic Resistance ... 1
1.2 Conjugative Plasmid Transfer in Gram Positive Bacteria ... 3
1.3 The Relaxase NES – Domain Organization and Mechanism ... 4
1.5 References ... 12
Chapter 2: Structure of NES Relaxase in Complex with DNA ...14
2.1 Introduction ...14
2.2 Construct Design and Cloning of the NES Relaxase and Mutants ...15
2.3 Expression and Purification ...16
2.4 Circular Dichroism and Dynamic Light Scattering of NES 1_220 ...17
2.5 Crystallization, Data Collection, and Data Processing ...18
2.6 Analysis of the NES Relaxase in Complex with DNA Structure ...19
2.6.1 The Overall Fold of the Relaxase Domain of NES ...19
2.6.2 Structural Elements for the Recognition of the DNA Substrate ...21
2.7 Conclusions ...24
2.9 References ...38
Chapter 3: DNA Binding and Nicking Analysis of the Relaxase Domain of NES ...40
3.1 Introduction to Relaxase Function ...40
3.3 DNA Binding Data Introduction ...42
3.3.1 Methodology ...42
3.3.2 DNA Binding Sequence and Mutation Results ...45
3.4 Divalent Cation Analysis and DNA Cleavage Data Introduction ...51
3.4.1 Methodology ...52
3.4.2 DNA Cleavage, Metal Preference, and Mutant Analysis ...54
3.5 Conclusions ...58
3.7 References ...78
Chapter 4: Structure of C-term Domain and SAXS Molecular Envelope ...80
4.1 Introduction ...80
4.2 Construct and Oligonucleotide Design, Mutagenesis, Expression and Purification ...80
4.3 Limited Proteolysis and N-terminal Sequencing ...80
4.4 Circular Dichroism and Dynamic Light Scattering of NES C-term ...82
4.5 Crystallization, Data Collection, and Data Processing ...83
4.6 Analysis of the C-terminal Domain Structure ...84
4.7 SAXS Data Collection and Analysis ...85
4.8 Conclusions ...87
4.10 References ... 103
Chapter 5: Immobilization of Active Human Carboxylesterase 1 in Biomimetic Silica Nanoparticles ... 104
5.1 Introduction ... 104
5.2 Methodology ... 105
5.3 Results ... 107
5.3.1 Silica Encapsulation of Active hCE1 ... 107
5.3.2 Electron Microscopy of hCE1 Nanoparticles ... 109
5.4 Conclusions ... 111
5.5 References ... 119
Chapter 6: Nerve Agent Hydrolysis Activity Designed into a Human Drug Metabolism Enzyme ... 121
6.1 Introduction ... 121
6.2 Methodology ... 122
6.3 Results ... 126
6.3.1 Structure-Guided Dyad Design ... 126
6.3.2 Enhanced Nerve Agent Hydrolysis ... 127
6.3.3 Structural Mechanism for Enhanced Cyclosarin Hydrolysis ... 128
6.3.4 Bimolecular Rates of Inhibition ... 128
6.4 Conclusions ... 129
List of Tables
Table 2.1 Crystallographic Statistics ...26
Table 3.1 DNA Competition Oligonucleotides and Binding Affinities ...60
Table 3.2 DNA EMSA Oligonucleotides ...61
Table 3.3 ICP-MS Results ...62
Table 4.1 Crystallographic Statistics ...89
Table 4.2 Radius of Gyration for NES 665 + DNA at 2 Exposure Times ...90
Table 4.3 Structural Parameters Obtained for NES 665 + DNA ...91
Table 5.1 hCE1 Activity in Silica Nanoparticles ... 113
Table 5.2 Kinetic Parameters for the Metabolism of pNPB by hCE1 ... 114
Table 6.1 Rates of dephosphonylation for hCE1 mutants ... 132
Table 6.2 Bimolecular rates of inhibition, Michaelis-Menten constants, and rates of reactivation for wild-type and V146H/L363E hCE1 against racemic cyclosarin and stereoisomers of cyclosarin model compounds ... 133
Table 6.3 Inhibition and Michaelis-Menten constants for wild-type and V146H/L363E hCE1 against stereoisomers of sarin and soman model compounds .. 134
List of Figures
Figure 1.1 Increases in Antibiotic Resistance Compared to New Drugs in the Market ... 7
Figure 1.2 Structure of Vancomycin ... 8
Figure 1.3 VRSA and VRE Vancomycin Resistance Mechanism ... 9
Figure 1.4 Conjugative Plasmid Transfer ...10
Figure 1.5 Schematic Diagram for the Proposed Catalytic Mechanism of NES ...11
Figure 2.1 Structure of NES 1_220 in complex with DNA ...27
Figure 2.2 Circular Dichroism Analysis of NES 220 ...28
Figure 2.3 Dynamic Light Scattering of NES 1_220 ...29
Figure 2.4 Crystal Packing Effect on the 3’ End of the DNA Substrate ...30
Figure 2.5.A Secondary Structure Alignment ...31
Figure 2.5.B Protein Residue Interactions with the DNA Bases ...32
Figure 2.6 Single Strand DNA Base Specific Interactions ...33
Figure 2.7 NES Hairpin Loop Interaction with the DNA Hairpin ...34
Figure 2.8 Comparison of NES 220 to MobA ...35
Figure 2.9 Comparison of NES 220 to TrwC ...36
Figure 2.10 Comparison of NES 220 to TrwC – DNA Hairpin Regions ...37
Figure 3.1 NES Relaxase Direct Binding to DNA Substrate ...63
Figure 3.2 Representative DNA Competition Experiment Data ...64
Figure 3.3 Guanine 26 Interaction with NES ...65
Figure 3.4 NES Residue Interactions with Ade20 and Thy21 of the Single Strand ...66
Figure 3.5 Structural Evidence for the Binding Effects of Thy21 Mutants ...67
Figure 3.6 Structural Evidence for the Binding Effects of Ade20 Mutants ...68
Figure 3.7 NES Binding Site for the Hairpin on the DNA Substrate ...69
Figure 3.8 Structural Evidence for the Binding Effects of Gua18 Mutants ...70
Figure 3.10 Schematic of Cleavage Activity EMSA Assays ...72
Figure 3.11 EMSA Assay and Controls ...73
Figure 3.12 Divalent Cation Analysis ...74
Figure 3.13 Mutant DNA Oligo and Protein EMSA Assays ...75
Figure 3.14 Mutations Made to the Active Site of NES ...76
Figure 3.15 Hoechst 33258 Structure and Inhibition EMSA ...77
Figure 4.1 Limited Proteolysis of NES 665 ...92
Figure 4.2 N-Terminal Sequencing Results on Proteolysis Fragment ...93
Figure 4.3 NES Crystallization Constructs ...94
Figure 4.4 Circular Dichroism Analysis of NES 228_594 ...95
Figure 4.5 Dynamic Light Scattering of NES 228_594 ...96
Figure 4.6 X-ray Crystal Structure of the C-terminal Domain of NES ...97
Figure 4.7 SAXS Scattering Profiles ...98
Figure 4.8 Guinier plots for all concentrations of NES 665 + DNA ...99
Figure 4.9 Scattering Profiles and Kratky Plots for NES 665 + DNA ... 100
Figure 4.10 Fits to experimental data from GNOM and PDDF plots for NES 665 + DNA ... 101
Figure 4.11 Averaged SAXS Molecular Envelope for NES 665 + DNA ... 102
Figure 5.1 Activity of hCE1 Nanoparticles with Various Catalysts ... 115
Figure 5.2 SEM Images of Silica Nanoparticles ... 116
Figure 5.3 TEM Images of Silica Nanoparticles ... 117
Figure 5.4 Microbore Column Detection of Pesticide ... 118
Figure 6.1 Organophosphate (OP) inhibition of human carboxylesterase 1 (hCE1) ... 136
Figure 6.2 Human carboxylesterase 1 active site structure ... 137
Figure 6.3 Reactivation of hCE1 following nerve agent exposure ... 138
List of Abbreviations and Symbols
% percent
° degree
4-MUA 4-methylumbelliferone
6FAM fluorescein
A percent activity at time t
α alpha-helix
A0 initial activity at t=0
Å angstrom
AChE acetylcholinesterase
Amax maximal percent recovery
Au gold
AU asymmetric unit
β beta-strand
BChE butyrylcholinesterase
BSA bovine serum albumin
C Celsius
CD circular dichroism
CDC center for disease control
cDNA complementary deoxyribonucleic acid
cm centimeter
CPD cysteine protease domain
CPT conjugative plasmid transfer
ddH2O double distilled water
DLS dynamic light scattering
DNA deoxyribonucleic acid
dNTP deoxyribonucleotide triphosphate dsDNA double stranded deoxyribonucleic acid EDTA Ethylenediaminetetraacetic acid EMSA electrophoretic mobility shift assay
FA fluorescence anisotropy
g g-force
HAI healthcare acquired infection
hCE1 human carboxylesterase 1
HEPES 4-(2-hydroxyethyl)-1-piperazineethanesulfonic acid
HGT horizontal gene transfer
HL1 hairpin loop 1
HL2 hairpin loop 2
HPLC high pressure liquid chromatography
hr(s) hour(s)
HUH histidine, hydrophobic amino acid, histidine
I intensity
IC50 the concentration at 50% inhibition
I0 intensity at q=0
ICP-MS inductively coupled plasma mass spectrometry IPTG isopropyl-β-D-thiogalactopyranoside
K kelvin
k2 rate of enzyme phosphonylation
k3 rate of enzyme dephosphonylation
kB kilo base
KD dissociation constant
kDa kilodalton
KF potassium fluoride
Ki dissociation constant for the inhibitor
ki bimolecular rate of inhibition
Km the Michaelis-Menten constant
kobs observed rate of enzyme reactivation
LB lysogeny broth
LIC ligation independent cloning
M molar
µ micro
MBP maltose binding protein
µg microgram
MIC minimum inhibitory concentration
µL microliter
µM micromole
µm micron
mg milligram
min minute
mL milliliter
mm millimeter
mM millimole
MOB set of mobility enzymes
MRSA methicillin resistant Staphylococcus areus
NaCl sodium chloride
NAM N-acetylmuramic acid
NES nicking enzyme of Staphylococcus aureus
nic specific site where a relaxase cleaves the DNA substrate
nm nanometer
N-terminus, N-term amino terminus
OD optical density
oligo oligonucleotide
OP organophosphate
oriT origin of plasmid transfer
PBP2A penicillin-binding protein transpeptidase
PCR polymerase chain reaction
Pd palladium
PEG polyethylene glycol
PEI polyethyleneimine
pH negative log (base 10) of the molar concentration of hydronium ions
pKa acid dissociation constant
pM picomole
pNPB para-nitrophenyl butyrate
PVDF polyvinylidene fluoride
R5 NH2-SSKKSGSYSGSKGSKRRIL-CO2H
Rg radius of gyration
rpm revolutions per minute
s second
SAXS small-angle X-ray scattering
SDS-PAGE sodium dodecyl sulfate polyacrylamide gel
SEM scanning electron microscopy
σ error
t time
t1/2 half-time of reactivation
T4SS type four secretion system
TAE tris base, acetic acid, EDTA
TBE tris, borate, EDTA
TEM transmission electron microscopy TEMED tetramethylethylenediamine
TEV tobacco etch virus
Tm melting temperature
TMOS tetramethylorthosilicate
Tris tris(hydroxymethyl)aminomethane
u unit
v remaining percent enzyme activity
v/v volume to volume
VISA vancomycin-intermediate Staphylococcus areus
Vmax maximum enzyme rate
VRSA vancomycin resistant Staphylococcus areus
Chapter 1
Staphylococcus aureus Antibiotic Resistance and Conjugative DNA Transfer
1.1 Staphylococcus aureus Effect on Healthcare and Antibiotic Resistance
Staphylococcus aureus (S. aureus) is a gram-positive, facultative anaerobic, coccal
bacteria. It typically resides as part of the normal flora of the skin, especially around the nasal
passages 1. Nosocomial infections, or healthcare acquired infections (HAIs), are one of the top 10
causes of deaths per year in the United States and cost the healthcare system more than $20
billion annually 2. S. aureus is one of the four most common HAIs. One of the major reasons
these infections are so difficult to treat is due to the presence of antibiotic resistance. Shortly after
the introduction of the first antibiotic, penicillin, it was observed that bacteria are able to gain
resistance to these compounds 3. Furthermore, statistics from the Center for Disease Control
(CDC) demonstrate that more people die from methicillin resistant S. aureus than AIDS 4.
Because of these issues, the World Health Organization has declared antibiotic resistance a top
priority for the health of the human population. Antibiotic resistance results in a large cost to our
healthcare system by extending the average length of stay, making low cost drugs ineffective, and
allowing secondary illnesses to progress faster 5. Antibiotics select for bacteria that are able to
evade the effects of these compounds, and this selection has placed significant pressure on
pharmaceutical companies to stop development of antibiotics because it is difficult to make a
return on the investment. This lack of development results in an innovation gap for novel
compounds 6 (Figure 1.1).
One of the major concerns for healthcare professionals is the acquisition of vancomycin
resistance by bacteria. Vancomycin is a glycopeptide antibiotic (Figure 1.2) that is efficient at
last resort due to drug administration and toxicity issues 7. It was discovered in 1953 in a soil
sample from the jungles of Borneo. The primary mechanism of action is to inhibit cell wall
synthesis in gram-positive bacteria. It does this by binding to terminal D-alanyl-D-alanine
moieties found on the N-acetylmuramic acid (NAM) and N-acetylglucosamine (NAG) peptides.
This results in a large hydrophilic molecule being present in the forming cell wall that prevents
the efficient crosslinking and elongation of polymers, and results in cell death.
S. aureus has shown the ability to rapidly develop resistance to numerous antibiotics. As
previously mentioned, after penicillin was introduced in the 1940’s it was found that 60% of
isolates contained a β-lactamase that contributed to penicillin resistance 8. Methicillin was
introduced in 1961 as semisynthetic version of a β-lactam that would be able to evade the effects
of penicillin resistance. However, methicillin-resistant S. aureus (MRSA) was soon identified.
This resistance was possible because of the acquisition of the mecA gene that encodes for an
alternate penicillin-binding protein transpeptidase (PBP2A) 9,10. Furthermore, other classes of
antibiotics have been developed that had an effect on S. aureus but resistance soon emerged.
These antibiotics include macrolides, lincosamides, aminoglycosides and quinolones, as well as
newer antibiotics such as linezolid, daptomycin, and quinupristin-dalfopristin. As a result of this
resistance, vancomycin, licensed in 1958, has become the drug of choice for difficult to treat S.
aureus infections. Contrary to the other antibiotics it took nearly 40 years for any type of
resistance to vancomycin to emerge. In 1997 the first reported case of a clinical isolate of S.
aureus that had reduced susceptibility to vancomycin (MIC = 8 µg/mL) was identified and termed
vancomycin-intermediate S. aureus (VISA) 11. This strain of S. aureus is able to evade the effects
of vancomycin through producing more D-ala-D-ala targets, which vancomycin recognizes, in its
peptidoglycan layer. By creating a thicker cell wall the bacteria are able to evade the effects of
vancomycin before it is able to completely disrupt the cell wall resulting in cell death 12-14. In
2002 a S. aureus isolate with a MIC for vancomycin of 1024 µg/mL was found in a dialysis
(pLW1043) in this isolate the vanA gene cluster was found 16. This strain of vancomycin-resistant
S. aureus is now referred to as VRSA.
The vanA gene cluster allows for the resistance pathway to become inducible in VRSA.
This is a great benefit to the bacteria because VISA isolates and other resistant bacteria often
spend considerable resources evading the effects of antibiotics. By only supporting vancomycin
resistance pathways when the drug is present, these bacteria are at significant advantage to other
resistant bacteria. Upon sensing vancomycin the bacteria are able to initiate this alternate pathway
for cell wall synthesis. Effectively, the bacteria eliminate the old D-ala-D-ala targets and replace
them with D-ala-D-lac 17. This allows for the continual growth of the cell wall while in the
presence of vancomycin (Figure 1.3).
1.2 Conjugative Plasmid Transfer in Gram Positive Bacteria
Bacteria store their genetic material on either a chromosome or an extra-chromosomal
element. The extra-chromosomal elements are often mobilizable and are able to move between
bacterial hosts as well as into chromosomes. Extra-chromosomal elements include gene cassettes,
transposons, bacteriophages, and single- or double-stranded plasmids 18-20. Bacteria are able to
transfer their genetic material through two routes depending on the direction of transfer. Vertical
gene transfer is the process through which bacteria will duplicate the genetic material and
distribute a copy of both chromosomal and extra-chromosomal elements to each of the daughter
cells. Horizontal gene transfer (HGT) is the process in which the extra-chromosomal elements are
copied and distributed to a recipient bacterial cell. HGT is the primary pathway responsible for
the dissemination of extra-chromosomal elements that contain antibiotic resistance genes 21.
HGT transfer of double-stranded DNA (dsDNA) plasmids between bacteria is referred to
as conjugative plasmid transfer (CPT). dsDNA plasmids are classified into two major categories
based on their ability for transfer: conjugative or mobilizable. Both types of plasmids contain the
mobility (MOB) set of enzymes that allow for DNA replication. Conjugative plasmids contain the
donor to recipient bacteria during CPT. Mobilizable plasmids can be transferred but do not posses
all of the genes necessary for self transfer requiring another plasmid or chromosome with T4SS
capabilities 19.
To date, more information is known about the process of HGT in gram-negative bacteria,
and as such, that information is used as a model system for gram-positive bacteria. The major
differences in the transfer mechanism are believed to be due to the difference in the formation of
the cell walls and membranes between gram-negative and gram-positive bacteria. Gram-negative
bacteria have a cytoplasmic membrane followed by a thin layer of peptidoglycan and an outer
membrane. In contrast, gram-positive bacteria have a cytoplasmic membrane covered by a thick
outer layer of peptidoglycan. The main differences in HGT between the species is believed to
arise in the way these cells form cell-cell contact to initiate the transfer process 21.
When cells make tight cell-to-cell contact CPT can begin. During conjugation, two
multi-protein complexes form to process the DNA. The first complex, T4SS in gram-negative species,
assembles to mediate DNA transfer from donor to recipient. The second complex, the relaxosome,
forms in unison with the T4SS and prepares the DNA for transfer 21. Together these complexes
allow the cell to transfer a plasmid via conjugation (Figure 1.4). The components of the
relaxosome vary between species and plasmids but have similar functions. In order to have
successful conjugation two factors are required of the plasmid. An origin of transfer (oriT) must
be present to act as a cis regulator and a site where conjugation initiates and terminates termed nic.
Also, there must be a gene encoding a site-specific relaxase that cleaves a phosphodiester bond of
single stranded DNA at the nic site 22-24. These enzymes are present in all relaxosomes and
provide a novel target for antibiotics.
1.3 The Relaxase NES – Domain Organization and Mechanism
Relaxases are an integral part of the relaxosome and are responsible for carrying out the
DNA cleavage and religation reactions. They are transferases that can cleave and religate ssDNA
relaxase domain while the C-terminal domains can have helicase, primase, or other activities that
depend on the host in which the relaxase resides 25. The relaxase present in the VRSA plasmid
pLW1043 is named nicking enzyme of S. aureus (NES). Interestingly, in NES the C-terminal
domain shows no relationship to these previously described functions based on sequence
homology or secondary structure prediction. Relaxases are separated into two large families, Mob
or Rep, based on the order of the elements contained in their conserved motifs 26. Motif I consists
of one to four conserved catalytically active tyrosines. Motif II will have either a conserved
aspartic acid or glutamic acid 27. Motif III contains two conserved histidine residues that are
proposed to coordinate a divalent metal ion in the transesterifcation reaction 28. The typical
histidine motif is HUHUUU where U represents a bulky hydrophobic amino acid. The one
catalytically active tyrosine of NES is N-terminal to the HUH motif, thus classifying it as a Mob
type relaxase.
Relaxases initiate and terminate conjugation through their single stranded nicking and
ligation activity. They recognize and bind DNA at a specific site on the plasmid called the oriT.
By recognizing specific bases present in the oriT, the relaxase can bind to the proper location on
the plasmid. Once the relaxase has bound the oriT it will catalyze the cleavage of the scissile
phosphodiester bond 29. The active site will position the DNA so that the tyrosine hydroxyl can
act as a nucleophile to attack the scissile bond in the DNA backbone. After cleavage, the 5’ end
of the DNA is covalently bound to the relaxase via a phosphodiester bond. Figure 1.5 depicts the
proposed mechanism for NES. The HUH motif is shown coordinating a Ni2+ cation as was
determined from ICP-MS (Table 3.3). A specific base, such as a water molecule, is most likely
abstracting the hydrogen from the hydroxyl on the catalytic tyrosine because the structure did not
reveal any amino acid side chains within the appropriate distance. Once the DNA is positioned by
the divalent cation the tyrosine can attack the scissile phosphate at the nic site between Gua28 and
DNA will then be transferred in a 5’ to 3’ direction into the recipient bacteria. The reaction is
reversible with the 3’ hydroxyl acting as a nucleophile 29.
NES was first classified by Climo et. al in 1996 25. They were able to demonstrate that
NES is required for the successful conjugative transfer of the plasmid pGO1. They were also able
to locate the oriT on the plasmid and show that the relaxase cleaves where it would be predicted
to based upon other sequence similarities of well characterized conjugative plasmids. The
N-terminal region of NES on plasmid plw1043 has a 26% sequence similarity with the MobA
relaxase but no sequence similarity is present for the C-terminal domain. The C-terminal could
prove to be a dimer interface as suspected for TraI of the plasmid RP4 22 or act as a docking
domain in the relaxosome. Once bound, the relaxase will catalyze the transesterifcation of the
DNA at the nic site. This will allow the DNA to be unwound and transferred into the recipient
cell. Many structures of gram-negative relaxases have been solved with inhibitors or in complex
with DNA. However, there is only one structure of a Mob relaxase containing a single tyrosine in
the active site. Furthermore, it was in apo form and from a gram-negative organism 30. The goal
of this research is to learn more about the biochemical function of NES as well as determine the
crystal structure of the enzyme for use in structural analysis through mutations and to develop
A. Increase in Drug Resistance Among Pathogens B. Decreased Number of New Drugs in the Market
Source: Clinical Micro Infect 2004; 10 (Suppl. 4): 1-9 Source: Nat Biotech 2006 24: 1521
Source: Hughes, D. (2003) Exploiting genomics, genetics and chemistry to combat antibiotic resistance, Nature reviews 4, 432-441.
Figure 1.3 VRSA and VRE Vancomycin Resistance Mechanism
5’
3’
3’
5’
Donor CellRecipient Cell
Transconjugate Cell
NES
NES
Figure 1.4 Conjugative Plasmid Transfer
Schematic representation of CPT in bacteria. A donor cell is shown with chromosomal DNA and a resistance plasmid that is capable of transfer. Upon the formation of the Type 4 Secretion System (T4SS) the relaxosome, including NES, will bind to the oriT and perform the transesterification reaction at the nic site to form the covalent complex. The components in the relaxosome will join with the coupling protein to allow NES to transfer the DNA into the recipient cell in a 5’ to 3’ direction. Once transfer is complete the 3’ hydroxyl on the transferred strand can attack the tyrosine-phosphate bond to recircularize the DNA. The host replication machinery will then duplicate the DNA so each will have double stranded resistance plasmids.
Resistance Plasmid Chromosomal
DNA
NES
Figure 1.5 Schematic Diagram for the Proposed Catalytic Mechanism of NES
1.5 References
1. Kluytmans, J., van Belkum, A. & Verbrugh, H. Nasal carriage of Staphylococcus aureus: epidemiology, underlying mechanisms, and associated risks. Clin Microbiol Rev 10, 505-520 (1997).
2. US Department of Health and Human Services Agency for Healthcare Research and Quality. 2010. Healthcare-Associated Infections, http://www.ahrq.gov/qual/hais.htm, (October 2011).
3. Rammelkamp, C. H., Maxon, T. Resistance of Staphylococcus aureus to the action of penicillin. Proc. Royal Soc. Experim. Biol. Med. 51, 386-389 (1942).
4. Centers for Disease Control and Prevention. ABCs Report: Methicillin-Resistant Staphylococcus aureus, 2005 (Updated), http://www.cdc.gov/abcs/reports-findings/survreports/mrsa05.html.
5. World Health Organization (2001). WHO Global Strategy for Containment of Antimicrobial Resistance.
6. Walsh, C. Where will new antibiotics come from? Nat Rev Microbiol 1, 65-70, doi:10.1038/nrmicro727 (2003).
7. Knox, J. R. & Pratt, R. F. Different modes of vancomycin and D-alanyl-D-alanine peptidase binding to cell wall peptide and a possible role for the vancomycin resistance protein. Antimicrob Agents Chemother 34, 1342-1347 (1990).
8. Barber, M. & Rozwadowska-Dowzenko, M. Infection by penicillin-resistant staphylococci. Lancet 2, 641-644 (1948).
9. Matsuhashi, M. et al. Molecular cloning of the gene of a penicillin-binding protein supposed to cause high resistance to beta-lactam antibiotics in Staphylococcus aureus. J Bacteriol 167, 975-980 (1986).
10. Katayama, Y., Ito, T. & Hiramatsu, K. A new class of genetic element, staphylococcus cassette chromosome mec, encodes methicillin resistance in Staphylococcus aureus. Antimicrob Agents Chemother 44, 1549-1555 (2000).
11. Hiramatsu, K. et al. Dissemination in Japanese hospitals of strains of Staphylococcus aureus heterogeneously resistant to vancomycin. Lancet 350, 1670-1673, doi:10.1016/S0140-6736(97)07324-8 (1997).
12. Cui, L. et al. Cell wall thickening is a common feature of vancomycin resistance in Staphylococcus aureus. J Clin Microbiol 41, 5-14 (2003).
13. Cui, L., Murakami, H., Kuwahara-Arai, K., Hanaki, H. & Hiramatsu, K. Contribution of a thickened cell wall and its gultamine nonamidated component to the vancomycin resistance expressed by Staphylococcus aureus Mu50. J Antimicrob Chemother 44, 2276–2285 (2000).
15. Chang, S. et al. Infection with vancomycin-resistant Staphylococcus aureus containing the vanA resistance gene. N Engl J Med 348, 1342-1347 (2003).
16. Weigel, L. M. et al. Genetic analysis of a high-level vancomycin-resistant isolate of Staphylococcus aureus. Science 302, 1569-1571 (2003).
17. Hughes, D. Exploiting genomics, genetics and chemistry to combat antibiotic resistance. Nat Rev Genet 4, 432-441 (2003).
18. de la Cruz, F. & Davies, J. Horizontal gene transfer and the origin of species: lessons from bacteria. Trends Microbiol 8, 128-133 (2000).
19. Lanka, E. & Wilkins, B. M. DNA processing reactions in bacterial conjugation. Annu Rev Biochem 64, 141-169, doi:10.1146/annurev.bi.64.070195.001041 (1995).
20. Smillie, C., Garcillan-Barcia, M. P., Francia, M. V., Rocha, E. P. & de la Cruz, F. Mobility of plasmids. Microbiol Mol Biol Rev 74, 434-452, doi:10.1128/MMBR.00020-10 (2010).
21. Grohmann, E., Muth, G. & Espinosa, M. Conjugative plasmid transfer in gram-positive bacteria. Microbiol Mol Biol Rev 67, 277-301, table of contents (2003).
22. Pansegrau, W. & Lanka, E. Mechanisms of initiation and termination reactions in conjugative DNA processing. Independence of tight substrate binding and catalytic activity of relaxase (TraI) of IncPalpha plasmid RP4. J Biol Chem 271, 13068-13076 (1996).
23. Llosa, M. & de la Cruz, F. Bacterial conjugation: a potential tool for genomic engineering. Res Microbiol 156, 1-6, doi:10.1016/j.resmic.2004.07.008 (2005).
24. Wilkins, B. M. a. L., E. Bacterial Conjugation. Clewell, D. B., Ed. edn, 105-136 (Plenum Press, 1993).
25. Climo, M. W., Sharma, V. K. & Archer, G. L. Identification and characterization of the origin of conjugative transfer (oriT) and a gene (nes) encoding a single-stranded endonuclease on the staphylococcal plasmid pGO1. J Bacteriol 178, 4975-4983 (1996).
26. Koonin, E. V. & Ilyina, T. V. Computer-assisted dissection of rolling circle DNA replication. Biosystems 30, 241-268 (1993).
27. Francia, M. V. et al. A classification scheme for mobilization regions of bacterial plasmids. FEMS Microbiol Rev 28, 79-100 (2004).
28. Pansegrau, W., Schroder, W. & Lanka, E. Concerted action of three distinct domains in the DNA cleaving-joining reaction catalyzed by relaxase (TraI) of conjugative plasmid RP4. J Biol Chem 269, 2782-2789 (1994).
29. Agundez, L., Gonzalez-Prieto, C., Machon, C. & Llosa, M. Site-specific integration of foreign DNA into minimal bacterial and human target sequences mediated by a conjugative relaxase. PLoS One 7, e31047, doi:10.1371/journal.pone.0031047 (2012).
Chapter 2
The Structure of the NES Relaxase in Complex with DNA
2.1 Introduction
The relaxase domain of NES was examined to elucidate its mechanism of DNA binding
and cleavage during conjugative plasmid transfer (CPT). Indeed, because relatively little detailed
biochemical and structural work has been conducted on plasmid systems from Gram-positive
bacteria, a central goal was to understand if the relaxase on pLW1043 interacts with DNA in the
same manner as the relaxases found on other plasmids. The plasmid pLW1043 was found in a
clinical VRSA strain; however, it is 99% identical to other, less virulent plasmids, including
pGO1 and pSK41 that do not encode vancomycin resistance. The NES genes from these three
plasmids are identical in sequence. To date, the structures of the relaxases from the F plasmid
(TraI), R388 (TrwC), pCU1 (TraI), and R1162 (MobA) have been determined 1-6. NES was predicted to contain only one functional tyrosine residue in the active site, similar to that observed
for MobA. Prior to this work, only relaxases from the plasmids F and R388 (TraI and TrwC,
respectively) with multiple redundant tyrosines had been determined in complex with DNA 1-4.
By analyzing the differences in binding and specificity, the long-term goal of this project is to use
potential subtle changes in structure to design specific inhibitors that can impede the function of
the relaxase. An additional central objective is to learn more about the relatively under-studied
Gram-positive conjugative process.
We determined the 2.9 Å resolution structure of the relaxase domain of NES (residues
1-220) in complex with DNA containing 28 nucleotides including a hairpin and single-stranded
region leading to the nic site. This represents the first structure of a single active site tyrosine
orientation as seen in TrwC-DNA complex, the NES-DNA complex structure reveals some
overall key differences, as well as more detailed distinctions. Previous relaxases have been
described as having an overall architecture of a “hand” with the β-sheet core being the “palm” and the surrounding α-helices representing the “thumb” and “fingers” holding the DNA in place. We observed our enzyme was able to bind to the DNA substrate without this thumb feature as
well as numerous differences in the residues that provide specificity for the DNA. Before the
more detailed distinctions unique to the NES relaxase are outlined, the methods and results
related to the characterization of NES will be described.
2.2 Construct Design and Cloning of the NES Relaxase and Mutants
To determine the structure of the NES enzyme, multiple attempts at crystallization were
made. Initially the full-length protein was used for crystallization trials, but significant
degradation was found in the resulting crystals. (This will be covered in Chapter 4 when
discussing the C-terminal domain structure.) The amino acid sequence of NES (GenBank:
AE017171) was input in the Phyre server 7 and the relaxase minMobA was found to be the best sequence and structural match for N-terminal portion of NES. Analysis of the resulting alignment
showed that the characteristic motifs of a relaxase were present and that NES should have a
similar fold compared to MobA. The structure of minMobA incorporated the N-terminal 186
amino acid fragment of the enzyme. Primers were designed for the NES relaxase domain using
the alignments to search for optimal places to end the fragment such as loops or disordered
regions and 5 constructs were selected. Integrated DNA Technologies (IDT) commercially
synthesized the primers and all cloning or mutagenesis was verified using Eton Biosciences Inc.
The primers were diluted to 100 mM stock solutions in ddH20 and subsequently diluted to 10 mM
working stock solutions. Standard ligation independent cloning techniques, as described by Stols
et al.8, were used to generate the expression plasmids encoding the desired NES fragments. The
vectors. The N-terminal His6 or His6 maltose-binding protein (MBP) tag was cleaved off after
purification using tobacco etch virus (TEV) protease.
NES primers were also designed for incorporation into the CPD expression system that
was generated in our lab by Joseph Lomino and Daniel Yao. The initial CPD expression system
described by Shen et al. 9 was modified through codon optimization, changing the hexa-his tag to a deca-his tag, and adding an longer glycine linker between the protein and cleavage site
(CPD-Lasso). Again, the primers were ordered from IDT, amplified, and cloned into the CPD-Lasso
expression vector using the NdeI (5’) and BamHI (3’) restriction endonuclease sites. The
constructs result in a C-terminal CPD-His10 tag on the protein that was cleaved using 2 mM
inositol hexakisphosphate (InsP6) incubated for 3 hours at 4 °C.
All point mutations were done using site-directed mutagenesis in the corresponding
expression plasmid. Again, sequencing for the mutations was confirmed using Eton Biosciences,
Inc. for DNA sequencing.
2.3 Expression and Purification of the NES Relaxase
The cloned constructs were transformed into chemically competent E. coli BL21 (DE3)
AI cells. Transformed cells were grown in 1.5 liters of lysogeny broth (LB), in the presence of
ampicillin, at 37 °C, with shaking, to an optical density of 0.6-0.8. An L-Arabinose solution was
added to the growth at a final concentration of 0.2% v/v, and the temperature was reduced to
18 °C for 30 minutes. Protein expression was induced with 100 µM isopropyl-β
-D-thiogalactopyranoside (IPTG) and cells were allowed to grow for 16 hours. The resulting growths
were spun at 4,500 x g for 30 minutes at 4 °C and split into six pellets that were stored at -80 °C.
Individual pellets were resuspended in nickel A buffer (500 mM NaCl, 25 mM imidazole, 20 mM
potassium phosphate buffer pH 7.4, and 0.02% v/v sodium azide) along with protease inhibitor
tablets (Roche), DNase, and lysozyme. The slurry was lysed using a Fischer Scientific Sonic
Dismembrator at 50% power for 3 cycles of 1 minute with 1 second intervals at 4 °C. The lysed
HisTrap column (GE Healthcare). None of the N-terminal His6 or His6 MBP constructs expressed
solubly after the removal of the tag by TEV. For the CPD constructs they were allowed to bind to
the HisTrap column and incubated with InsP6 for 3 hours at 4 °C. The resulting protein was then
further purified over a Superdex 200 column (GE Healthcare) pre-equilibrated in sizing buffer
(300 mM NaCl, 50 mM Tris buffer pH 7.4, and 0.02 % v/v sodium azide). Fractions containing
NES 1_220, which was found to contain the functional and soluble relaxase domain of NES, were
combined and used for site directed mutagenesis as well as the following experiments.
To obtain protein in complex with DNA an active site mutant Y25F was used. A piece of
DNA with the sequence 5’-ACGCGAACGGAACGTTCGCATAAGTGCGCC-3’ was
synthesized by IDT and used as the substrate. After nickel purification the DNA was added in a
2.25 molar excess to the enzyme and size exclusion chromatography was performed for final
purification. The presence of DNA was confirmed measuring the absorbance of A260/280 on a
nanodrop (Thermo Scientific).
2.4 Circular Dichroism and Dynamic Light Scattering of NES 1_220
Circular dichroism (CD) and dynamic light scattering (DLS) were used in conjunction to
confirm that the protein was folded, stable, and monodispersed in solution. CD measurements
were made on a Chirascan CD Spectrometer (AppliedPhotophysics) with the protein diluted into
CD buffer (200 mM KF, 10 mM potasim phosphate buffer pH 7.4) to a concentration of 5 µM. A
wavelength scan from 190-260 nm revealed a protein that was folded containing both α-Helices
and β-Sheets. This was determined by the presence of a positive peak at 190 nm and a double
negative peak at 208 and 225 nm. However, the double negative peaks were reduced as to what
would be expected for only α-Helices and this can be attributed to the presence of β-sheets that
have a negative peak at 215 nm which will affect the curves (Figure 2.2.A). The resulting
ensemble of peaks made us believe that the protein was in fact folded and a combination of both
sheets and helices which is predicted when comparing NES 1_220 to similar structures. Thermal
most distinguishable peak from the wavelength scan. The melting temperature (Tm) was
determined to be approximately 58 °C by observing where half of the protein was in a folded
versus unfolded state from the data (Figure 2.2.B).
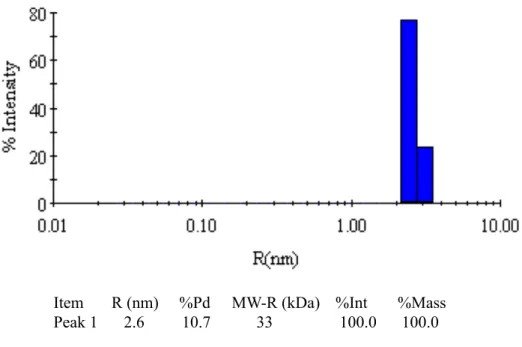
Dynamic light scattering (DLS) was performed on a Dynapro Dynamic Light Scattering
Plate Reader (Wyatt Technology Corp.). Prior to measurement the samples were spun at 13,000 x
g to ensure no dust or sediments would affect the measurement. The sample of NES 1_220 was
measured at 10 mg/mL and showed a single monodisperse peak with a polydispersity of 10.7%
and a radius of hydration of 2.6 nm (Figure 2.3). The molecular weight calculated from this
reading was 33 kDa, larger than the actual molecular weight of 26 kDa for NES 1_220 but
perhaps indicative of an elongated protein shape in the absence of DNA. Taken together, though,
these data are representative of a well folded, stable, and pure protein.
2.5 Crystallization, Data Collection, and Data Processing
Selenomethionine-substituted protein was used in crystal trials to obtain phase
information upon data collection. NES 1_220 + DNA (10 mg/mL) was crystallized in a solution
containing 16% PEG 8,000, 120 mM calcium acetate, 80 mM sodium cacolydate (pH 6.5), and
20% glycerol v/v. The trays were set with drop ratios of 1:1, 1:2, and 2:1 of protein to mother
liquor respectively. Vapor diffusion hanging-drop trays were set at 20 °C to obtain well formed
crystals. The crystallization solution was found to be an adequate cryoprotectant in subsequent
diffraction experiments performed at the UNC Biomolecular X-ray Crystallography Facility. The
crystals were flash frozen in liquid nitrogen for data collection at 100K.
Data sets were obtained on the 23_ID_B beamline maintained by The National Institute
of General Medical Sciences and National Cancer Institute Collaborative Access Team
(GM/CA-CAT) at the Advanced Photon Source (APS) part of the Biosciences Division (BIO) at Argonne
National Laboratory (ANL). A fluorescence scan was performed at the selenium absorption edge
to confirm that the seleno-methione substitution was successful. The collection strategy used
collect 100° of data. The data sets were indexed and scaled using HKL-2000 processing software
10. Indexing resulted in resulted in a space group of P6
422 with one NES relaxase-DNA complex
per asymmetric unit. The best data was obtained when the resolution was cut to 2.9 Å (Table 2.1).
Initial phases were determined using the Phenix software suite with the AutoSol function 11. Two
of the three heavy atom sites were successfully located. This was a result of the first amino acid,
methionine, not being observable in the final structure, most likely as a result of it being
processed away during expression as was seen in the MobA structure 5. The model was built
using Coot 12 by placing the seleno-methiones and iteratively building the protein from these
starting points. Refinements were performed using the Phenix refine application 11.
2.6 Analysis of the NES Relaxase in Complex with DNA Structure
2.6.1 The Overall Fold of the Relaxase Domain NES
One NES relaxase-DNA complex was observed per crystallographic asymmetric unit,
indicating that the enzyme interacts and functions with the DNA as a monomer, a conclusion
supported by size exclusion chromatography studies (data not shown). The residues 2_196 of
NES 1_220 were built into the electron density. The terminal methionine was most likely
processed away during expression and the 24 C-terminal residues are at the end of a loop that is
likely disordered in this construct. Additionally, the 5’ DNA adenine and the two 3’-terminal
cytosine bases were not visible in the electron density. The overall fold of NES 1_220 was similar
to the other relaxases studied in regard to the active site and position of the catalytic tyrosine. As
seen in Figure 2.1, the core of the enzyme is composed of 5 central anti-parallel β-strands. The
remaining two β-strands and four α-helices are structural elements and position the catalytic
tyrosine for nucleophilic attack. The two DNA binding loops clamp on either side of the hairpin
for proper substrate recognition and positioning. The central β-sheet is ordered β1-β5-β7-β6-β4
when looking down into the active site of the molecule. The HUH motif (H131 and H133) is
found at the beginning of β7 and the third H (H123) is located at the 3’ end of strand β6. This
tyrosine is located on α1 in an orientation that would allow it to perform its nucleophilic attack on
the scissile phosphate at the nic site. Ni2+ was built into the density adjacent to the chelating
histadine residues, as it was clear there was a metal bound from the difference density maps;
additional ICP-MS data indicated this metal was Ni2+ and was most highly incorporated after
purification over the Ni-resin (data not shown). However, H131A mutants were made to disrupt
the metal chelation site in the HUH motif and the Ni2+ concentration was significantly reduced
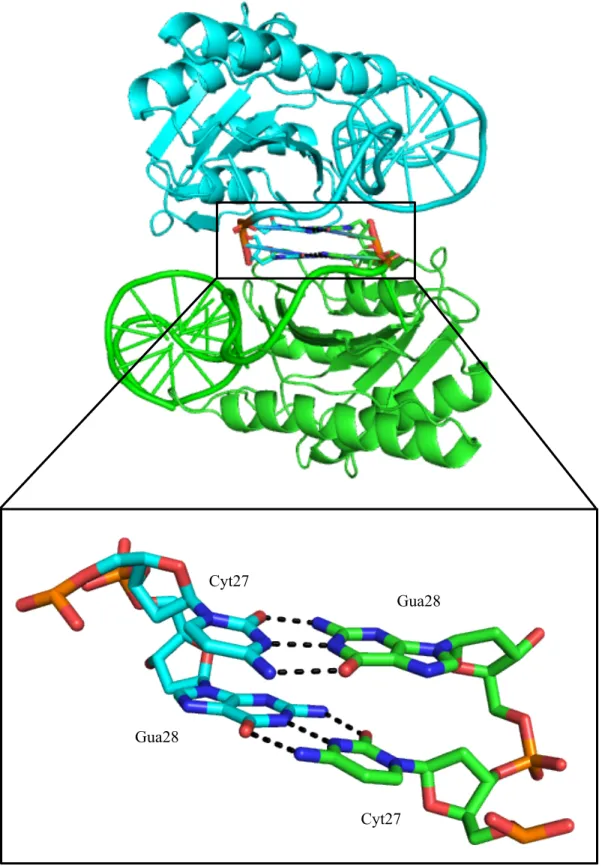
(data not shown). From Figure 2.1, it is clear the single stranded stretch of the DNA curves
around the enzyme and is held in a U turn conformation where it would be possible for the
nucleophilic attack to occur from the oxygen on the catalytic tyrosine. In the structure one can see
that the 3’ guanine appears to be flipped away from the active site. This was due to a
crystal-packing defect where the 3’ cytosine (C27) and guanine (G28) bases stacked with the
corresponding 3’ terminal bases in another molecule in the crystal (Figure 2.4).
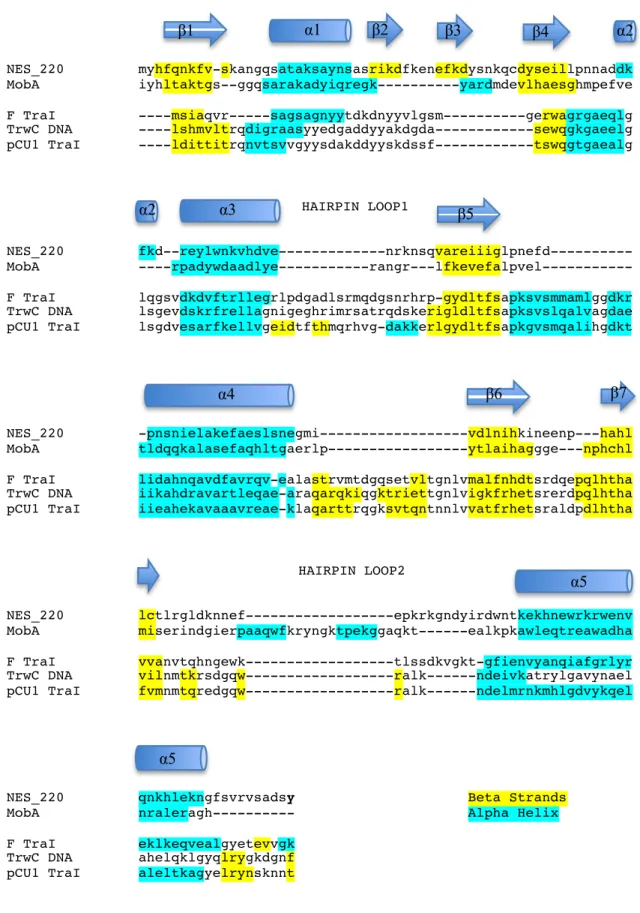
Secondary structure alignments comparing NES to the other relaxase structures reveal
some key differences between the enzymes. Figure 2.5.A compares the structure-annotated
sequences of NES_220 to MobA (PDB: 2NS6), F TraI (PDB: 2A0I), TrwC (PDB: 1QX0), and
pCU1 TraI (PDB: 3L57). The structures were aligned using DaliLite 13-15 for pairwise comparison
of the protein structures. When the relaxase domain of NES was aligned to MobA, the RMSD
was 2.2 Å over 162 equivalent Cα positions, and 28% sequence identity was observed. The
RMSDs for F TraI, TrwC, and pCU1 TraI were all 3.1 Å over 158, 155, and 153 equivalent Cα
positions, respectively, with 10%, 8%, and 5% sequence identities, respectively. Despite the
relatively low sequence identity between structures, especially for the latter three, there were
significant similarities in the overall fold. As mentioned previously, the secondary structure
elements are arranged in an analogous fashion for all of the enzymes aligned. For example, the
N-terminus is located at the beginning of β1, the first strand in the “palm” of the hand. α1 is
and F TraI, while in TrwC and pCU1 TraI the catalytic tyrosines are present on the loop between
α1 and β4 in Figure 2.5.A. This may be due to the fact that the enzymes with multiple tyrosines
have functional redundancy, and by placing such tyrosines in loops, mobility can be enhanced. In
NES exclusively, there is a short loop containing β2,3 before reaching the conserved β4 which
forms the outer edge of the other side of the “palm”. α3 is highly conserved in all of the aligned
structures, is located at the top of the beta-sheet core, and is responsible for positioning hairpin
loop 1 that interacts with the DNA substrate in NES. The loop between α3 and β5 is variable
between the structures and will be discussed in the next section. Again, β5 is highly conserved, as
it is part of the central core of the enzyme. F, TrwC, and pCU1 have an extra helix at the base of
the β-sheet core where NES and MobA only contain the conserved α4. Another difference
between NES and MobA, though, when compared to other structures is the presence of a loop
containing two short β-strands between α4 and β6. This loop is responsible for interacting with
the minor groove of the DNA substrate as seen in the structure of TrwC and NES in complex with
DNA and will be discussed in more detail in the next section. β6 and β7 are highly conserved, as
they are the final two strands present in the β-sheet core. Another major difference can be seen
between β7 and α5 in Figure 2.5.A. In both NES and MobA there is a long loop that interacts
with the DNA hairpin. In the other three, this loop is shorter and contains two small β-strands.
Finally, α5 is highly conserved in all of the structures and packs against α4 to form the back of
the enzyme. The subtle differences that were found when comparing the hairpin Loop1 and
Loop2, as well as the interactions with the single stranded stretch of the DNA substrate, explain
how these enzymes are able to achieve specificity for their specific substrates, as outlined below.
2.6.2 Structural Elements for the Recognition of the DNA Substrate
The DNA substrate has extensive interactions with the relaxase that are centered on the
two major DNA regions – the hairpin and the stretch of single-strand. Interestingly, the majority
of the interactions are found to be at the base of the hairpin and the section of single-strand DNA
interactions with two loops in NES 220 termed Hairpin Loop1 and Hairpin Loop2 (Figure
2.5.A,B). The single-stranded portion of the DNA interacts primarily with key residues found on
α5 and β1. In F TraI and TrwC, there are extra α-helices present at the C-terminus that interact
with the single stranded portion of the DNA, acting as a ‘thumb” clamping it in place 16. These
helices are not present in the smaller, single-tyrosine relaxases NES and MobA. After the nic site,
we speculate that the single-strand of DNA would continue over the active site and be held in
place through interactions with α1, β2, β3, and the loop between the β-strands in NES 220.
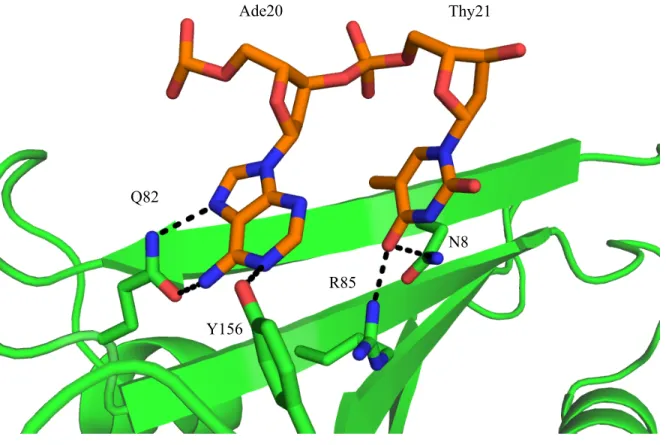
Each enzyme will have direct interactions along the single-stranded portion of the DNA.
These interactions will be specific to the DNA sequence, how the bases are presented to the
enzyme will confer specificity. Figure 2.6 illustrates how two bases on the single stranded portion
(Ade20 and Thy21) are exclusively recognized by the DNA bases present, while no interactions
occur with the phosphate backbone. Q82 and Y156 form the hydrogen bond network that
recognizes Ade20. N8 and R85 are hydrogen donors for the carbonyl oxygen on Thy21. Not all of
the bases on the single stranded portion make interactions with the DNA, for example Ade24 and
Gua25. Specific bases that do interact with the enzyme have been studied through mutational
analysis and will be discussed in the next chapter.
More surprising was the finding that the loops responsible for binding the hairpin portion
of the DNA (Figure 2.7) are vastly different between the two sets of enzymes, NES 220, MobA
vs. F TraI, TrwC, pCU1 TraI. When comparing the loops that interact with the DNA hairpin
portion of the substrate it is necessary to look at the enzymes in the two different groups
mentioned above. This is because the DNA hairpin structures are significantly different between
the two groups. Currently only two structures of relaxases in complex with the DNA hairpin
portion of the substrate have been determined, TrwC and NES 220. When comparing NES 220 +
DNA to the MobA structure, two major differences can be seen. Figure 2.8 depicts the alignment
for NES and MobA (RMSD 2.2 Å). In Figure 2.8.A the major difference arises in the β2, β3
positioned by the enzyme. When NES interacts with the DNA this portion of the enzyme might
order to form the β-strands from the small α-helix that is seen in the MobA structure (Figure
2.8.A). This would allow the enzyme to maintain tight contact with the covalently bound portion
of the enzyme during substrate transfer into the recipient cell. Another significant change in the
enzyme architecture can be observed when looking at the interactions made with the DNA that
can be observed from the NES 220 structure. Figure 2.7 depicts the two key loops that clamp the
DNA hairpin in order to bind the substrate. Loop1 interacts with the minor groove that is formed
in the hairpin while the longer Loop2 interacts with the major groove (Figures 2.5.B, 2.7). These
loops have extensive hydrogen bond interactions with both the phosphate backbone as well as a
few key bases. Loop1 is in an almost identical position in both the MobA and NES structures.
However, Loop2 has a significantly different conformation when bound to DNA. In the NES
structure Loop2 is a long loop that packs into the major groove of the DNA acting as one side of
the clamp. In the MobA structure this loop forms two short α-helices and is positioned in the open
conformation (Figure 2.8.B). One can imagine that when the DNA comes into position on the
enzyme the α-helices rearrange into loops, and the new conformation will be stabilized through
interactions with the DNA forming the double sided clamp that holds the substrate in place for the
attack at the nic site.
When comparing NES to TrwC, the larger relaxase construct, more differences can be
noted. In the comparison of the overall structural alignment (Figure 2.9) the “thumb” region of
TrwC is the first noticeable difference. This region is not present in the NES construct and could
either be due to the fact that the construct crystallized for NES was not long enough to observe
this region, the C-term may perform the thumb function in NES, or the thumb region regulates the
action of the multiple catalytic tyrosines since it is only present on those enzymes. The
biochemical data discussed in the next chapter would seem to rule out the second point as this
portion of the enzyme is able to specifically bind this substrate with low nanomolar affinity and is
specificity or binding efficiency for those enzymes. Another difference, noted in MobA as well, is
the β2,β3 region of the enzyme. As mentioned previously, this structural arrangement will most
likely be dependent on the substrate sequence and has not been thoroughly investigated. Figure
2.5 highlights the significant sequence and structural divergence that occurs in the hairpin Loop1
and Loop2 regions in TrwC and NES. The differences can be seen in the structures presented in
Figure 2.10, however they have been separated for visual simplicity. Figure 2.10.A shows the
Loop1,2 interactions that were previously discussed for NES. When comparing that to TrwC,
Figure 2.10.B, significant differences can be observed both in the enzyme secondary structure as
well as the DNA hairpin conformation. In TrwC, Loop1 is significantly longer and across the face
of the minor groove interacting with both the phosphate backbone as well as the DNA bases.
Loop1 in NES also interacts with the minor groove in the same fashion but is much shorter in
length. In TrwC the hairpin appears to be squished leading to a shorter and less well defined
minor groove. Loop2 in both constructs interacts with the DNA in a similar fashion despite the
structural differences. In NES Loop2 interacts with the DNA backbone along the left side of the
loop. The loop winds its way into the major groove where base specific interactions occur.
Despite the significant structural and sequence divergence TrwC interacts with the DNA in the
same manner. The β-strand on the left side of Loop2, Figure 2.10.B, interacts with the DNA
backbone while the loop that makes the turn to the next β-strand makes some specific base
interactions. Furthermore, both loops interact with the 5’ terminal portion of the substrate.
2.7 Conclusions
By determining the structure of NES 220 in complex with DNA we were able to make
some interesting structural observations. Firstly, we are the first group to report the structure of a
single tyrosine relaxase in complex with DNA. This result will be critical for our analysis of the
DNA binding and cleavage specificity in the following chapter as well as for our efforts to
develop novel antibiotics. The overall fold of this structure was similar to all other relaxase
architecture and the main differences arise due to key loops required for DNA binding. In the
case of NES and MobA the DNA results in subtle conformational changes between Hairpin
Loop1 and Loop2 to allow for the binding of the substrate to the enzyme. When looking at the
structures found in the TrwC group of enzymes more drastic differences were observed. Again,
despite significant lack of sequence homology there was maintenance of the enzyme core.
However, the loops required for hairpin binding achieve the same end goal while being in
completely different conformations. These differences lead to proper substrate recognition and
provide novel sites to design specific compounds that could inhibit the enzyme-substrate
interaction that could result in the development of novel antibiotics.
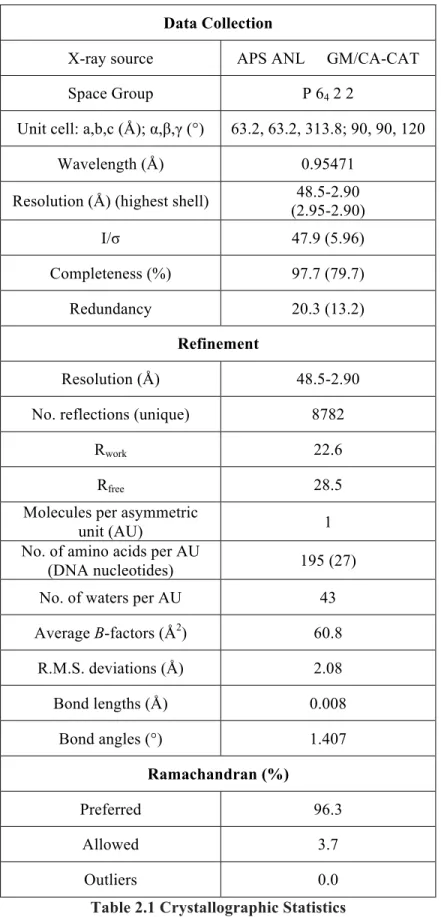
Data Collection
X-ray source APS ANL GM/CA-CAT
Space Group P 64 2 2
Unit cell: a,b,c (Å); α,β,γ (°) 63.2, 63.2, 313.8; 90, 90, 120
Wavelength (Å) 0.95471
Resolution (Å) (highest shell) 48.5-2.90
(2.95-2.90)
I/σ 47.9 (5.96)
Completeness (%) 97.7 (79.7)
Redundancy 20.3 (13.2)
Refinement
Resolution (Å) 48.5-2.90
No. reflections (unique) 8782
Rwork 22.6
Rfree 28.5
Molecules per asymmetric
unit (AU) 1
No. of amino acids per AU
(DNA nucleotides) 195 (27)
No. of waters per AU 43
Average B-factors (Å2) 60.8
R.M.S. deviations (Å) 2.08
Bond lengths (Å) 0.008
Bond angles (°) 1.407
Ramachandran (%)
Preferred 96.3
Allowed 3.7
Outliers 0.0
Figure 2.1 Structure of NES 1_220 in complex with DNA
The 2.9 Å crystal structure of NES 220 in complex with DNA. The N-term and C-term amino acids are labeled as well as the 5’ and 3’ nucleotides. The α-helices, β-strands, and hairpin loops are labeled by the order in which they appear in the sequence. α2 is hidden behind α3. The side chains for the HUH(+H) motif and the catalytic residue are shown.
Y25F
HUH (+H) Motif Hairpin Loop1
Y196
A2
β7
α1
β6 β5
β4
β3 β2
β1
α3
α4 α5
Cyt2
Gua28
Ni2+
-15 -10 -5 0 5 10 15 20
190 200 210 220 230 240 250 260
C D ( md eg ) Wavelength (nM) NES 1_220 Wavelength Scan
-12.5 -12 -11.5 -11 -10.5 -10 -9.5
0 10 20 30 40 50 60 70 80 90 100
C D ( md eg ) Temperature (Celsius)
Thermal Denaturation of NES 1_220 Monitored at 209 nM
Figure 2.2 Circular Dichroism Analysis of NES 220
A. CD wavelength scan of NES 220 at 5 µM. B. Thermal denaturation of NES 220 monitoring the change in CD signal (mdeg) at 209 nM.
A
Item R (nm) %Pd MW-R (kDa) %Int %Mass Peak 1 2.6 10.7 33 100.0 100.0
Gua28
Gua28
Cyt27 Cyt27
Figure 2.4 Crystal Packing Effect on the 3’ End of the DNA Substrate
NES_220 myhfqnkfv-skangqsataksaynsasrikdfkenefkdysnkqcdyseillpnnaddk MobA iyhltaktgs--ggqsarakadyiqregk---yardmdevlhaesghmpefve
F TraI ----msiaqvr---sagsagnyytdkdnyyvlgsm---gerwagrgaeqlg TrwC DNA ----lshmvltrqdigraasyyedgaddyyakdgda---sewqgkgaeelg pCU1 TraI ----ldittitrqnvtsvvgyysdakddyyskdssf---tswqgtgaealg
HAIRPIN LOOP1
NES_220 fkd--reylwnkvhdve---nrknsqvareiiiglpnefd--- MobA ----rpadywdaadlye---rangr---lfkevefalpvel---
F TraI lqgsvdkdvftrllegrlpdgadlsrmqdgsnrhrp-gydltfsapksvsmmamlggdkr TrwC DNA lsgevdskrfrellagnigeghrimrsatrqdskerigldltfsapksvslqalvagdae pCU1 TraI lsgdvesarfkellvgeidtfthmqrhvg-dakkerlgydltfsapkgvsmqalihgdkt
NES_220 -pnsnielakefaeslsnegmi---vdlnihkineenp---hahl MobA tldqqkalasefaqhltgaerlp---ytlaihaggge---nphchl
F TraI lidahnqavdfavrqv-ealastrvmtdgqsetvltgnlvmalfnhdtsrdqepqlhtha TrwC DNA iikahdravartleqae-araqarqkiqgktriettgnlvigkfrhetsrerdpqlhtha pCU1 TraI iieahekavaaavreae-klaqarttrqgksvtqntnnlvvatfrhetsraldpdlhtha
HAIRPIN LOOP2
NES_220 lctlrgldknnef---epkrkgndyirdwntkekhnewrkrwenv MobA miserindgierpaaqwfkryngktpekggaqkt---ealkpkawleqtreawadha
F TraI vvanvtqhngewk---tlssdkvgkt-gfienvyanqiafgrlyr TrwC DNA vilnmtkrsdgqw---ralk---ndeivkatrylgavynael pCU1 TraI fvmnmtqredgqw---ralk---ndelmrnkmhlgdvykqel
NES_220 qnkhlekngfsvrvsadsy Beta Strands MobA nraleragh--- Alpha Helix
F TraI eklkeqvealgyetevvgk TrwC DNA ahelqklgyqlrygkdgnf pCU1 TraI aleltkagyelrynsknnt
!"!
#"!
$#
"!$
#"!
"$!
"$%
β1 α1 β2 β3 β4
β5 α2
α4 α3
α2
β6 β7
α5
α5
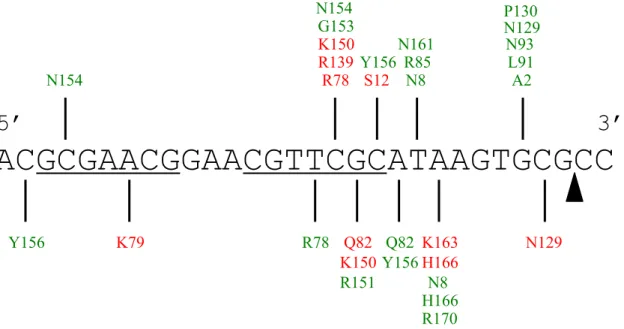
ACGCGAACGGAACGTTCGCATAAGTGCGCC
Y156 N154
K79 R78
K150 R139 R78 G153 N154 R151 Q82 K150 S12 Y156 Q82 Y156 N8 N161 R85 N8 R170 H166 K163 H166 A2 P130 N93 L91 N129
5’
3’
Figure 2.5.B Protein Residue Interactions with the DNA Bases
The DNA substrate is shown in the 5’ to 3’ direction with the hairpin section underlined and the nic site indicated by the triangle. Protein residues colored red indicate interactions via the DNA phosphate backbone. Protein residues colored green indicate interactions via the DNA bases.
Figure 2.6 Single Strand DNA Base Specific Interactions
Ade20 Thy21
Q82
Y156
R85
Figure 2.7 NES Hairpin Loop Interaction with the DNA Hairpin Hairpin Loop2
Hairpin Loop1 K79
Q83
K150 R151
Y156 N154